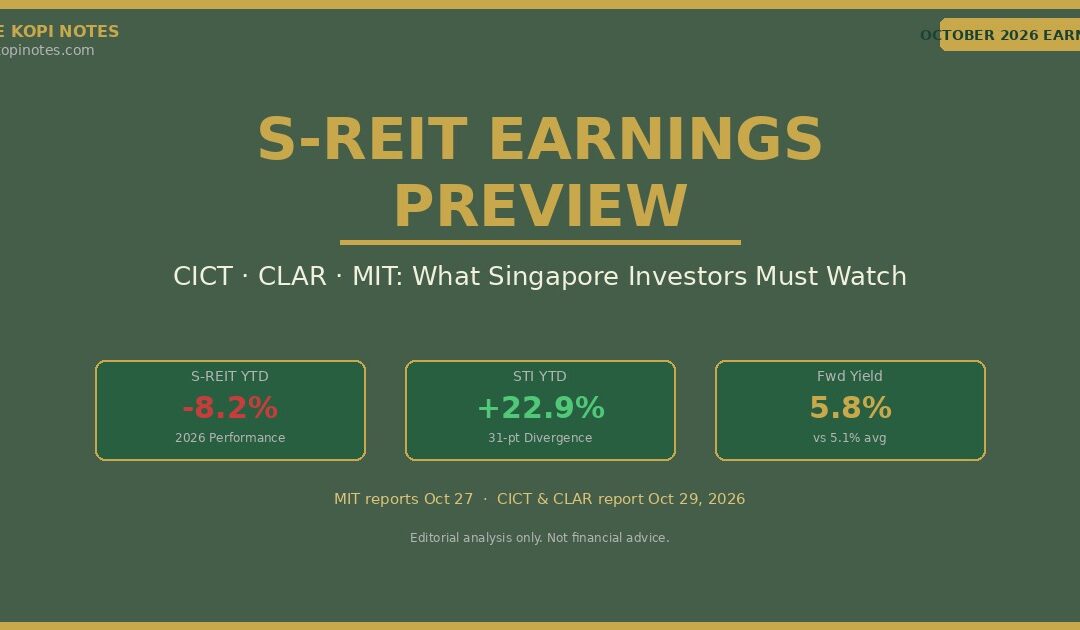
Three of Singapore’s largest blue-chip REITs — CapitaLand Integrated Commercial Trust (CICT), CapitaLand Ascendas REIT (CLAR), and Mapletree Industrial Trust (MIT) — report their latest results this October. With S-REITs down 8.2% year-to-date while the broader STI surges 22.9%, a 31-percentage-point divergence has opened up. Here’s what every Singapore retail investor needs to watch — and what the data actually says about whether this sector is a buying opportunity.
This is an editorial analysis. Not financial advice. Data verified as at 1 October 2026.
The S-REIT vs STI Divergence: Why the Gap Matters
To understand what’s at stake in October’s earnings season, you first have to reckon with the numbers. The Straits Times Index closed Q3 2026 up 22.9% year-to-date — a banner run driven by banks, tech-adjacent industrials, and property developers. Meanwhile, the FTSE ST All-Share REIT Index has shed 8.2% over the same period.
That 31-point performance gap is not a reflection of broken fundamentals. Distribution per unit (DPU) across the sector has largely held up, and in some cases, grown meaningfully. What has repriced is the multiple investors are willing to pay for those distributions — and that repricing is entirely explained by one force: rising interest rates.
The Monetary Authority of Singapore (MAS) tightened its S$NEER slope by 50 basis points in April 2026, followed by a surprise 25-basis-point increase in July. Markets are now pricing in a third tightening at the October MAS meeting, with the Fed funds rate already at 3.75–4.00% after the September FOMC hike.
Higher risk-free rates compress the premium investors demand for holding REITs. As the S-REIT forward distribution yield rises to 5.8% — above its long-run average of 5.1% — the question is whether Q3/Q4 earnings can close the gap between price and value.
What to Watch in October 2026: Three Reporting REITs
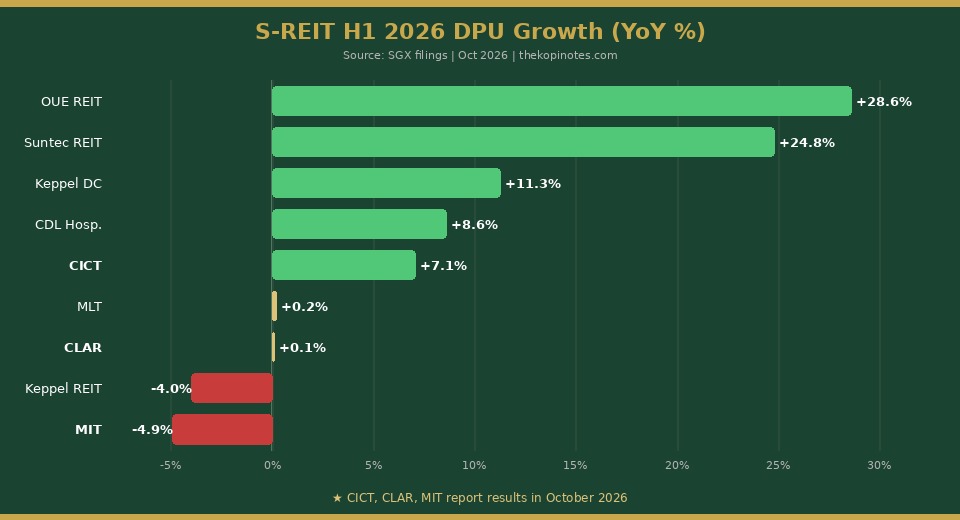
Chart 1: S-REIT H1 2026 DPU Growth (%) — Top REITs by distribution performance
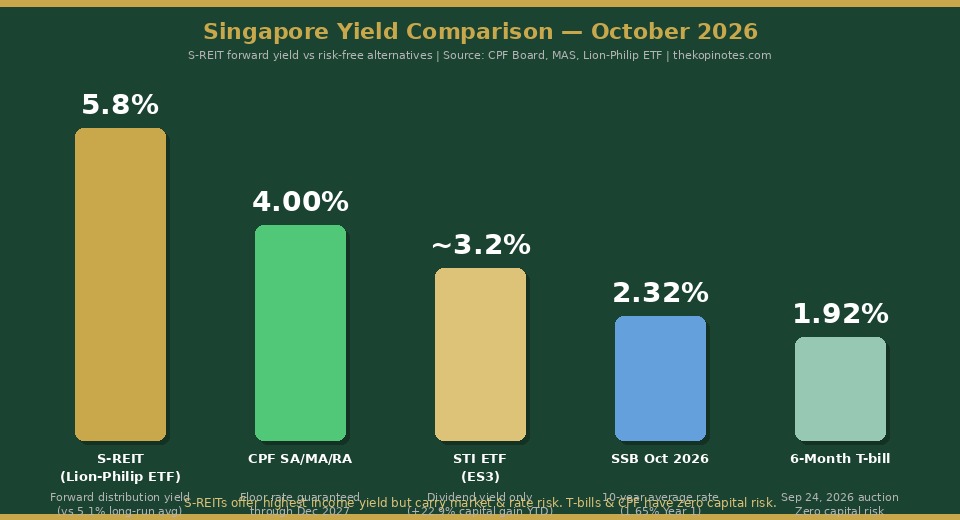
Chart 2: Singapore Yield Comparison — S-REIT vs CPF vs T-bill vs SSB (October 2026)
1. CapitaLand Integrated Commercial Trust (SGX: C38U) — Reports 29 October 2026
CICT is the sector bellwether and probably the most watched name in October. Having already delivered DPU growth of 7.1% to S$0.0602 in H1 2026 — the strongest first-half showing among the three major retail-commercial REITs — the trust enters this reporting period with tailwinds.
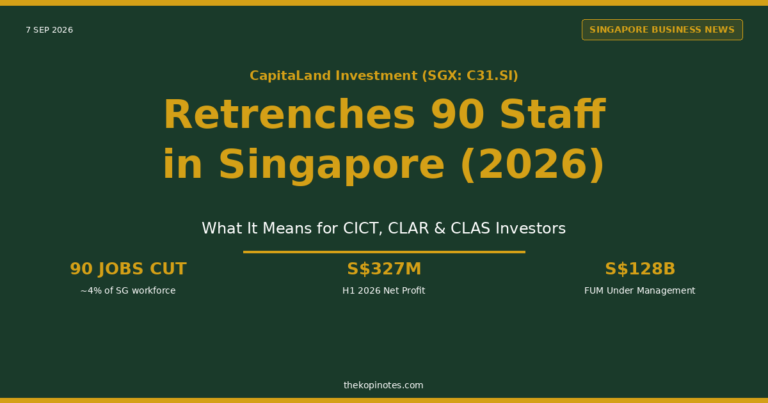
The big catalyst was the July 2026 acquisition of Paragon for S$3.9 billion, a premium Orchard Road retail and medical mall that immediately boosted revenue. Retail occupancy at CICT’s portfolio sits at 97.7%, well above the 93.5% industry benchmark. Gearing fell to 37.4% post-Paragon, partly because of Asia Square Tower 2 — the office tower CICT is expected to divest for approximately S$2.45 billion, proceeds from which will fund debt reduction and potentially further acquisitions.
Three things to watch in October results:
- Paragon’s contribution: Its first full quarter as part of the portfolio. Any upside vs. acquisition yield assumptions (the trust guided ~4.5% NPI yield) would be a positive catalyst.
- Asia Square Tower 2 update: If completion occurs before year-end, balance sheet gearing could drop toward 33–35%, significantly reducing refinancing risk.
- Tenant retention rates: In a higher-rate environment, tenant stress tends to surface later in the year. A dip from 97.7% occupancy would be a red flag.
Read our full CICT 2026 analysis →
2. CapitaLand Ascendas REIT (SGX: A17U) — Reports 29 October 2026
CLAR’s H1 2026 headline numbers are misleading at first glance. Revenue rose 6.7% year-on-year to S$805.5 million, and total distributable income climbed 8.6% to S$359.4 million — but DPU grew only 0.1% to S$0.07482 because of unit dilution from equity fundraising rounds.
This is the single most important issue for CLAR unitholders: distributable income is growing, but not fast enough to offset the expanded unit count. Portfolio occupancy also slipped to 89.1% from 91.8% a year earlier — primarily in its overseas markets (Australia and the UK).
What to watch:
- Occupancy recovery: Can CLAR claw back to 91%+ by leasing up vacant Australia logistics space? A 1-percentage-point occupancy gain translates to roughly 0.3–0.5% DPU accretion on the current portfolio.
- Kim Chuan divestment proceeds: The Singapore property was sold for S$200.4 million in H1. Watch for capital recycling announcements into higher-yielding assets (data centres or new economy logistics).
- Gearing level: As of H1, gearing stood at approximately 36.8%. Any new acquisition funded by equity would further dilute DPU — investors will want management to explain its capital allocation roadmap clearly.
3. Mapletree Industrial Trust (SGX: ME8U) — Reports 27 October 2026
MIT is the most challenged of the three heading into October. Q1 FY2026/2027 revenue fell 7.7% year-on-year to S$162.3 million, and DPU declined 4.9% to S$0.0311 — driven primarily by weakness in its US data centre portfolio, where occupancy dropped to 82.5% from 86.1%.
The trust has announced a planned divestment of 22 North American data centres for S$500–600 million. This is a significant portfolio reshaping move: it signals that MIT’s management believes these older-vintage hyperscale facilities are no longer competitive, and the capital would be better redeployed.
We covered MIT’s data centre challenge in depth here →
What to watch in October:
- North American divestment progress: If MIT signs binding agreements for the 22 facilities, this removes a major overhang — the market has been discounting these assets heavily due to occupancy concerns.
- Singapore hi-tech portfolio performance: MIT’s Singapore hi-tech buildings (25% of revenue) have shown 8–12% rental uplifts — the strongest sub-segment in its portfolio. Expansion here would help offset US weakness.
- DPU guidance for FY2026/2027: Management commentary on full-year DPU is crucial. If they guide for 13.0–13.2 cents (annualised), that prices the trust at a 5.6–6.1% yield at current prices.
S-REIT Sector Scorecard: H1 2026 DPU Performance
CICT, CLAR, and MIT are not the only REITs investors should track this earnings season. Here’s a sector-wide view of H1 2026 DPU performance to contextualise the three October reporters:
| REIT | H1 2026 DPU | YoY Change | Sector |
|---|---|---|---|
| Keppel DC REIT | 5.714 cents | +11.3% | Data Centres |
| OUE REIT | 1.26 cents | +28.6% | Office/Hospitality |
| Suntec REIT | 3.936 cents | +24.8% | Office/Retail |
| CDL Hospitality Trust | 2.15 cents | +8.6% | Hospitality |
| CICT (C38U) | 6.02 cents | +7.1% | Retail/Commercial |
| Mapletree Logistics Trust | 1.816 cents | +0.2% | Logistics |
| CapitaLand Ascendas REIT | 7.482 cents | +0.1% | Industrial |
| Keppel REIT | 2.61 cents | -4.0% | Office |
| Mapletree Industrial Trust | 3.11 cents | -4.9% | Industrial/Data Centres |
Sources: SGX filings, Growbeansprout.com, Q3 2026 earnings releases. Past performance is not a guarantee of future distributions.
The takeaway: most S-REITs are growing DPU. The sector’s price underperformance is a rate story, not a fundamentals story. That’s important context heading into Q3/Q4 reporting.
The Valuation Case: Is 5.8% Yield Enough?
At a forward distribution yield of 5.8% and a price-to-book ratio of 1.0x (versus the historical average of 1.16x), Singapore REITs are objectively cheap relative to their own history. The question is whether that valuation makes sense in the current rate environment.
Consider the trade-off investors face today:
| Asset | Current Yield / Rate | Duration Risk | Capital Upside? |
|---|---|---|---|
| S-REIT (Lion-Philip S-REIT ETF) | 5.8% (forward) | Medium–High | Yes (if rates fall) |
| 6-Month T-bill (Sep 24 auction) | 1.92% | None | No |
| Singapore Savings Bond (Oct 2026) | 2.32% (10-yr avg) | Very Low | Minimal |
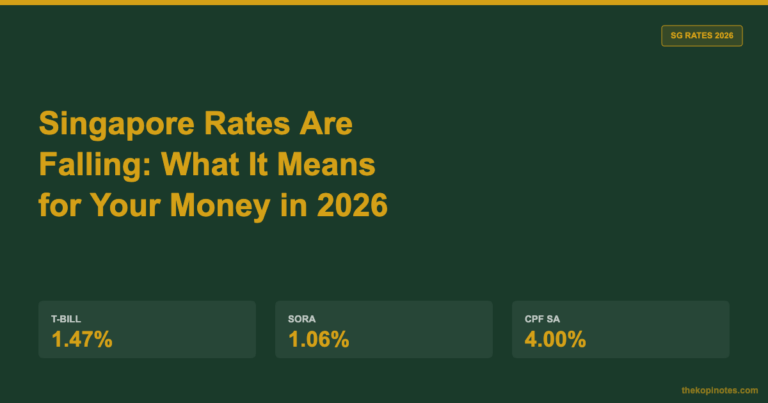
| CPF SA/MA/RA | 4.00% (floor) | None | No |
| STI ETF (ES3) | ~3.2% dividend yield | High | Yes (proven YTD) |
The case for S-REITs hinges on what happens next with interest rates. If the MAS tightens again in October (the base-case consensus), the sector faces another 3–6 months of rate headwinds. But if the MAS signals a pause — or if the Fed pivots sooner than expected — S-REITs at 1.0x book with 5.8% yields are attractively priced for long-term income investors.
There is also a mean-reversion argument. If the Price/Book ratio reverts to the 5-year average of 1.16x while DPU holds flat, that alone implies roughly 16% capital appreciation — on top of the 5.8% distribution yield.
What MAS’s October Decision Means for S-REIT Prices
The MAS meeting is expected to conclude in late October — around the same time as CICT and CLAR’s earnings releases. This creates a compressed decision window for investors.
Three scenarios to consider:
Scenario A: MAS tightens by 25bps (base case) — Short-term pressure on REIT prices; borrowing costs creep higher; forward yield may widen to 6.0–6.2%. Investors who buy the dip may look back on this as an entry point.
Scenario B: MAS holds (surprise) — Immediate relief rally; S-REITs could rebound 4–7% in the following sessions. The rate-sensitivity trade has been so heavily positioned that even a pause (not a cut) would be a catalyst.
Scenario C: MAS tightens AND signals more ahead — Worst case for REITs; further derating is possible. P/B could drop toward 0.92–0.95x. Watch for management commentary on refinancing costs in upcoming results calls.
Internal Links to Key TKN Resources
- MAS October 2026 Meeting Preview: Third Tightening?
- Singapore Q3 2026 Market Wrap: STI +22.9% While S-REITs Slump
- S-REIT Outlook 2026: Yield Comparison & Best Picks
- CICT 2026 Analysis: Rate Cuts & DPU Recovery Guide
- MIT 2026: US Data Centres & Singapore Hi-Tech Cluster
- Average S-REIT Dividend Yield 2026: Sector Data & Rate Impact
Bottom Line for SG Investors
October 2026 is shaping up to be a defining month for Singapore’s REIT sector. Three major blue-chips report results, the MAS makes a critical monetary policy call, and the sector sits at its cheapest valuation (relative to book value) in four years.
Here’s what the data tells us:
The fundamentals are not broken. CICT’s 7.1% DPU growth, Keppel DC REIT’s 11.3% DPU growth, and even CLAR’s flat-but-stable distributions reflect portfolios that are largely full, rental reversions are positive, and sponsor pipelines remain active. The problem is external — rates — not internal.
At 5.8% forward yield and 1.0x book value, S-REITs offer a meaningful yield premium over T-bills (1.92%) and SSBs (2.32%). For CPF-eligible investors, the ability to invest CPF OA (at 2.5%) into quality S-REITs still generating 5–6% distribution yields represents a real income-boosting strategy, albeit with market risk attached.
Our watch list for October earnings: CICT’s Paragon contribution and Asia Square Tower 2 progress; CLAR’s occupancy trajectory and capital recycling plan; and MIT’s North American divestment deal timeline. Any positive surprise on these three fronts could catalyse a sector re-rating in Q4.
The 31-point gap between S-REITs and the STI doesn’t close overnight. But for patient income investors, October’s earnings season may be the first sign that the worst is behind this sector.
Frequently Asked Questions
When do CICT, CLAR, and MIT report their October 2026 results?
Why have S-REITs underperformed the STI so badly in 2026?
What is the current S-REIT forward distribution yield?
Is it worth buying S-REITs with T-bills at 1.92%?
How does the MAS October 2026 meeting affect REIT prices?
Can I use CPF OA to invest in S-REITs?
What are the key risks for S-REITs in Q4 2026?
This article was researched with the help of AI. While we strive to keep all information accurate and up to date, there may be errors. If you notice any discrepancies, please contact us.