Disclaimer: This article is for informational and educational purposes only. It does not constitute financial advice. Always do your own research or consult a licensed financial adviser before making investment decisions.
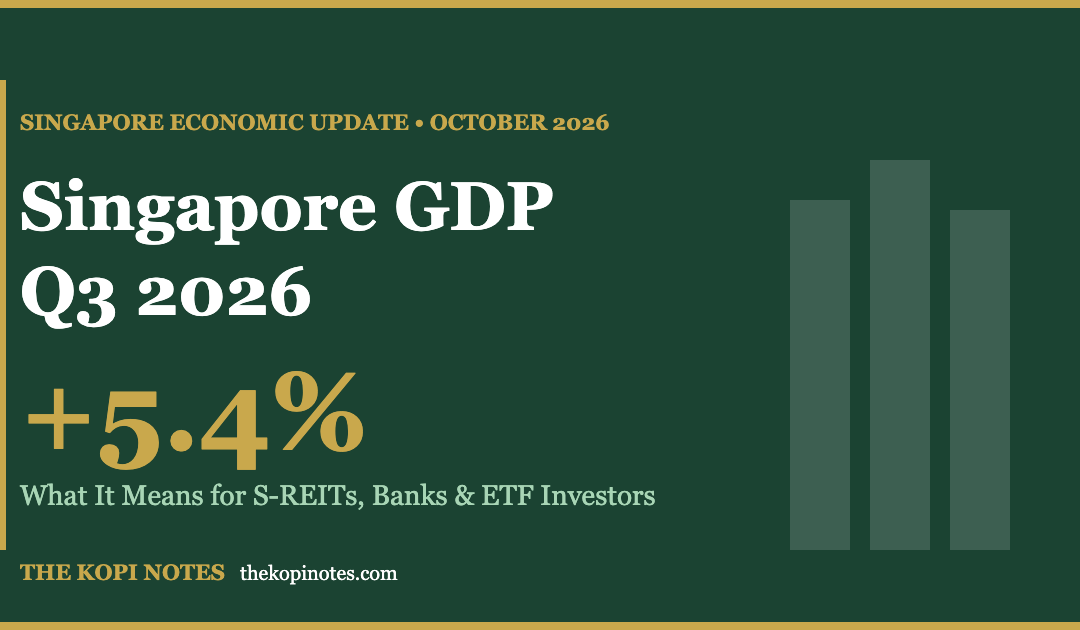
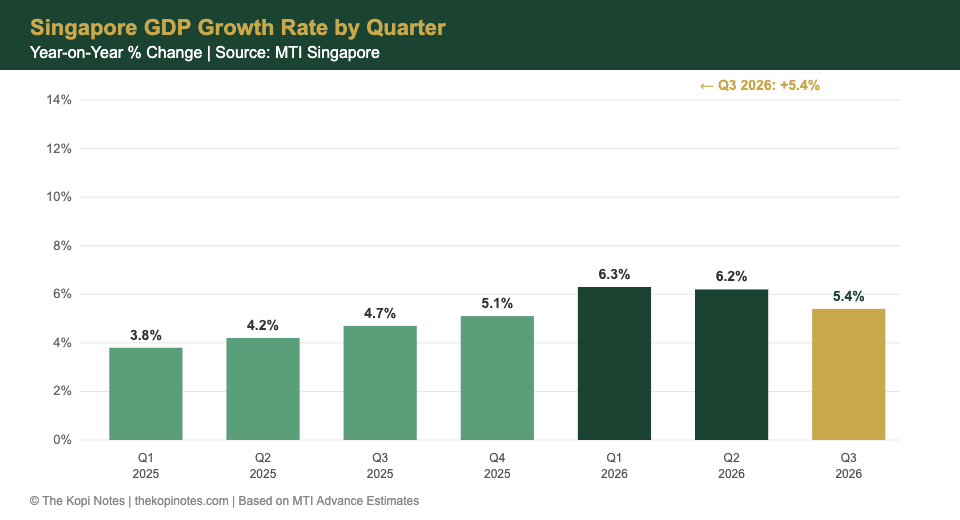
Singapore’s economy expanded 5.4% year-on-year in the third quarter of 2026, according to MTI’s advance estimates released on October 14 — a slight slowdown from Q2’s 6.2% but still comfortably above most forecasts. For Singapore retail investors holding S-REITs, bank stocks, or STI ETFs, this number is more than a headline — it has direct implications for earnings, dividends, and where to park your cash heading into year-end.
What Singapore’s Q3 2026 GDP Numbers Actually Mean
MTI released Singapore’s Q3 2026 GDP advance estimate on October 14, 2026, showing the economy grew 5.4% year-on-year. That is slower than Q2’s 6.2%, but the deceleration is less dramatic than it looks: the quarter-on-quarter, seasonally adjusted growth came in at 1.1%, slightly below Q2’s 1.5% but still healthy momentum.
What matters for investors is context. Singapore’s economy is small and open, meaning global demand shocks pass through quickly. The fact that GDP remains well above 5% despite global headwinds — an ongoing Middle East conflict, elevated oil prices near US$106/barrel, and uncertainty about US trade policy — speaks to the resilience of Singapore’s key export and finance engines.
MTI has upgraded its full-year 2026 GDP growth forecast to 4.5–5.5%, up from an earlier range of 2–4%. If the economy delivers at or above the midpoint of that band, 2026 will rank among Singapore’s strongest peacetime growth years in recent memory.
For investors who have been wondering why MAS surprised markets by holding monetary policy in October, the GDP data provides a partial answer: the economy does not need stimulus, even as policymakers remain watchful of inflation from energy prices and wages.
The Three Engines Driving Singapore’s Growth
Singapore’s GDP is divided into three broad clusters. Here is what each sector delivered in Q3 2026 and what it signals for investors:
1. Manufacturing: +7.5% (Slower but Still Solid)
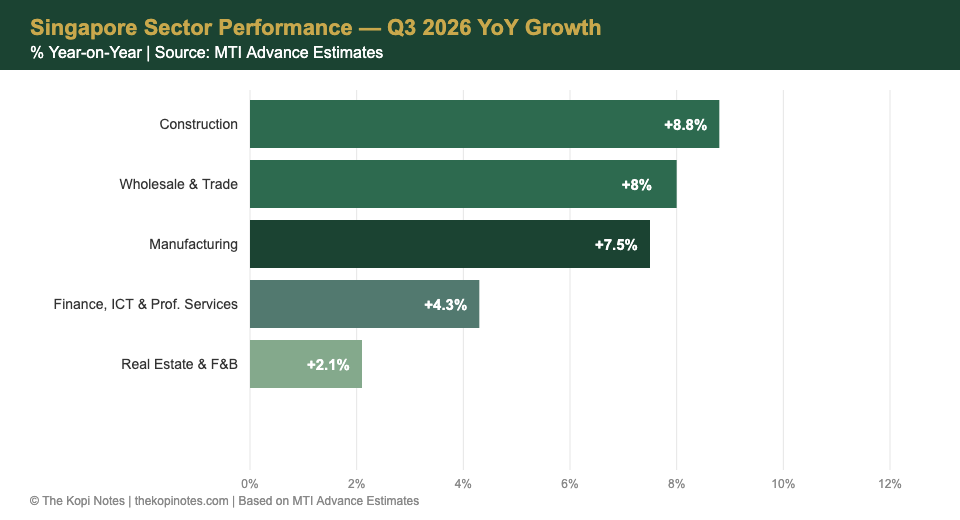
Manufacturing grew 7.5% year-on-year, down from a blistering 12.9% in Q2. The deceleration is partly a base effect — Q2 2025 was a weak comparison period for manufacturing, making Q2 2026 look exceptional by contrast. Q3 2025 was already recovering, so the year-on-year bar is higher now.
Importantly, the growth was broad. Electronics, precision engineering, and transport engineering all expanded. The only weak spots were chemicals and biomedical manufacturing, which tend to be lumpy due to batch production cycles.
For investors, manufacturing strength underpins Singapore’s industrial and logistics REITs. Strong export demand means warehouse utilisation, lease renewals, and rents are supported. CapitaLand Ascendas REIT (CLAR), which has significant Singapore industrial exposure, and Mapletree Logistics Trust (MLT), which benefits from regional trade flows, are both worth watching as their Q3 results approach.
2. Construction: +8.8% (Fastest Sector, Accelerating)
Construction was the standout performer, accelerating from 6.1% in Q2 to 8.8% in Q3. Both public-sector infrastructure and private development projects are contributing. The public pipeline includes MRT extensions, hospital expansions, and housing development. The private pipeline reflects pent-up demand for commercial and mixed-use projects.
This matters for real estate-adjacent investors. Strong construction activity typically precedes rising Grade A office supply, but it also signals confidence in Singapore’s long-term economic trajectory. For S-REITs focused on Singapore assets, a growing construction pipeline tells you that asset quality and valuations will be tested when new supply comes online — but also that the economy justifies that new supply.
3. Services: Mixed, With Finance and Trade Leading
The services sector is Singapore’s largest by GDP, and the picture here is more nuanced:
- Wholesale and retail trade, transportation and storage: +8.0% (accelerating from Q2’s 6.9%). Regional trade flows and Singapore’s role as a logistics hub are strengthening.
- Information and communications, finance and insurance, professional services: +4.3% (slowing from 5.1%). Finance remains positive, but the rate of expansion is moderating — consistent with the global rate environment.
- Accommodation, food, real estate, administrative and support: +2.1% (the weakest cluster). Real estate services are growing slowly, which partly reflects the impact of higher interest costs on property transactions. F&B contraction is a separate story: more Singaporeans are eating overseas as travel normalises.
GDP Sector Breakdown: Q3 2026 vs Q2 2026
| Sector | Q2 2026 YoY | Q3 2026 YoY | Trend |
|---|---|---|---|
| Overall GDP | +6.2% | +5.4% | ↓ Moderating |
| Manufacturing | +12.9% | +7.5% | ↓ Base effect |
| Construction | +6.1% | +8.8% | ↑ Accelerating |
| Wholesale Trade & Transport | +6.9% | +8.0% | ↑ Accelerating |
| Finance, ICT & Professional Services | +5.1% | +4.3% | ↓ Moderating |
| Real Estate, F&B & Other Services | +2.4% | +2.1% | ↓ Weak |
Source: MTI Advance Estimate, 14 October 2026. YoY = Year-on-Year.
Why MAS Held Policy Despite 5.4% Growth
If the economy is growing at 5.4%, why did MAS surprise markets by holding its SGD nominal effective exchange rate (S$NEER) policy band unchanged in October?
Two reasons. First, MAS manages the exchange rate, not interest rates, and a stronger SGD is already doing some of the anti-inflation work passively. Second, MAS is watching global risk carefully: oil at US$106/barrel, Middle East uncertainty, and the possibility of US trade policy shifts in late 2026 all argue for keeping powder dry.
The practical implication for investors: Singapore dollar interest rates are likely to remain relatively elevated for longer, since the SGD rate environment is partly a function of global USD rates and MAS’s exchange rate stance. This means T-bill yields, fixed deposit rates, and CPF interest rates are unlikely to drop sharply in the near term. The 1-year T-bill yielding 1.92% in October 2026 is the last 1-year T-bill auction of the year — but the 6-month T-bill auction on October 22 still offers competitive returns for cash savers.
What Singapore Bank Investors Should Know
DBS, OCBC, and UOB together account for roughly 40% of the STI’s market capitalisation. A growing economy is unambiguously good for Singapore banks — more GDP means more loans, better credit quality, and more fee-based income from wealth management and corporate banking.
The finance and insurance cluster grew 4.3% in Q3 2026 (within the broader services category). This is slower than the economy overall, but remember: Singapore banks are not just a domestic story. DBS has significant Hong Kong and Greater China exposure. OCBC’s wealth management franchise covers Southeast Asia. UOB has ASEAN retail banking built up through acquisitions.
With Q3 2026 earnings season approaching — DBS is expected to report in early November — the question for investors is whether the strong GDP environment will translate into better-than-expected loan growth and stable net interest margins. Bank stocks pulled back sharply in early October, creating a potential opportunity for long-term investors if Q3 results confirm the earnings resilience the GDP data suggests.
There is also a rate angle. Even with MAS on hold, the SGD-USD interest rate differential means Singapore dollar lending rates have stayed higher than many expected heading into Q4. That supports net interest income for the banks.
What S-REIT Investors Should Know
GDP growth’s impact on S-REITs is sector-specific:
Industrial and Logistics REITs: Broadly Positive. Manufacturing at +7.5% and trade/logistics at +8.0% support occupancy and rental growth for industrial landlords. Tenants in electronics, precision engineering, and trade services are expanding, creating demand for warehouse and factory space. This bodes well for REITs in those sectors as they head into earnings season. The upcoming S-REIT results from CICT, CLAR, and MIT will reveal how much of this macro tailwind has translated into actual financials.
Office REITs: Supportive but Not Exciting. Finance and professional services grew 4.3% — decent, but not the level that drives aggressive office expansion. Singapore Grade A office rents have been rising steadily through 2026 on AI-driven demand from tech firms, but the pace is likely to moderate as new supply edges closer. CICT’s Q3 update (October 29) and its freshly acquired Paragon asset will be closely watched.
Retail REITs: Caution Warranted. The real estate, accommodation, and food services cluster delivered only 2.1% growth — the weakest sector in the economy. F&B contracting partly reflects more Singaporeans dining abroad, which is bad news for retail mall operators reliant on F&B tenants. Frasers Centrepoint Trust and Lendlease REIT investors should note that the domestic consumption backdrop is softer than the headline GDP number suggests.
Healthcare REITs (PLife REIT): Largely Macro-Insulated. ParkwayLife REIT’s revenues are driven by master lease structures linked to hospital revenue, not general economic cycles. The Singapore hospital sector’s growth is more demographically driven. PLife’s recent strong DPU growth of 14–15% is largely a function of its lease renewal in 2026, not the economic cycle.
What ETF and CPF Savers Should Do Now
If you hold the SPDR STI ETF (ES3) or Nikko AM STI ETF (G3B), you are directly exposed to Singapore’s economic cycle through the STI’s heavy weighting in banks and REITs. A 5.4% GDP print is supportive — but as we noted, the STI had already pulled back 10%+ in early October from its year-to-date highs, partly in anticipation of earnings risks and partly from global oil-driven inflation concerns.
The question for ETF investors is whether this GDP data and the upcoming earnings season will act as a catalyst for recovery. Historically, Singapore banks tend to perform well when nominal GDP growth is strong and credit costs are low — both of which the current environment suggests.
For CPF members: strong GDP growth generally supports the MAS’s ability to maintain the CPF interest rate floors at their current levels (OA at 2.5%, SA and MA at 4.0%, extended to December 2027). It also means Singapore’s public finances remain healthy — a good sign for the long-term sustainability of CPF itself.
For cash savers choosing between T-bills, fixed deposits, and Singapore Savings Bonds, the 5.4% GDP print does not change the near-term rate picture materially — but it does reduce the probability of MAS cutting its exchange rate band anytime soon, which keeps domestic funding costs from falling sharply. Lock in rates before they move, but do not panic about missing a sharp drop — the macro environment does not support one.
For a comprehensive look at how to allocate your cash and investments in this environment, see our Best Investments in Singapore 2026 guide, which covers the full spectrum from T-bills to equities to REITs.
Bottom Line for SG Investors
Singapore’s Q3 2026 GDP advance estimate of 5.4% is a Goldilocks number: not so hot that MAS is forced to tighten aggressively, not so cold that earnings expectations need to be slashed. The economy is moderating from H1’s exceptional pace, but the fundamentals remain sound — construction is accelerating, trade is strong, and finance is positive if slower.
Here is what to take away:
- Bank stocks: Watch Q3 earnings carefully. DBS reports in early November. Strong GDP supports loan growth and credit quality — the October sell-off may be overdone if results deliver.
- Industrial and logistics REITs: Manufacturing and trade growth is a tailwind. Upcoming CLAR, MIT, and CICT results will reveal how much is filtering through to DPU.
- Retail REITs: The weakest GDP cluster is exactly where retail mall operators live. Be selective.
- Cash savers: Rates are not going to collapse soon. The October 22 T-bill auction and the SSB application window (apply by October 27) remain viable options for your short-to-medium-term cash.
- CPF: The 4.0% SA floor and 2.5% OA rate remain intact through 2027. Voluntary top-ups still make sense for eligible members.
The macro backdrop for Singapore investors is not uniformly bullish — oil prices, global uncertainty, and a slowing earnings growth rate all warrant caution. But the Q3 2026 GDP data confirms that Singapore’s economy is doing what it does best: delivering steady, resilient growth even as the world around it gets messy.
Frequently Asked Questions
What is Singapore’s Q3 2026 GDP growth rate?
Singapore’s economy grew 5.4% year-on-year in Q3 2026, according to the MTI advance estimate released on October 14, 2026. On a quarter-on-quarter, seasonally adjusted basis, growth was 1.1%, slightly slower than Q2’s 1.5%.
Is Singapore’s 5.4% GDP growth in Q3 2026 good or bad?
It is solid. The 5.4% reading is a moderation from Q2’s 6.2%, but still comfortably above MTI’s revised full-year growth forecast range of 4.5–5.5%. Singapore’s economy is outperforming most of its regional peers and is growing faster than the government itself projected at the start of 2026.
Which sectors are growing fastest in Singapore in Q3 2026?
Construction led all sectors with 8.8% growth, followed by wholesale trade and transportation at 8.0%. Manufacturing grew 7.5%, driven by electronics and precision engineering. The weakest cluster was real estate, accommodation, food, and administrative services at 2.1%.
How does Singapore’s Q3 GDP affect DBS, OCBC, and UOB?
Strong GDP growth supports bank lending volumes, credit quality, and fee-based income. Singapore banks tend to benefit when the economy is growing above 4–5%, as businesses borrow more and asset quality remains healthy. Q3 2026 results are expected from DBS in early November. The October bank stock sell-off may be an opportunity if earnings confirm the macro tailwind.
What does Singapore’s GDP growth mean for S-REITs?
The impact varies by REIT type. Industrial and logistics REITs benefit from strong manufacturing and trade data. Office REITs benefit moderately from finance and professional services growth. Retail REITs face headwinds from the weak real estate and F&B cluster (only +2.1%). Healthcare REITs like PLife REIT are largely independent of the economic cycle.
Why did MAS hold monetary policy in October 2026 despite strong GDP growth?
MAS manages Singapore’s exchange rate, not interest rates. The SGD NEER policy band was held unchanged in October because MAS is weighing global risks — elevated oil prices near US$106/barrel, Middle East conflict uncertainty, and potential US trade policy changes — against Singapore’s domestic strength. A hold means neither tightening nor loosening, which is appropriate when the economy is growing well but external risks are high.
What should Singapore investors do after the Q3 2026 GDP release?
For equity investors, monitor upcoming bank and S-REIT earnings closely — GDP strength should translate into earnings support. For cash savers, the GDP data does not signal imminent rate cuts, so the October 22 T-bill auction and Singapore Savings Bond application (close October 27) remain relevant. For CPF members, the strong macro backdrop supports the continuation of the CPF interest rate floors through December 2027.
Is now a good time to invest in Singapore stocks given Q3 GDP data?
The GDP data is supportive, but timing the market based on a single economic release is not a reliable strategy. Singapore’s STI pulled back sharply in early October, and some of that correction may be overdone given the solid economic fundamentals. Dollar-cost averaging into diversified Singapore ETFs or high-quality REITs and bank stocks remains a sensible approach for long-term retail investors.
This article was researched with the help of AI. While we strive to keep all information accurate and up to date, there may be errors. If you notice any discrepancies, please contact us.