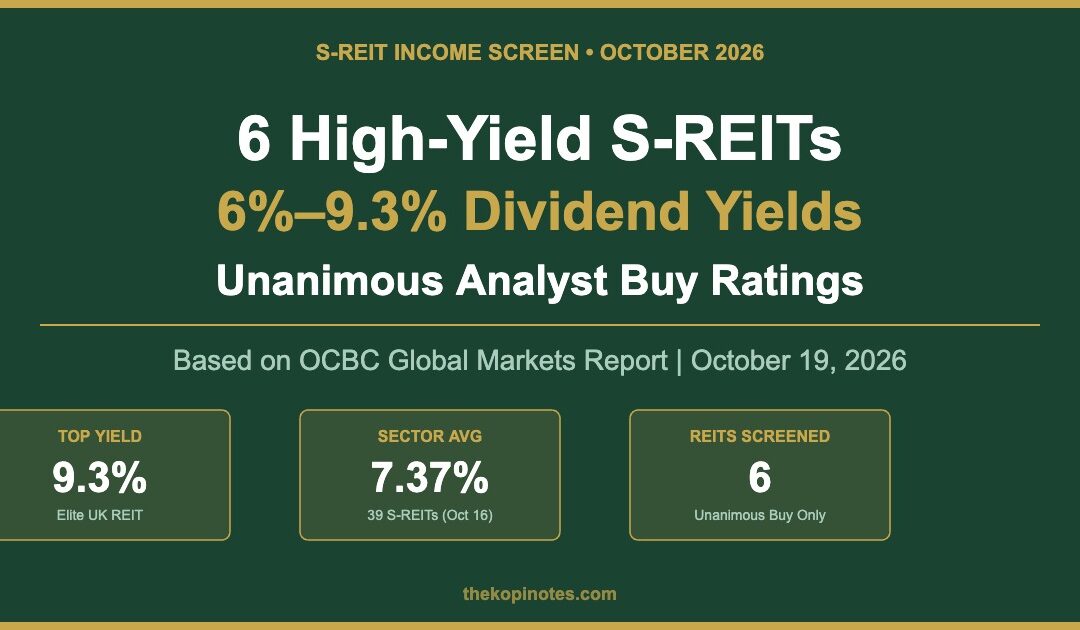
Six Singapore-listed REITs screened by OCBC Global Markets carry zero Hold or Sell analyst ratings and forward yields of 5.8% to 9.3% — the highest yield-conviction cluster in the S-REIT universe right now. Published October 19, 2026, the screen captures a rare window: a sector that has underperformed the Straits Times Index year-to-date yet retains income returns that far exceed fixed deposits, T-bills, and government bonds.
This is an editorial analysis. Not financial advice. Data verified as at 20 October 2026.
Why High-Yield S-REITs Are Back in the Spotlight
The S-REIT sector has had a difficult 2026. The US Federal Reserve raised interest rates in September 2026 for the first time in three years, and MAS held its monetary policy stance in October by keeping the SGD NEER slope unchanged. Higher rates raise REIT borrowing costs and compress unit prices — which is exactly what has played out this year.
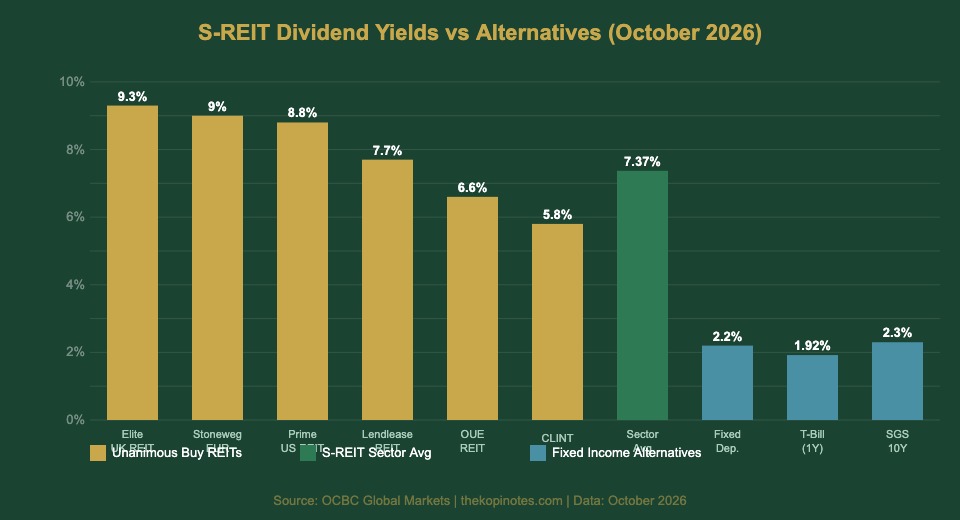
The result: unit prices of many S-REITs have fallen, and their dividend yields have risen sharply. The average forward yield across 39 SGX-listed S-REITs stood at 7.37% as at October 16, 2026, against a sector median of 6.92%. That compares to the Singapore 10-year government bond yield of around 2.3%, fixed deposit rates of 2.1–2.2%, and the latest 1-year T-bill yield of 1.92%.
In short: S-REITs are offering their widest yield premium over safe-haven alternatives in years. The question for Singapore dividend investors is which specific REITs offer that yield with the highest analyst conviction.
The OCBC Screen: 6 S-REITs With Unanimous Buy Calls
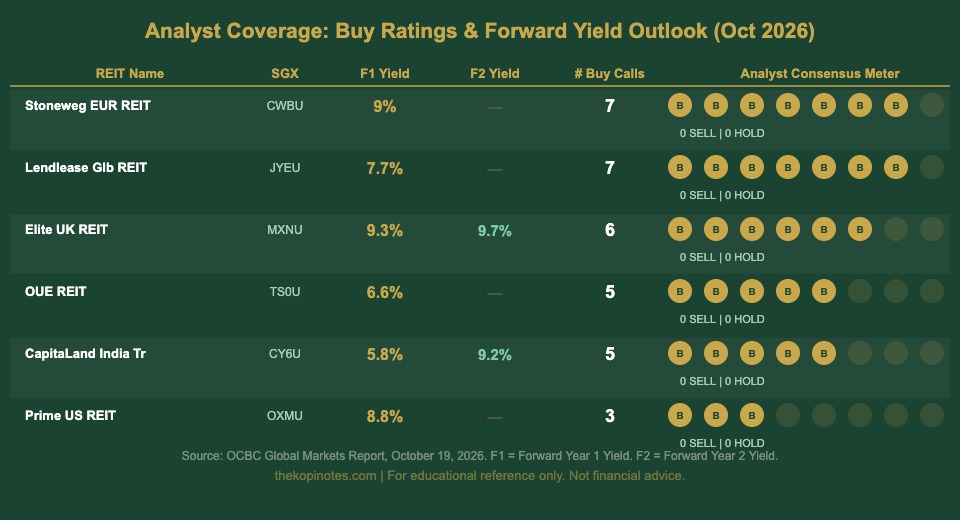
On October 19, 2026, OCBC Global Markets published a quantitative yield screen covering all SGX-listed REITs. The screen filtered for two conditions: a forward yield above 5.5%, and zero Hold or Sell ratings among all covering brokers. Six REITs survived the screen — meaning every broker that covers them has a Buy call. Here they are:
| REIT | SGX Code | F1 Yield | F2 Yield | Buy Calls | Sub-Sector |
|---|---|---|---|---|---|
| Stoneweg European Stapled Trust | CWBU | 9.0% | — | 7 | European Commercial |
| Lendlease Global Commercial REIT | JYEU | 7.7% | — | 7 | Retail/Office |
| Elite UK REIT | MXNU | 9.3% | 9.7% | 6 | UK Government Office |
| OUE REIT | TS0U | 6.6% | — | 5 | Office/Hospitality |
| CapitaLand India Trust | CY6U | 5.8% | 9.2% | 5 | India Business Parks |
| Prime US REIT | OXMU | 8.8% | — | 3 | US Office |
Source: OCBC Global Markets, 19 October 2026. F1 = forward first-year yield. F2 = forward second-year yield. Zero Hold/Sell ratings for all.
Breaking Down the 6 REITs: What Singapore Investors Must Know
1. Elite UK REIT (MXNU) — 9.3% Yield, 6 Buy Calls
Elite UK REIT holds government-leased office buildings across the United Kingdom with long WALEs and stable UK government credit tenants. The 9.3% forward yield rises to 9.7% in year two. Six Buy calls and zero Holds or Sells. Key risk: Sterling volatility and potential UK public sector spending reviews affecting renewal demand.
2. Stoneweg European Stapled Trust (CWBU) — 9.0% Yield, 7 Buy Calls
Formerly known as Cromwell European REIT, Stoneweg tops this screen on analyst buy count (7). It holds office and light-industrial assets across multiple EU markets. European commercial real estate fundamentals stabilised in mid-2026 after the 2024–2025 correction. Seven Buy calls signals broad broker consensus that units are undervalued at current levels.
3. Prime US REIT (OXMU) — 8.8% Yield, 3 Buy Calls
Prime US REIT offers the second-highest F1 yield but comes with concentrated risk: it trades at approximately a 78.5% discount to its net asset value (NAV) as at October 2026. US office vacancies remain elevated post-pandemic and refinancing costs are high. With only 3 covering brokers all at Buy, conviction is unanimous but coverage is thin — a meaningful distinction. This is the highest-risk name in the screen.
4. Lendlease Global Commercial REIT (JYEU) — 7.7% Yield, 7 Buy Calls
Lendlease REIT reported a 3.1% year-on-year DPU increase to 1.85 cents in 1H FY2026, driven by its Singapore retail assets including 313 Somerset. Singapore commercial rents have benefited from AI-driven office demand in 2026, which supports its local portfolio. Seven Buy calls makes this one of the most broadly backed names in the screen.
5. OUE REIT (TS0U) — 6.6% Yield, 5 Buy Calls
OUE REIT had one of the strongest DPU recoveries in the S-REIT sector in 2026, with a 28.6% year-on-year increase in 1H 2026 DPU to 1.26 cents, driven by office rental growth at OUE Bayfront and One Raffles Place, and improved hospitality performance at Mandarin Orchard. At 6.6% yield and 5 Buy calls, it is the most conservative yield in this screen with quality Singapore-anchored assets.
6. CapitaLand India Trust (CY6U) — 5.8% F1, 9.2% F2 Yield
CLINT is the most forward-looking name in the screen. The F1 yield of 5.8% sits just below the 6% headline threshold, but OCBC’s F2 estimate jumps to 9.2% — reflecting the delivery of CLINT’s active development pipeline of business parks and data centres in India’s top IT cities. Five Buy calls. The risk: development execution in a complex emerging market where timelines can slip.
What “Unanimous Buy” Really Means — and Its Limits
The unanimous Buy consensus is a meaningful signal, but it needs calibration. Prime US REIT’s 3 Buy calls come from only 3 covering analysts — 100% coverage is Buy by definition, since coverage is limited. Lendlease and Stoneweg, with 7 covering brokers each, provide more statistically robust consensus.
What unanimous Buy ratings screen out is active analyst pessimism. Zero-Sell, zero-Hold does not guarantee positive returns — it guarantees that no covering analyst currently sees downside sufficient to rate the unit at Hold or Sell. In a volatile rate environment, that bar matters.
For dividend-focused Singapore investors, this screen is a strong starting filter. You still need to check gearing (MAS cap: 50%), interest coverage ratio (target above 2.5x), WALE, and currency hedging before committing. Compare these REITs against all income options available in Singapore for 2026.
S-REIT Sector Yields vs Safe-Haven Alternatives
At the sector level, the average S-REIT forward yield of 7.37% in October 2026 sits far above what Singapore fixed income currently offers:
| Income Option | Current Rate (Oct 2026) | Key Features |
|---|---|---|
| Average S-REIT (39 counters) | 7.37% p.a. | Variable, quarterly/semi-annual payouts |
| Singapore 10-Year SGS Bond | ~2.3% p.a. | Fixed coupon, government-backed |
| Best Fixed Deposit (RHB/CIMB) | 2.1–2.2% p.a. | Fixed term, SDIC insured up to $75k |
| 1-Year T-Bill (Oct 2026) | 1.92% p.a. | Competitive bid, 6-month lock |
| Singapore Savings Bond (10Y avg) | ~2.45% p.a. | Flexible, government-backed, $200k cap |
Data verified as at 20 October 2026. See SingPromos for latest FD rates. See Minichart.com.sg for the OCBC screen data.
Key Risks Singapore Investors Must Monitor
Currency exposure: Elite UK REIT (GBP), Stoneweg (EUR), and Prime US REIT (USD) generate income in foreign currencies. A stronger SGD erodes distributions when converted back. Currency hedging costs also reduce distributable income.
US and European office vacancies: Prime US REIT and Stoneweg operate in markets where office vacancies remain elevated. Structural demand shifts post-pandemic have not fully reversed in US suburban office markets.
Refinancing risk: REITs with significant debt maturing in 2026–2027 face refinancing at materially higher rates. Review each REIT’s debt maturity profile in its latest quarterly business update. Interest coverage ratios below 2x are a warning sign.
Development execution (CLINT): CapitaLand India Trust’s projected F2 yield leap depends on pipeline delivery. India construction timelines can slip. Any delays push yield realisation out further.
Bottom Line for SG Investors
The OCBC yield-and-consensus screen from October 19, 2026 identifies six S-REITs where the market is pricing in significant risk that analysts — at least the covering brokers — do not currently believe is warranted. Yields from 5.8% to 9.3% sit far above Singapore’s fixed deposits (2.2%), T-bills (1.92%), and government bonds (2.3%).
OUE REIT and Lendlease REIT stand out as the two names with anchored Singapore assets and strong 2026 DPU performance — potentially the smoother entry points for conservative dividend investors. Elite UK REIT and Stoneweg offer the broadest analyst Buy coverage alongside high yields, but require comfort with foreign currency exposure. Prime US REIT is high-yield, high-risk. CLINT is a longer-duration play banking on India’s IT infrastructure boom.
Track these names through S-REIT Q3 earnings in late October. A positive DPU surprise from CICT, CLAR, or MIT could lift sentiment across the sector, potentially re-rating these undervalued names. The 5.4% Singapore Q3 GDP growth and stable MAS policy provide a constructive macro backdrop for S-REIT income to hold.
Frequently Asked Questions
What does “unanimous Buy” mean for an S-REIT?
It means every broker analyst who publishes formal coverage on that REIT has issued a Buy rating — zero Holds or Sells. It signals that professional analyst pessimism is absent. Note that unanimous Buy on a thinly covered REIT (e.g., 3 brokers) carries less statistical weight than on one covered by 7+ brokers.
How is the forward dividend yield calculated for S-REITs?
Forward yield = projected annual DPU divided by current unit price. OCBC’s F1 uses analyst consensus estimates for the next full reporting year; F2 uses the year after. These are estimates, not guaranteed payouts. Actual DPU can vary based on occupancy, borrowing costs, and asset disposals.
Is a 9% S-REIT yield too good to be true?
Not necessarily, but it demands scrutiny. For Elite UK REIT and Prime US REIT, high yields reflect structural concerns about UK government leasing demand and US office vacancies respectively. Always check gearing, interest coverage, WALE, and DPU sustainability before investing. See our full guide on dividend investing in Singapore.
What is the current average S-REIT yield in October 2026?
As at October 16, 2026, the average forward yield across 39 SGX-listed REITs is 7.37%, with a median of 6.92%. The yield spread over Singapore’s 10-year government bond (~2.3%) is approximately 5.1 percentage points — historically wide, reflecting elevated rate-risk pricing in the sector.
How do S-REIT yields compare to fixed deposits and T-bills in Singapore?
As of October 2026, best fixed deposits pay 2.1–2.2% p.a. (RHB, CIMB), the latest 1-year T-bill yield is 1.92%, and Singapore Savings Bonds average ~2.45% over 10 years. The average S-REIT yield of 7.37% is over 3x the income of fixed deposits — but with greater price volatility and variable DPU. See our Singapore fixed deposit rate guide for October 2026.
What risks should Singapore investors watch before buying these S-REITs?
Key risks: (1) Currency risk for overseas-focused REITs (GBP, EUR, USD); (2) US and European office vacancy elevated post-pandemic; (3) Debt refinancing risk for REITs with near-term maturities in a higher-rate environment; (4) Development execution risk for CapitaLand India Trust. Always review the latest quarterly business update and check gearing ratios before investing.
This article was researched with the help of AI. While we strive to keep all information accurate and up to date, there may be errors. If you notice any discrepancies, please contact us.