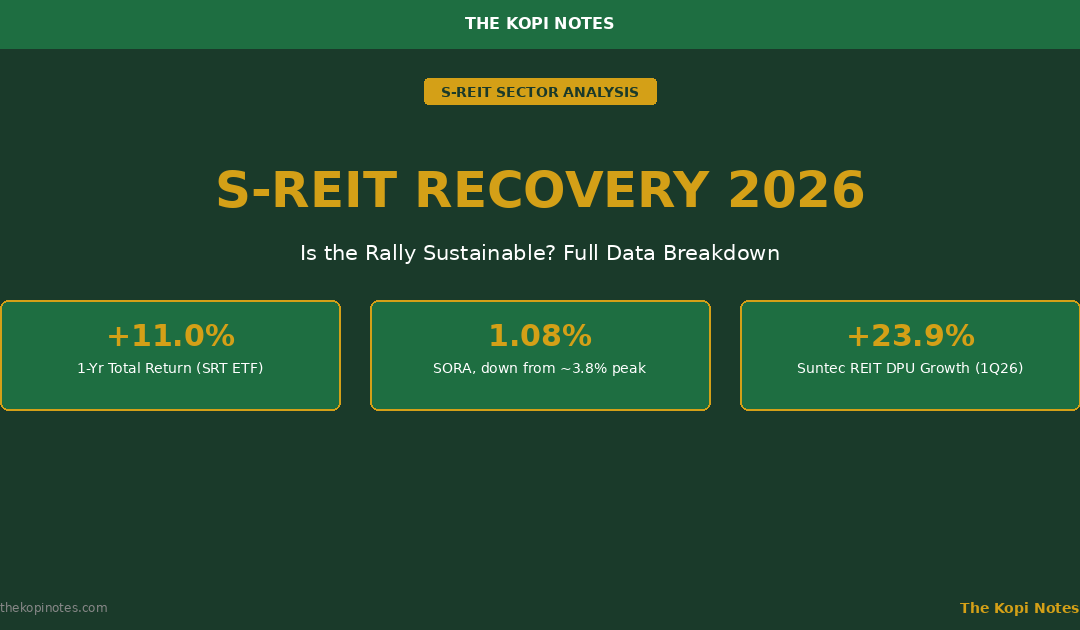
S-REIT Recovery 2026: Is the Rally Sustainable? Full Data Breakdown
SORA has fallen to decade lows even as the Fed holds firm. Here’s what’s really driving the S-REIT recovery — and the risks that could end it.
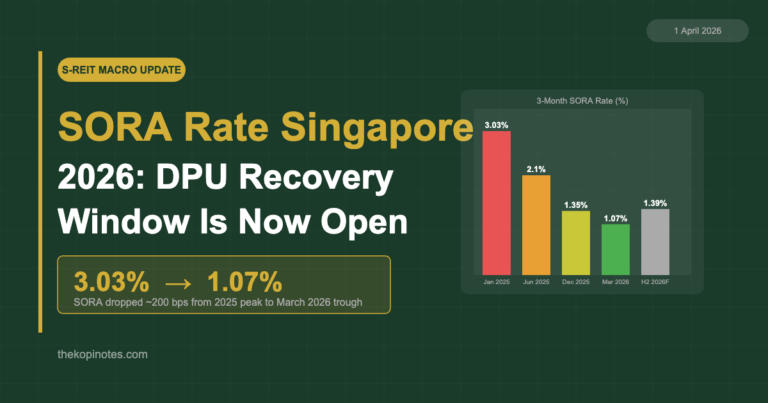
Singapore REITs have staged a genuine recovery in 2026 — the iEdge S-REIT Leaders Index delivered an 11% total return over the past year, even as the US Federal Reserve kept rates on hold. The real driver isn’t the Fed. It’s SORA, Singapore’s own borrowing rate, which has collapsed from a 2023-24 peak near 3.8% to just 1.08% by July 2026.
Not financial advice. All figures are approximate and for educational reference only. Data as at July 2026 unless otherwise noted. Always consult a licensed financial adviser before making investment decisions.
- S-REITs have rallied over the past 12 months, but the recovery is being driven by Singapore’s own SORA rate falling faster than the Fed cuts — not by the Fed itself.
- Logistics and data centre REITs are leading DPU growth (Suntec REIT +23.9%, Keppel DC REIT +9.8%), while the sector-wide median is a far more modest ~3% for FY2026.
- The recovery isn’t guaranteed to continue. MAS unexpectedly tightened policy in April 2026, and a reversal in SORA could stall the rally just as valuations have already moved up from 2026’s lows.
Table of Contents
Contents — Click to expand
- Is There Really an S-REIT Recovery in 2026?
- Why SORA Matters More Than the Fed
- DPU Growth Leaders: Which Sub-Sectors Are Rebounding?
- S-REIT Performance & Valuation Data
- The April 2026 Wildcard: MAS Tightens Policy
- Is the Recovery Sustainable Through 2026?
- How to Position for the Recovery
- Key Risks to the Recovery Narrative
- Frequently Asked Questions
Is There Really an S-REIT Recovery in 2026?
The best public proxy for the broad S-REIT market is the CSOP iEdge S-REIT Leaders Index ETF (SGX: SRT) — a fund that simply holds a basket of the largest, most liquid S-REITs so you get sector-wide exposure in one trade. Over the 12 months to mid-July 2026, it delivered an 11.0% total return, including dividends. That’s a real recovery, not a rounding error.
However, it hasn’t been a straight line. The same index was still down 6.8% for the 2026 calendar year as of mid-April, before clawing back into positive territory over the following months. In other words, most of the 12-month gain came from a strong second half of 2025, not from 2026 itself. If you bought in January expecting a smooth rally, you would have spent your first few months underwater.
This ties directly into an earlier deep dive we ran in July 2026 on S-REITs trading near five-year lows. At the time, most blue-chip names were sitting 15-40% below their net asset value (NAV), with distribution yields averaging 5.5-7.5%. That valuation gap is exactly why the recovery has room to run — but it also means today’s buyers are paying a higher price than those who bought at the bottom.
| Metric | Figure (as at July 2026) |
|---|---|
| Trailing 12-month total return (SRT ETF) | +11.0% |
| Calendar-year-2026 return (as at mid-April) | -6.8% |
| P/NAV discount range (blue-chip S-REITs) | 15-40% below NAV |
| Sector distribution yield range | 5.5% – 7.5% |
Source: CSOP/SGX SRT ETF performance data, The Kopi Notes July 2026 valuation research. Figures approximate.
Why SORA Matters More Than the Fed
Every headline about REITs talks about the Fed. But if you own S-REITs, the interest rate that actually moves your distributions is the Singapore Overnight Rate Average (SORA) — basically the rate SGD banks charge each other to borrow money overnight. It’s the benchmark almost every S-REIT’s Singapore-dollar loan is priced against.
The Monetary Authority of Singapore (MAS) doesn’t set interest rates directly the way the Fed does. Instead, it manages the Singapore dollar’s exchange rate against a basket of trading-partner currencies. But SORA still moves with that policy stance — it falls when MAS eases and rises when MAS tightens.
Here’s the part most commentary misses. After the 2022-2024 global rate-hiking cycle pushed SORA to a peak of roughly 3.8%, MAS eased policy twice in 2025. SORA has since fallen all the way to 1.08% as at July 2026 — one of its lowest readings in years. The Fed, meanwhile, has delivered only two rate cuts since late 2025 and has held its target range at 3.50%-3.75% through the first half of 2026, a stance widely described as “higher for longer.”
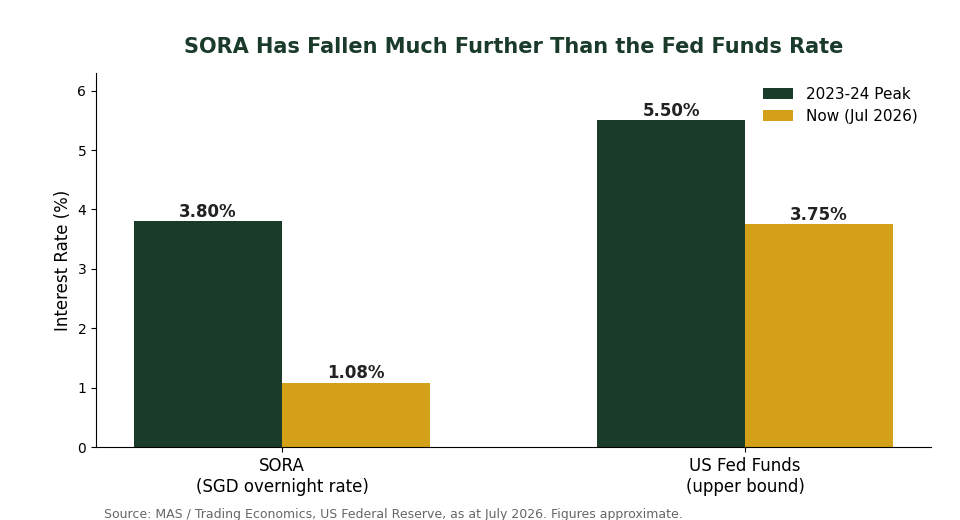
This matters because most S-REITs borrow mostly in Singapore dollars, not US dollars. A REIT refinancing a maturing SGD loan today is locking in a meaningfully lower rate than it would have two years ago — regardless of what the Fed does next. That’s the real engine behind the 2026 recovery, and it’s a distinctly Singapore-specific story, not simply a “global rates are falling” one.
This also explains why our own S-REIT sector yield spread outlook from earlier this year flagged a widening gap between S-REIT distribution yields and Singapore’s 10-year government bond yield (around 2.8-3.0%) — that spread was, and still is, one of the widest in over two years, even after the rally.
DPU Growth Leaders: Which Sub-Sectors Are Rebounding?
Lower financing costs show up first in Distribution Per Unit (DPU) — basically how much cash each REIT unit pays you per quarter or half-year. It’s the REIT equivalent of dividend per share, and it’s the number that ultimately decides whether the “recovery” narrative is real money in your pocket or just a chart going up.
Industrial, logistics, and data centre sub-sectors are leading the DPU rebound. Two results this year stand out. Suntec REIT’s 1Q FY2026 DPU surged 23.9% year-on-year, as its Singapore office and retail portfolio saw occupancy and rental reversions recover — see our full breakdown of Suntec REIT’s 1Q 2026 results. Keppel DC REIT posted a 9.8% year-on-year DPU increase in its most recent quarter, powered by AI-driven data centre demand — you can read our Keppel DC REIT 1H2026 results preview ahead of its next results on 24 July.
Sector-wide, the picture is more modest. Brokerage forecasts point to roughly 3% median DPU growth across all S-REITs in FY2026, up from a nearly flat pace the year before. The headline-grabbing numbers from Suntec and Keppel DC REIT are the exception, not the rule — most S-REITs are seeing a gentler recovery.
The timing here is worth flagging. Mapletree Logistics Trust reports its Q1 FY26/27 results on 28 July, and Mapletree Industrial Trust reports on 23 July — both just days away as this article goes live. See our Mapletree Logistics Trust Q1 FY26/27 preview for what to watch. If those results confirm the same DPU-growth pattern as Suntec and Keppel DC REIT, it strengthens the case that the recovery is broadening beyond a couple of standout names.
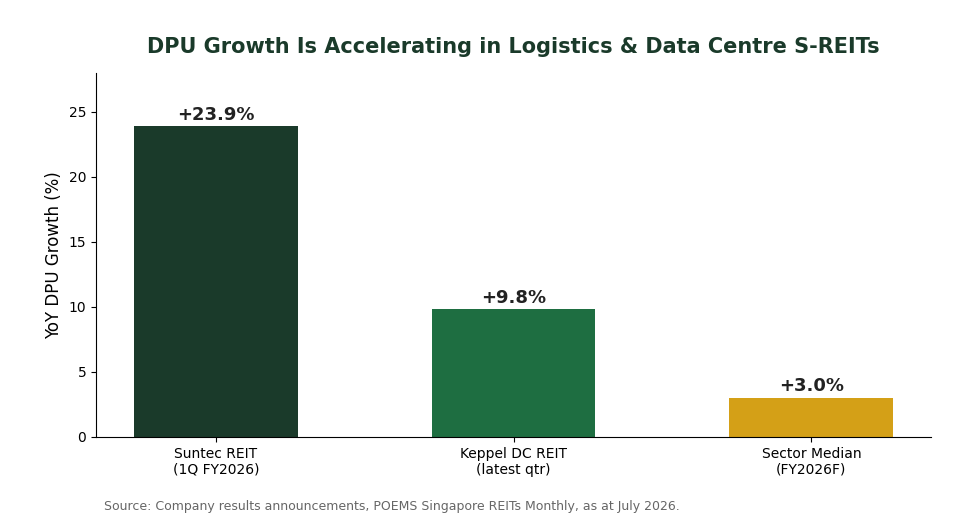
| REIT / Metric | YoY DPU Growth | Period |
|---|---|---|
| Suntec REIT | +23.9% | 1Q FY2026 |
| Keppel DC REIT | +9.8% | Latest quarter |
| Sector median (forecast) | +3.0% | FY2026F |
Source: Company results announcements; POEMS Singapore REITs Monthly, as at July 2026.
S-REIT Performance & Valuation Data
Even after the rally, most blue-chip S-REITs are still trading 15-40% below their NAV, with distribution yields averaging 5.5-7.5% — figures we verified in detail in our S-REIT 5-year-low valuation deep dive. That gap versus Singapore’s 10-year government bond yield of roughly 2.8-3.0% works out to a spread of around 200-300 basis points — still one of the widest in over two years, even after 12 months of recovery.
Here’s a simple way to think about what that means in dollar terms. Say you hold S$20,000 in a diversified basket of blue-chip S-REITs yielding 6% on average. That’s S$1,200 a year in distributions, paid out quarterly or semi-annually — before accounting for any capital appreciation if valuations keep re-rating toward NAV over the rest of 2026.
That said, a wide yield spread is not the same thing as a guaranteed return. Spreads were also wide at various points during 2023-2024, and S-REITs still fell further before they recovered. Valuation gaps tell you the market is pricing in risk — they don’t tell you when, or whether, that risk resolves in your favour.
The April 2026 Wildcard: MAS Tightens Policy
Here’s the twist in the recovery story. On 14 April 2026, MAS tightened monetary policy for the first time in three years — slightly increasing the pace of appreciation it allows for the Singapore dollar’s exchange rate. The move came in response to rising imported energy costs and inflation risk tied to the escalating Middle East conflict, which we covered separately in terms of its direct impact on S-REIT tenants and portfolios.
MAS also raised its 2026 core inflation forecast to a range of 1.5-2.5%, up from an earlier 1.0-2.0% projection. In plain English: policymakers are more worried about inflation now than they were at the start of the year, and they’ve already acted on it once.
Why does this matter for the recovery? A tighter policy stance generally supports a stronger Singapore dollar and, over time, can put upward pressure on SGD interest rates — including SORA. That’s the exact opposite of the tailwind that has powered the 2025-26 S-REIT recovery. MAS reviews policy again on 31 July 2026, just days after this article was published, and again in October. Both dates are worth marking on your calendar if you’re holding S-REITs for the rate-cut story specifically.
Is the Recovery Sustainable Through 2026?
The honest answer is: partly, and unevenly. Here’s the case for and against.
The bull case. Data centre demand from AI infrastructure buildout is a structural, multi-year tailwind, not a one-quarter blip. Logistics REITs continue to benefit from supply chain diversification away from single-country manufacturing. DPU growth is accelerating off a low base, and the 200-300 basis point yield spread over government bonds still leaves room for further re-rating. Results due from Mapletree Industrial Trust, Mapletree Logistics Trust, and Keppel DC REIT over the next week could reinforce this narrative if they beat expectations.
The bear case. The sector-median DPU growth of around 3% is far less exciting than the headline Suntec and Keppel DC REIT numbers suggest — most S-REITs are seeing a gentler recovery, not a dramatic one. MAS’s April tightening move shows the SORA tailwind can reverse. Valuations have already moved up meaningfully from the 5-year lows covered in our earlier July piece, meaning less margin of safety for anyone buying today. And office and hospitality S-REITs are largely absent from the DPU growth leaderboard — this recovery is concentrated, not broad-based.
Putting it together: this looks like a real, data-backed recovery, but a narrow one — concentrated in industrial, logistics, and data centre names, and dependent on a SORA trend that MAS has already shown it’s willing to interrupt. It’s not yet a broad-based sector re-rating you can buy blindly through an index fund and expect uniform results.
How to Position for the Recovery
If you want exposure to this recovery without overpaying, a few practical steps help.
Prioritise sub-sectors with genuine DPU tailwinds. Industrial, logistics, and data centre S-REITs currently have the clearest earnings support. Office and hospitality names may look statistically cheap, but cheap and recovering are not the same thing.
Check the P/NAV discount before you buy. A REIT trading 30% below NAV isn’t automatically a bargain — sometimes the market is pricing in a real problem. Compare against the 15-40% range we documented across the sector to see whether a specific REIT is cheap relative to its peers, not just relative to its own history.
Use your CPF Ordinary Account if you’re investing for the long term. Many blue-chip S-REITs are eligible under the CPF Investment Scheme (CPFIS-OA), which lets you invest OA savings — currently earning a fixed 2.50% — into higher-yielding assets. Our guide on the DBS CPF Investment Account (CPFIA) walks through eligibility, fees, and how to open one.
If you’d rather not pick individual names, a broker or robo-advisor account makes it easy to build a diversified basket. You can open an account through Endowus (referral code: 2V343), Syfe (referral code: SRPRFFFCD), or FSMOne (referral code: P0544985) — The Kopi Notes may earn a referral fee if you sign up through these links, at no extra cost to you.
Building a Singapore Income Portfolio?
Compare brokers and robo-advisors before you start buying into the S-REIT recovery.
Key Risks to the Recovery Narrative
Renewed MAS tightening. If the Middle East conflict continues pushing up energy costs, MAS could tighten policy again at its 31 July or October reviews, pushing SORA back up and reversing the financing-cost tailwind.
The Fed staying higher for longer. A Fed that holds rates well into late 2026 could dampen the broader risk appetite that has helped fund flows into REITs generally, even if SORA itself keeps falling.
Data centre oversupply. AI infrastructure demand has been the standout DPU driver for names like Keppel DC REIT. If capex cools, or new supply comes online faster than demand, that growth could slow sharply.
Tariff and trade risk. Industrial and logistics REITs — the current recovery leaders — are also the most exposed to global trade friction. A renewed tariff escalation could hit tenant demand in exactly the sub-sectors driving today’s DPU growth.
Valuation risk. S-REITs have already re-rated up from their 2026 lows. Buying today means less margin of safety than buying near the bottom, even if the underlying recovery story stays intact.
Frequently Asked Questions
What is the S-REIT recovery in 2026?
Why are S-REITs recovering in 2026 if the Fed hasn't cut rates?
What is SORA and why does it matter for REIT investors?
Which S-REIT sub-sectors are recovering fastest?
Is the S-REIT recovery in 2026 sustainable?
What could stop the S-REIT recovery?
How can I invest in S-REITs during this recovery?
Can I use my CPF Ordinary Account to invest in S-REITs?
Is now a good time to buy S-REITs in 2026?
Sources: Monetary Authority of Singapore (SORA), Trading Economics — Singapore Interest Rate, SGX iEdge S-REIT Leaders Index, POEMS Singapore REITs Monthly, company results announcements. This article is for educational purposes only and does not constitute financial advice.
This article was researched with the help of AI. While we strive to keep all information accurate and up to date, there may be errors. If you notice any discrepancies, please contact us.