Keppel DC REIT vs NTT DC REIT: Which Singapore Data Centre REIT Should You Buy in 2026?
Two SGX-listed pure-play data centre REITs, one pays in SGD and one in USD — here’s the full comparison for Singapore investors.
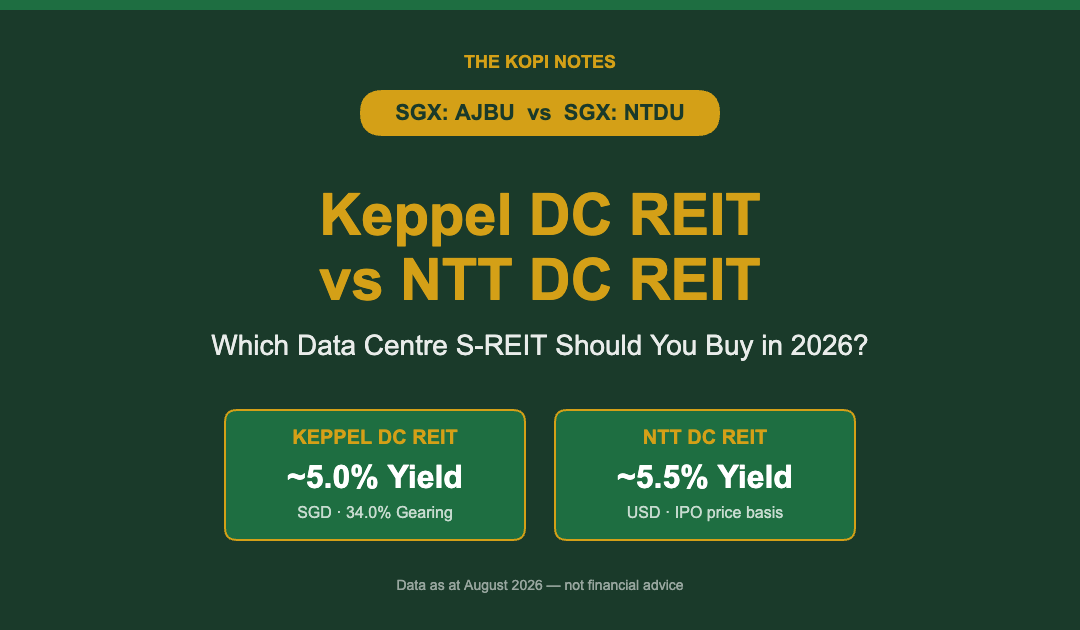
Keppel DC REIT (SGX: AJBU) and NTT DC REIT (SGX: NTDU) are two of only three pure-play data centre REITs listed on the SGX Mainboard, both riding the same AI and hyperscaler demand wave. The key difference for Singapore investors: Keppel DC REIT pays distributions in SGD with a track record since 2014, while NTT DC REIT pays in USD and only IPO’d in mid-2025. Here’s how they actually compare on yield, growth, gearing and currency risk.
Not financial advice. All figures are for educational reference only. Data as at 15 August 2026 unless otherwise noted.
Quick Answer
If you want a data centre REIT with no currency conversion risk and an 11-year SGX track record, Keppel DC REIT is the more straightforward pick — it pays roughly a 5.0% yield in SGD, carries 34.0% gearing well under the MAS 50% cap, and just posted 11.3% DPU growth in 1H2026. If you’re comfortable taking on USD exposure for a slightly higher headline yield and don’t mind a much shorter listed history, NTT DC REIT has beaten its own IPO forecasts in every reporting period since listing in mid-2025, including a 10.6% distributable income beat in its most recent quarter. Neither is a bad choice — the decision mostly comes down to how much USD/SGD currency risk you’re willing to carry in a REIT sleeve of your portfolio.
Key Differences at a Glance
Both REITs sit in Singapore’s small but fast-growing data centre REIT cluster on the SGX Mainboard, alongside Digital Core REIT. Here’s how the two stack up on the metrics that matter most for an income-focused Singapore investor.
| Feature | Keppel DC REIT (AJBU) | NTT DC REIT (NTDU) |
|---|---|---|
| Sponsor | Keppel Ltd | NTT Limited (Japan) |
| Listed since | 2014 (Asia’s first pure-play data centre REIT) | Mid-2025 (IPO) |
| Distribution currency | SGD | USD |
| Latest unit price | ~S$2.24 (31 Jul 2026) | ~US$0.93–0.97 (14 Aug 2026) |
| Distribution yield | ~5.0% | ~5.5% (at IPO pricing) |
| Aggregate leverage | 34.0% | Not separately disclosed in Q1 update |
| Portfolio occupancy | 92.5% (30 Jun 2026) | Not separately disclosed in Q1 update |
| Analyst consensus | Strong Buy (14 Buy / 1 Hold of 15 analysts) | BUY (UOB Kay Hian, US$1.43 target) |
| Key markets | Singapore-anchored, plus Japan, Australia and Europe | Japan, US, Austria, Singapore and other Tier 1 markets |
Source: The Kopi Notes analysis of Keppel DC REIT Share Price Target 2026 and NTT DC REIT Q1 FY2027 Results, both accessed 15 Aug 2026.
Recent Results: 1H2026 vs Q1 FY2027
You can’t compare these two REITs’ latest results on a strictly apples-to-apples basis — Keppel DC REIT reports half-year numbers against the same period a year earlier, while NTT DC REIT reports quarterly numbers against its own IPO prospectus forecast. Both bases matter, but they answer slightly different questions: one tells you whether the business is growing year-on-year, the other tells you whether management is delivering on the numbers they promised at listing.
| Metric | Keppel DC REIT (1H2026) | NTT DC REIT (Q1 FY2027) |
|---|---|---|
| Reporting period | 6 months to 30 Jun 2026 | 3 months to 30 Jun 2026 |
| Comparison basis | Year-on-year | Vs IPO prospectus forecast |
| Revenue growth | Gross revenue +14.5% | Gross revenue −1.1% (US$58.1M) |
| Distribution growth | DPU +11.3% to 5.714 cents | Distributable income +10.6% (US$22.6M) |
| Net property income | NPI +15.1% | FY2026 NPI US$74.9M, +2.3% vs forecast |
Source: Keppel DC REIT 1H2026 Financial Results (Aug 2026); NTT DC REIT SGXNET business update, 14 Aug 2026.
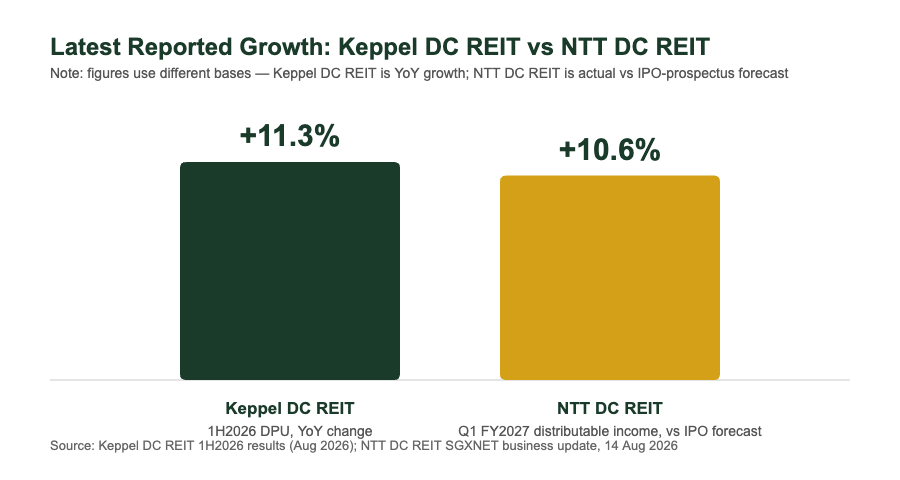
Both REITs beat expectations in their latest report, but the more telling number for a long-term holder is Keppel DC REIT’s pending 2H2026 outlook and AI demand tailwind: a S$1.38 billion deal for two AI-ready hyperscale data centres at Keppel Data Centre Campus, expected to be 8.1% DPU-accretive once it completes. NTT DC REIT doesn’t yet have an equivalent disclosed pipeline deal at this scale, though management has flagged potential acquisitions in Europe and Japan as part of its growth story.
Distribution Yield, Gearing & Occupancy
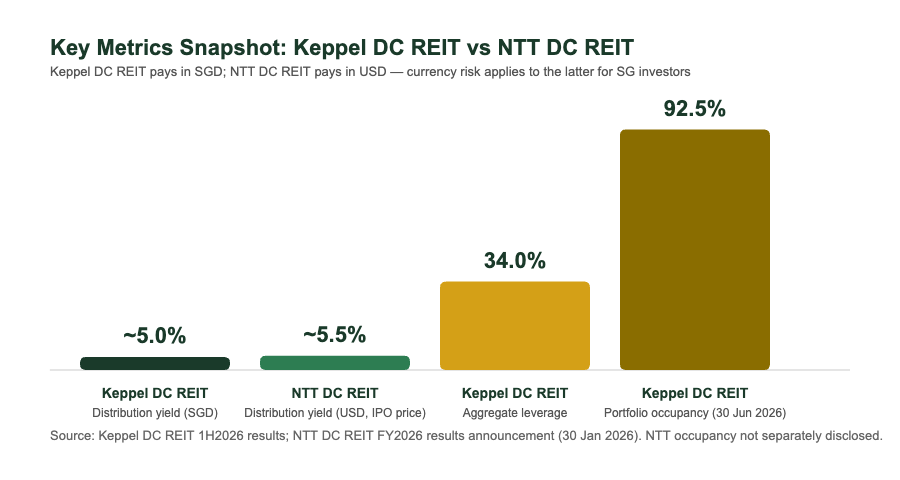
On headline yield, NTT DC REIT edges ahead at roughly 5.5% (calculated against its IPO offer price) versus Keppel DC REIT’s roughly 5.0%. But yield alone doesn’t tell you how much balance-sheet risk you’re taking on for that extra return. Keppel DC REIT’s aggregate leverage sits at a conservative 34.0%, well inside the MAS regulatory cap of 50%, with S$673 million of debt headroom and a stable 2.7% cost of debt — giving it room to fund further acquisitions without needing a rights issue. NTT DC REIT hasn’t separately disclosed a comparable gearing figure in its most recent quarterly update, which makes it harder for a Singapore investor to size up its balance-sheet cushion the same way.
Portfolio occupancy is another area where Keppel DC REIT discloses more granularly: 92.5% as at 30 June 2026, even after absorbing a vacancy at one Cardiff data centre. NTT DC REIT’s occupancy wasn’t broken out in its Q1 FY2027 update, though its Singapore lease was renewed at a rent roughly 23% higher than the previous rate — a strong signal of pricing power even without a headline occupancy number.
Currency Risk: The SGD vs USD Question
This is the part of the comparison most Singapore investors underweight. Here’s a worked example using the 14 August 2026 USD/SGD exchange rate of roughly 1.28. Suppose you put S$10,000 into each REIT. At Keppel DC REIT’s S$2.24 unit price and ~5.0% yield, that stake generates roughly S$500 a year in distributions, paid directly in SGD — no conversion step, no FX risk. The same S$10,000 converted into USD at 1.28 buys about US$7,810 worth of NTT DC REIT units. At its ~5.5% USD yield, that generates about US$430 a year, which converts back to roughly S$550 at an unchanged exchange rate — on paper, a better payout.
But exchange rates move. If the Singapore dollar strengthens by 5% against the US dollar between your investment date and the date NTT DC REIT’s distribution is paid and converted, that same US$430 payout is worth only around S$522 in SGD terms — narrowing most of NTT DC REIT’s apparent yield edge. Keppel DC REIT’s SGD-denominated distributions are immune to this swing entirely. This doesn’t make NTT DC REIT a bad investment — USD exposure can just as easily work in your favour if the US dollar strengthens instead — but it’s a real variable that a pure yield comparison misses.
Who Should Pick Which?
Keppel DC REIT is the more straightforward pick if: you want SGD distributions with zero currency conversion risk, you value a longer 11-year track record and more granular disclosure (gearing, occupancy, debt headroom all reported), or you’re using CPF/SRS funds where SGD simplicity matters. It also suits investors who already hold or are researching Keppel DC REIT’s dividend and DPU history and want continuity with that income stream.
NTT DC REIT is worth considering if: you’re comfortable holding USD-denominated assets as a diversifier, you want exposure to a REIT that has beaten its own IPO forecasts in every reporting period so far, or you specifically want exposure to NTT Group’s global data centre footprint across Japan, the US and Europe rather than a Singapore-anchored portfolio.
If you’re not sure either is the right single pick, our broader Keppel DC REIT vs Digital Core REIT comparison and the best S-REITs in Singapore 2026 guide are good next reads for building out a diversified S-REIT sleeve rather than betting on a single data centre name.
How to Buy Both in Singapore
Both REITs trade on the SGX Mainboard, so you can buy either (or both) through the same brokerage account — no separate account needed for the USD-denominated NTT DC REIT, though your broker will typically require you to hold or convert USD to settle that trade. A few options Singapore investors commonly use:
Syfe Brokerage — commission-free SGX trades with no minimum, useful if you want to build a position in both REITs gradually. Sign up with referral code SRPRFFFCD via our Syfe referral code page for sign-up bonuses.
FSMOne — low-cost SGX access with good REIT research coverage. Use referral code P0544985 via our FSMOne referral code page.
Interactive Brokers (IBKR) — typically the cheapest option for larger positions and the most efficient for holding NTT DC REIT’s USD distributions without extra conversion fees. Use referral code jianxiong368 via our IBKR referral code page.
If you’d rather build a diversified REIT and equity portfolio around these individual picks instead of stock-picking, Endowus lets you invest via unit trusts and portfolios with CPF, SRS or cash. Use referral code 2V343 via our Endowus referral code page.
Risks to Consider
Both REITs share sector-level risks common to data centre landlords: tenant concentration among a small number of hyperscaler and colocation tenants, rising power and cooling costs as AI workloads grow denser, and the risk that today’s AI infrastructure boom cools faster than expected. NTT DC REIT carries the additional layer of USD/SGD currency risk discussed above, plus a much shorter listed track record to judge management execution against. Keppel DC REIT, while more established, still carries interest rate risk on its S$673 million of remaining debt headroom and geographic concentration risk given its Singapore-anchored portfolio. Neither REIT’s past performance guarantees future distributions.
Frequently Asked Questions
What is the main difference between Keppel DC REIT and NTT DC REIT?
The biggest practical difference is distribution currency: Keppel DC REIT pays in SGD with an 11-year SGX track record since 2014, while NTT DC REIT pays in USD and only listed in mid-2025. Keppel DC REIT also discloses more granular metrics like gearing (34.0%) and occupancy (92.5%), while NTT DC REIT’s most recent quarterly update didn’t separately break out those figures.
Which pays a higher distribution yield, Keppel DC REIT or NTT DC REIT?
NTT DC REIT’s yield of roughly 5.5% (calculated against its IPO offer price) is slightly higher than Keppel DC REIT’s roughly 5.0% SGD yield. However, NTT DC REIT’s yield is in USD, so the actual SGD value you receive depends on the USD/SGD exchange rate at the time each distribution is paid and converted.
Is NTT DC REIT riskier than Keppel DC REIT for Singapore investors?
NTT DC REIT carries two extra layers of risk that Keppel DC REIT doesn’t: USD/SGD currency risk on every distribution, and a much shorter listed track record (IPO’d mid-2025 vs Keppel DC REIT’s 2014 listing). That said, NTT DC REIT has beaten its own IPO forecasts in every reporting period since listing, which is a reassuring execution signal even with a short history.
Can I buy Keppel DC REIT or NTT DC REIT using my CPF or SRS funds?
Keppel DC REIT is CPF Investment Scheme (CPFIS) and SRS eligible through most brokers that support SGX Mainboard counters. NTT DC REIT’s USD-denominated distributions can complicate CPFIS eligibility depending on your broker’s setup — check with your specific broker before assuming either scheme applies, as eligibility rules can change.
Which broker should I use to buy Keppel DC REIT or NTT DC REIT?
Both trade on the SGX Mainboard, so any SGX-enabled broker works for either counter. Syfe Brokerage and FSMOne are straightforward, low-cost options for smaller regular purchases, while Interactive Brokers tends to be more cost-efficient for larger positions and for holding NTT DC REIT’s USD distributions without extra conversion fees.
Is Keppel DC REIT or NTT DC REIT better for long-term passive income?
For an investor prioritising simplicity and a longer disclosed track record, Keppel DC REIT is generally the easier long-term income holding, since its SGD distributions and detailed gearing/occupancy reporting make it easier to monitor. NTT DC REIT can complement a portfolio for investors who specifically want USD income diversification and are comfortable with a newer, less-disclosed REIT.
Ready to Add Data Centre REIT Exposure?
Open a brokerage account and start building your S-REIT income portfolio today. Use our referral links for exclusive sign-up bonuses.
This article was researched with the help of AI. While we strive to keep all information accurate and up to date, there may be errors. If you notice any discrepancies, please contact us.