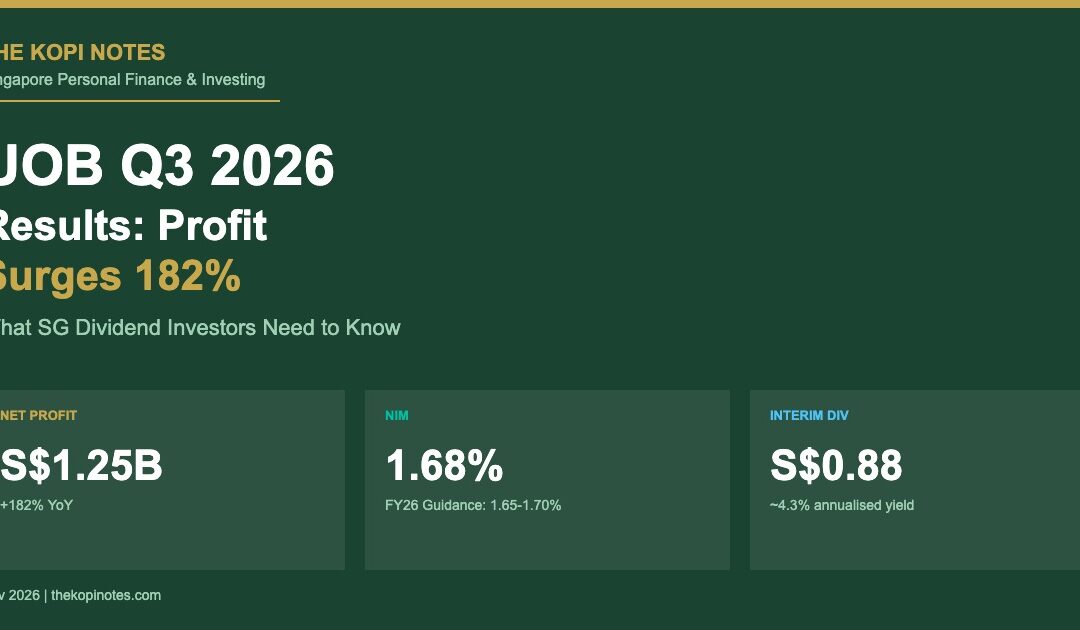
UOB (SGX: U11) reported Q3 2026 net profit of S$1.25 billion — a dramatic 182% jump year-on-year but still 9% short of analyst forecasts. With net interest margin slipping to a multi-quarter low of 1.68% and Greater China credit stress rising, Singapore’s third-largest bank is navigating a tricky environment. Here’s the full breakdown and what it means for dividend investors holding or considering UOB.
This is an editorial analysis. Not financial advice. Data verified as at 9 November 2026.
The Numbers Behind UOB’s 182% Profit Jump
On the surface, UOB’s Q3 2026 numbers look spectacular. Net profit of S$1.25 billion is 182.2% above Q3 2025’s S$443 million. But that headline figure is almost entirely explained by one factor: last year’s quarter was crushed by S$1.36 billion in credit allowances as UOB made aggressive pre-emptive provisions for Greater China real estate stress.
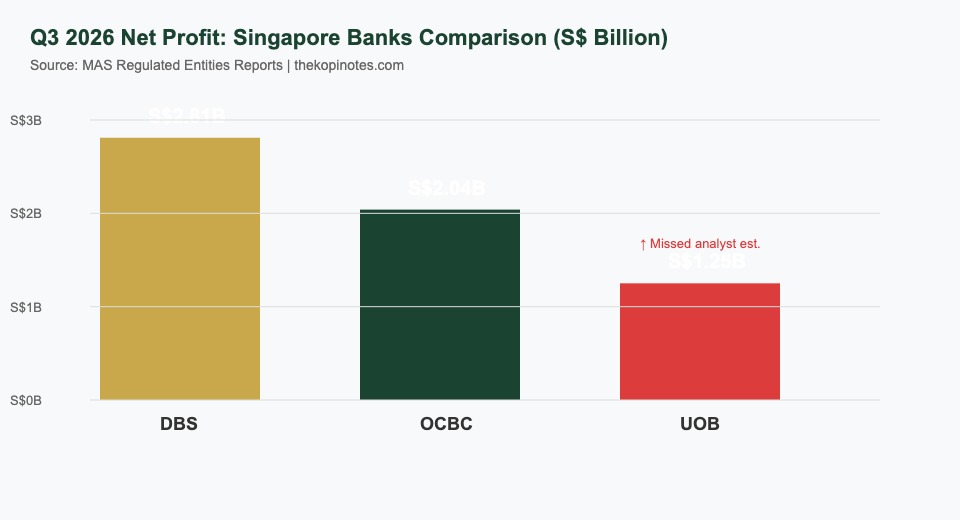
Strip that away, and what you have is a bank generating steady — but softening — core earnings. For the nine months ended September 2026, UOB earned S$4.17 billion in net profit, up 27% year-on-year. That’s solid, but it came in short of the Bloomberg consensus of S$1.38 billion for the quarter alone — a miss of roughly 9%.
The miss was primarily driven by a 41% quarter-on-quarter collapse in other non-interest income, which fell to S$370 million from Q2 2026’s elevated levels. The culprit? Q2 2026 included one-off asset divestment gains that inflated the base. With those gone in Q3, the comparison looked ugly. Net interest income, however, was broadly stable — coming in at S$2.28 billion, down just 1% quarter-on-quarter and up 1% year-on-year from S$2.27 billion in Q3 2025.
For Singapore retail investors who follow DBS’s Q3 2026 results, which showed a 5% profit decline on 65% lower trading income, UOB’s story carries a similar theme: core banking is resilient, but market-sensitive income is volatile and unpredictable.
NIM Compression — 1.68% and Falling
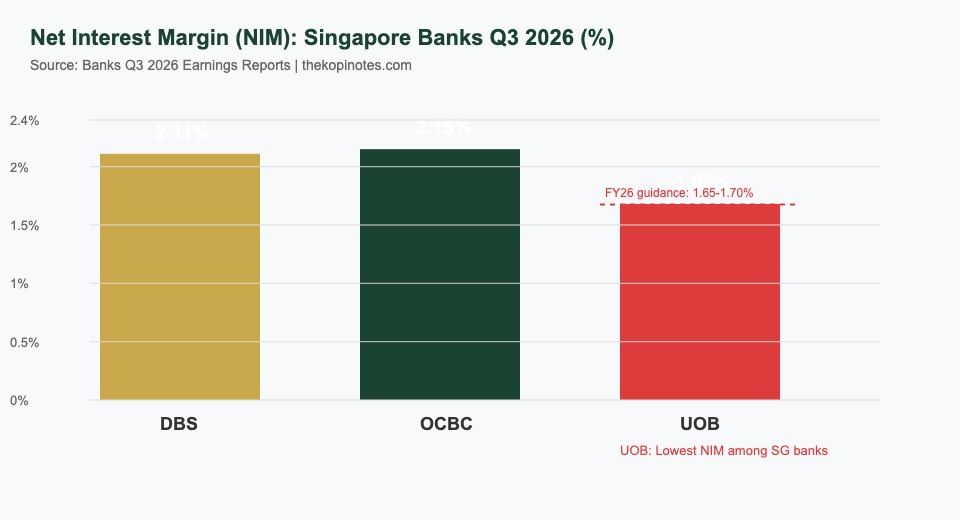
Net interest margin is the lifeblood of a bank’s profitability, and UOB’s trend is not encouraging. At 1.68% in Q3 2026, NIM fell 6 basis points from Q2 2026’s 1.74%, and 14 basis points from Q3 2025’s 1.82%. The nine-month average now sits at 1.75% — right at the bottom of UOB’s own FY2026 guidance range of 1.75–1.80%.
The drivers of NIM compression are well understood: funding costs are falling faster than lending yields can adapt, and the global rate cut cycle is squeezing the spread. At its current trajectory, UOB’s full-year NIM is likely to settle at the low end of guidance or even nudge below it in Q4 2026.
This matters for Singapore retail investors because NIM directly translates to net interest income — and therefore earnings. Each 10bp drop in NIM on UOB’s S$372 billion loan book costs approximately S$372 million in annualised earnings. That’s not a small number for a bank targeting stable or growing dividends.
Compare this to the Singapore banking landscape: OCBC’s Q3 2026 results showed stronger NIM resilience, which is part of why OCBC beat estimates while UOB missed. Singapore investors monitoring the global rate environment should note that any further US Fed cuts could keep NIM under pressure well into 2027.
Record Fees: UOB’s Wealth Engine Firing
Not everything is under pressure at UOB. The bank’s fee income business is on a genuine growth trajectory, and Q3 2026 delivered a record S$733 million in net fee income — up 19% year-on-year from S$615 million and up 10% quarter-on-quarter. This is the clearest bright spot in the results.
The drivers span multiple business lines. Wealth management income rose 13% year-on-year for the nine months ended September, credit card income surged 25% year-on-year for the same period, and loan-related fee activity has been buoyed by strong trade loan growth — which jumped 31% year-on-year to S$372 billion in total loans. Assets under management also grew to S$204 billion, up 3%.
UOB is also executing on a longer-term wealth ambition: management has explicitly targeted doubling wealth income by 2030, and the Q3 results suggest this trajectory is on track. The bank recently inked a partnership with Allianz Global Investors around its UOB Asset Management business — another signal of strategic intent to grow fee-based revenue that is less sensitive to interest rate cycles.
For Singapore investors interested in building a dividend and growth portfolio, UOB’s wealth growth story is worth monitoring alongside the best investment returns in Singapore 2026 — particularly as wealth income becomes a more stable counter to NIM pressure.
Greater China Risk: The Red Flag
UOB’s Greater China exposure remains the most watched risk in its credit book. The Greater China NPL ratio edged up to 5.0% in Q3 2026, from 4.8% in Q2 2026 — and alarmingly, it was just 3.5% six months earlier. The Greater China real estate and hospitality NPL ratio specifically stands at 3.8%.
This is not a crisis-level number, and UOB’s overall NPL ratio actually improved quarter-on-quarter to 1.5% from 1.6%, reflecting broader credit quality improvement. NPA coverage stands at 86% (or 269% when collateral is included), so the bank is well-provisioned. Total allowances in Q3 came in at S$258 million — down 81% year-on-year from Q3 2025’s elevated S$1.36 billion, which is why profits look so good on a headline YoY basis.
But the direction of travel for Greater China NPLs is worth watching carefully. If Greater China NPLs continue rising through Q4 2026, UOB may need to increase provisions — which would directly impact the dividend and share price.
Management has set credit cost guidance at 25–30 basis points for FY2026, and Q3’s 24bp came in just below that range. For now, credit quality is holding. But investors should track this metric closely in the Q4 2026 results expected in February 2027.
UOB vs DBS vs OCBC — Q3 2026 Scorecard
| Metric | DBS (D05) | OCBC (O39) | UOB (U11) |
|---|---|---|---|
| Q3 2026 Net Profit | S$2.81B | S$2.04B | S$1.25B |
| YoY Change | -5% | +3% | +182% (low base) |
| vs Analyst Forecast | Missed | Beat | Missed (-9%) |
| Q3 NIM | ~2.11% | ~2.15% | 1.68% |
| FY26 NIM Guidance | Not updated | Upgraded | 1.75–1.80% |
| Interim Dividend | S$0.75/qtr | S$0.42 (H1) | S$0.88 (H1) |
| Post-Results Share Move | Hit all-time high | Hit all-time high S$18.08 | Fell ~5% |
| Analyst Consensus | Buy | Buy/Hold | Hold |
Note: NIM figures for DBS and OCBC are approximate based on published Q3 2026 guidance. Sources: Company press releases, Nov 2026.
UOB Dividend: What’s the Yield and Is It Safe?
UOB does not pay a quarterly dividend like DBS. Its typical cadence is an interim dividend at the half-year results (usually August) and a final dividend with the full-year results (usually February). For 2026, UOB paid an interim dividend of S$0.88 per share with its 1H26 results.
At the post-results share price of approximately S$38.44, annualising the interim figure gives a trailing yield of roughly 4.3% — competitive in Singapore’s dividend landscape and well above the current SRS account investment options and Singapore savings bond rates.
Is the dividend safe? The case for safety is reasonably strong: UOB’s CET1 capital ratio stands at 14.6% even after the interim dividend payment, well above the regulatory minimum. The case for caution centres on NIM trends, Greater China stress, and the possibility of below-guidance profits triggering a more conservative payout in the final dividend.
Analyst View: Hold, Not Buy
The post-results analyst consensus on UOB has coalesced around “Hold.” Following the 5% share price drop, UOB’s valuation metrics remain stretched: at 1.35 times price-to-book, the bank is trading above its historical average of 1.15 times. For a bank that missed forecasts, is seeing NIM compress, and has rising Greater China credit stress, the market is saying: “We see the value, but not the catalyst.”
For Singapore investors building long-term portfolios alongside Singapore’s strong Q3 2026 GDP growth of 5.4%, UOB’s domestic and ASEAN franchise remains compelling. The bank’s loan book grew 6% year-on-year, trade finance activity is booming (trade loans up 31%), and the wealth management pivot is gaining traction.
Bottom Line for SG Investors
UOB’s Q3 2026 results present a classic case of a headline number (182% profit surge) that tells a very different story from the underlying earnings trend (NIM compression, forecast miss, Greater China stress). For Singapore retail investors, here are the key takeaways:
1. The 182% YoY jump is a base effect, not a step-change. Q3 2025 was UOB’s weakest quarter in years due to massive provisions. Profit didn’t triple — the base collapsed and recovered.
2. NIM at 1.68% is the lowest in four quarters and sitting at the bottom of guidance. If rate cuts continue through 2027, UOB’s NIM may undershoot its own forecast.
3. Record fees are a genuine positive. S$733 million in fee income, up 19% year-on-year, represents real business momentum in wealth and cards.
4. Greater China NPL at 5.0% is worth watching. The upward trend from 3.5% six months ago warrants attention in Q4 results.
5. The dividend (~4.3% annualised yield) is likely safe for now. CET1 is strong at 14.6%, and earnings coverage is comfortable.
6. At 1.35x price-to-book, UOB is not cheap. A better entry point may emerge if concerns weigh on the share price further.
For now, UOB is a core Singapore bank you hold for yield and ASEAN growth exposure — not a near-term alpha trade. Watch the Q4 2026 results in early 2027.
Frequently Asked Questions: UOB Q3 2026 Results
What was UOB’s Q3 2026 net profit?
UOB reported a net profit of S$1.25 billion for Q3 2026 (the quarter ended 30 September 2026). This was 182% higher year-on-year from the Q3 2025 figure of S$443 million, which had been severely depressed by S$1.36 billion in credit allowances. However, the Q3 2026 result came in 9% below the Bloomberg analyst consensus of S$1.38 billion, making it a technical miss.
Why did UOB’s share price fall after Q3 2026 results?
UOB shares fell approximately 5% after the Q3 2026 results were released on 4 November 2026, closing near S$38.44. The decline reflected three concerns: (1) the 9% forecast miss on net profit, (2) continued NIM compression to 1.68% — the lowest in several quarters, and (3) the 41% quarter-on-quarter drop in non-interest income, which spooked investors even though it was largely due to the absence of one-time asset divestment gains from Q2 2026.
What is UOB’s dividend for 2026?
UOB declared an interim dividend of S$0.88 per share for the first half of 2026, paid in August 2026. No dividend is typically declared with Q3 results, as UOB pays on a semi-annual schedule. Based on 9M26 earnings, analysts estimate the full-year 2026 dividend could be in the range of S$1.37–1.45 per share, implying a full-year yield of approximately 3.6–4.5% at the post-results share price of around S$38.44.
Is UOB’s NIM going to recover in 2027?
UOB’s NIM guidance for FY2026 is 1.75–1.80%, and Q3 2026’s NIM of 1.68% already sits below this range. For 2027, management has guided that net interest income will be above 2026 levels. Whether NIM genuinely recovers depends on the trajectory of US Federal Reserve rates and Singapore interbank lending rates (SIBOR/SORA). Many analysts expect modest NIM stabilisation in 2027, not a sharp recovery.
How does UOB compare to DBS and OCBC in Q3 2026?
OCBC was the standout performer in Q3 2026, beating estimates with S$2.04 billion in net profit and upgrading its full-year guidance — shares hit an all-time high of S$18.08. DBS posted S$2.81 billion in profit (down 5% YoY) but also hit an all-time high, buoyed by strong capital returns. UOB was the laggard — missing forecasts, seeing NIM compress to its lowest level, and experiencing a 5% share price drop. For comparative analysis, see TKN’s coverage of OCBC Q3 2026 results.
What is the main risk for UOB investors going into 2027?
The primary risk is a deterioration in UOB’s Greater China loan book. The Greater China NPL ratio reached 5.0% in Q3 2026, up from 4.8% in Q2 and just 3.5% six months ago. While overall NPL improved to 1.5%, Greater China real estate and hospitality stress is trending in the wrong direction. If this stress accelerates, UOB may need to significantly increase provisions again. The secondary risk is deeper-than-expected NIM compression if the US Federal Reserve cuts rates faster than anticipated.
This article was researched with the help of AI. While we strive to keep all information accurate and up to date, there may be errors. If you notice any discrepancies, please contact us.