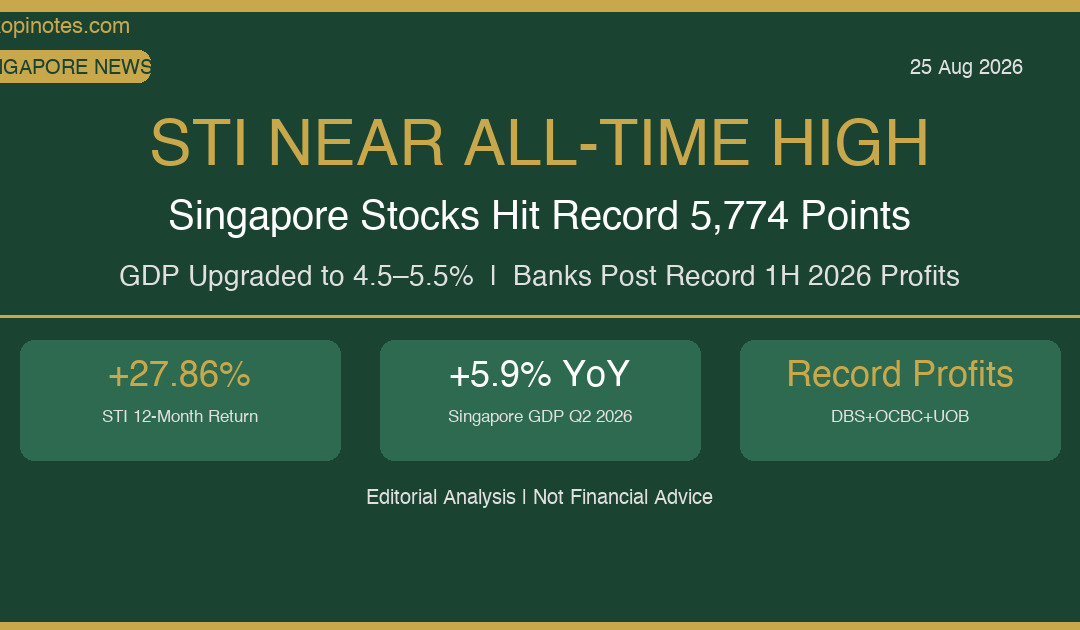
Singapore’s Straits Times Index (STI) hit an all-time intraday high of 5,774 points in August 2026 — driven by a GDP upgrade to 4.5–5.5%, record bank profits, and a surge in foreign capital inflows. With the index up 27.86% over 12 months, many retail investors are asking the same question: is it too late to buy in — or just the beginning of a bigger rally?
This is an editorial analysis. Not financial advice. Data verified as at 25 August 2026.
What Just Happened: Singapore’s STI Hits All-Time High
On 11 August 2026, the Straits Times Index closed at 5,754.17 — up 0.98% on the day — and hit a new intraday high of 5,774.21. That marked a fresh all-time record for Singapore’s benchmark equity index, which tracks the 30 largest companies listed on the Singapore Exchange (SGX).
To put that in context: the STI first crossed 4,000 points in March 2025. It has effectively added nearly 1,800 points — a 44% jump — in roughly 17 months. Over a rolling 12-month period, the index has delivered a return of 27.86%, outperforming most developed-market equity indices over the same window.
The rally is not a coincidence. Three interlocking forces explain it: a revised GDP growth outlook, record bank earnings, and global capital rotation into Singapore assets as a perceived safe harbour amid global macro uncertainty.
Singapore’s GDP Upgrade: The Engine Behind the Rally
The single biggest catalyst came from Singapore’s Ministry of Trade and Industry (MTI), which in early August upgraded its GDP growth forecast for 2026 from a range of 2%–4% to a significantly more bullish 4.5%–5.5%. The ministry cited two key drivers: stronger-than-expected economic momentum in the first half of the year, and accelerating global capital expenditure tied to artificial intelligence infrastructure buildout.
Singapore’s Q2 2026 GDP came in at 5.9% year-on-year growth — a figure that surprised to the upside and validated the upgrade. The manufacturing sector, particularly semiconductor and precision engineering segments, showed renewed strength as supply chain reshoring trends benefited Singapore’s industrial base. Financial services continued to grow strongly, anchored by robust bank earnings.
Singapore’s Big Three Banks Drive the STI Higher
Banks make up roughly 54% of the STI by market capitalisation, which means what happens to DBS, OCBC, and UOB largely determines where the index goes. In 1H 2026, all three delivered record or near-record earnings — and all three raised their interim dividends.
| Bank | 1H 2026 Net Profit | YoY Change | Interim Dividend/Share | Dividend Change |
|---|---|---|---|---|
| DBS Group | S$6.01 billion | +5% YoY | S$1.62 | +8% YoY |
| OCBC Bank | S$4.19 billion | +13% YoY | S$0.47 | +15% YoY |
| UOB | S$2.92 billion | +3% YoY | S$0.88 | +3.5% YoY |
DBS delivered a record first-half net profit of S$6.01 billion, up 5% year-on-year. The bank declared an interim dividend of S$1.62 per share — an 8% increase — which includes a S$0.30 capital return component. DBS pays this dividend today, 25 August 2026.
OCBC delivered the strongest earnings momentum of the three. Its 1H 2026 net profit hit a record S$4.19 billion (+13% year-on-year), with Q2 alone printing S$2.22 billion (+22% year-on-year) — the first quarter in which OCBC exceeded S$2 billion in profit. Its interim dividend rose 15% to S$0.47 per share.
UOB posted more modest but still solid growth — Q2 net profit of S$1.48 billion (+10%), with 1H 2026 net profit of S$2.92 billion (+3%). Its interim dividend grew 3.5% to S$0.88 per share.
The collective takeaway: Singapore’s banking sector is in excellent health, generating record cash flows and returning growing dividends. With banks comprising more than half the STI, this earnings strength is the single biggest driver of the index rally.
Should You Buy the STI at Record Highs?
This is the question every Singapore retail investor is asking. The short answer: buying at record highs is uncomfortable psychologically, but historically it has rarely been a “wrong” move over a 5–10 year time horizon.
If you are a long-term, passive investor using dollar-cost averaging (DCA), record highs are irrelevant. Historical data shows that the STI — like all broad equity indices — trends upward over long periods.
If you are a lump-sum investor trying to time the market, the data is more sobering: research consistently shows that timing the market underperforms time IN the market.
That said, there are legitimate reasons for caution at these levels. A 27.86% 12-month return is exceptional by historical standards. The average annual STI return over the past decade has been closer to 6–8% (including dividends). Mean-reversion is a real phenomenon.
STI ETF Options for Retail Investors
If you do want STI exposure, there are two main ETF options listed on SGX — both are CPF Investment Scheme (CPFIS-OA) eligible:
| ETF | Ticker | Manager | TER | Dividend Frequency | CPF Eligible |
|---|---|---|---|---|---|
| SPDR STI ETF | ES3 | State Street | 0.30% p.a. | Quarterly | Yes |
| Nikko AM STI ETF | G3B | Nikko AM | ~0.30% p.a. | Semi-annual | Yes |
Both ETFs track the FTSE Straits Times Index with similar expense ratios. ES3 pays dividends quarterly, which some income investors prefer. For a deep comparison, see our guide on ES3 vs G3B: which STI ETF should you buy.
Both ETFs currently yield approximately 3–4% in annual dividend income, which compares favourably to CPF OA’s guaranteed 2.5% floor rate. Learn more about using your CPF OA for investment here.
Risks That Could Derail the Rally
US Federal Reserve policy reversal. If US inflation surprises to the upside and the Fed is forced to hike rates again, Singapore’s rate-sensitive assets — particularly banks and S-REITs — could see sharp de-ratings.
China slowdown risk. Singapore’s economy remains deeply intertwined with China’s trade flows and financial markets. UOB in particular carries Greater China real estate exposure.
Valuation stretch. After a 27.86% 12-month rally, some STI components are trading at elevated price-to-book and price-to-earnings multiples. DBS now trades at over 2x book value.
Geopolitical tension. Any escalation of US-China trade friction, South China Sea tensions, or Middle East instability could dent global trade volumes and risk sentiment.
A well-diversified investor holds STI ETF exposure alongside global ETFs like CSPX (S&P 500) or VWRA (global all-cap) to mitigate concentration in a single market.
Bottom Line for SG Investors
Singapore’s STI at record highs is not a reason to panic — nor is it a green light to throw all your savings into the market at once.
If you don’t yet have exposure: start with a regular savings plan (RSP) into ES3 or G3B via any major brokerage. DCA monthly, regardless of index level.
If you already hold STI ETF: this rally is validation that your long-term thesis is working. Don’t sell simply because the index hit a record. Review your overall asset allocation and rebalance if Singapore now represents a larger portion of your portfolio than intended.
If you’re considering lump-sum investing: deploy in tranches (one-third now, one-third in 3 months, one-third in 6 months) to reduce timing risk. The fundamentals supporting this rally — strong GDP growth, record bank earnings, growing dividends, and Singapore’s structural position as a regional financial hub — are real and substantial.
Frequently Asked Questions
What is the all-time high for the STI in 2026?
The STI hit an all-time intraday high of 5,774.21 points on 11 August 2026, closing that day at 5,754.17. This was driven by a Singapore GDP upgrade to 4.5–5.5% for 2026 and record bank earnings from DBS, OCBC, and UOB.
Should I buy STI ETF when it is at an all-time high?
Historically, buying at record highs is not a bad strategy over a 5–10 year investment horizon. The key is to use dollar-cost averaging (DCA) rather than trying to time a better entry point. Records, by definition, keep getting broken in growing economies over the long run.
Which STI ETF is better: ES3 or G3B?
Both track the same index with similar expense ratios (~0.30% p.a.). ES3 pays quarterly dividends while G3B pays semi-annually. Both are CPF-eligible. See our full ES3 vs G3B comparison guide.
How much have Singapore bank stocks returned in 2026?
DBS, OCBC, and UOB all beat the STI in the first half of 2026 with strong returns driven by record net profits and dividend growth. OCBC delivered the strongest earnings momentum with Q2 2026 net profit up 22% year-on-year. The broader STI has returned +27.86% over the past 12 months.
Can I use CPF to invest in STI ETFs?
Yes. Both ES3 and G3B are eligible under the CPF Investment Scheme (CPFIS-OA), allowing you to invest up to 35% of your investable CPF Ordinary Account savings in these ETFs.
What is Singapore’s GDP growth forecast for 2026?
Singapore’s Ministry of Trade and Industry (MTI) upgraded its GDP growth forecast for 2026 to 4.5%–5.5% in August 2026, up from the previous range of 2%–4%. Singapore’s Q2 2026 GDP came in at 5.9% year-on-year growth.
What are the risks of investing in Singapore stocks now?
Key risks include a reversal of US Federal Reserve rate cuts, China slowdown spillover effects, elevated valuations after a 27.86% 12-month rally, and geopolitical disruptions. Diversifying across Singapore equities and global ETFs helps mitigate concentration risk.
This article was researched with the help of AI. While we strive to keep all information accurate and up to date, there may be errors. If you notice any discrepancies, please contact us.