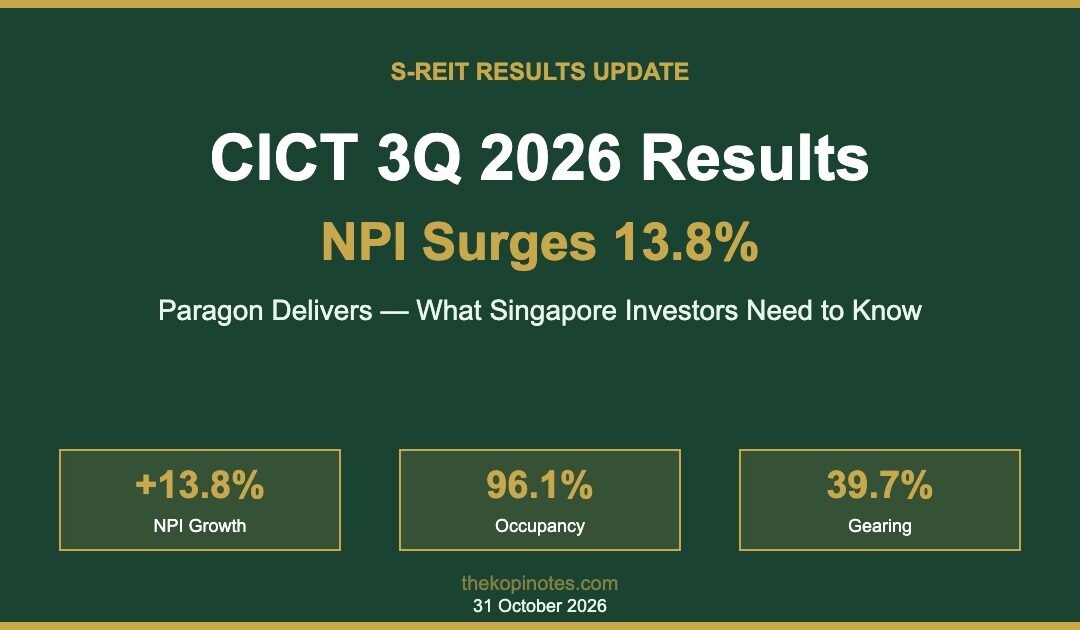
Singapore’s largest diversified REIT, CapitaLand Integrated Commercial Trust (CICT, SGX: C38U), delivered a robust 3Q 2026 business update on 29 October, with net property income surging 13.8% year-on-year to S$334.9 million. The Paragon acquisition, completed in July for S$3.9 billion, is already firing on all cylinders — and with occupancy at 96.1% and rental reversions accelerating, the S-REIT sector’s largest blue chip is building a compelling case for a strong 2H DPU.
This is an editorial analysis. Not financial advice. Data verified as at 31 October 2026.
The Headline Numbers: What CICT Reported for 3Q 2026
CICT released its third-quarter 2026 business update on 29 October, and the numbers tell a clear story of acquisition-driven growth. For Singapore retail investors who follow our S-REIT earnings preview for October 2026, this is the headline update we flagged as the most anticipated of the reporting season.
Here are the key metrics from the 3Q 2026 business update:
| Metric | 3Q 2026 | Prior Period | Change |
|---|---|---|---|
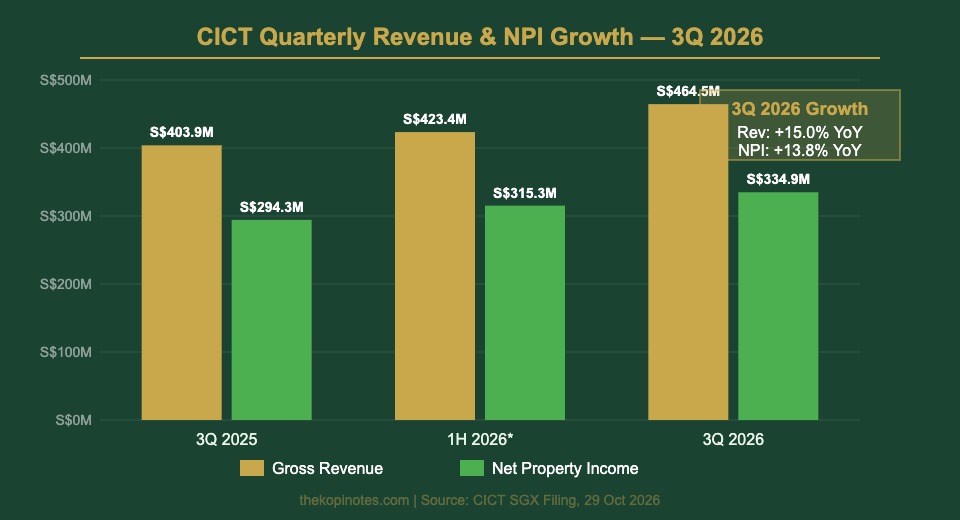
| Gross Revenue | S$464.5M | S$403.9M (3Q25) | +15.0% YoY |
| Net Property Income | S$334.9M | S$294.3M (3Q25) | +13.8% YoY |
| 9M 2026 NPI | S$965.4M | S$874.9M (9M25) | +10.4% YoY |
| Portfolio Occupancy | 96.1% | 95.6% (1H26) | +0.5pp QoQ |
| Retail Rental Reversion (9M) | +4.6% | +4.0% (1H26) | Accelerating |
| Office Rental Reversion (9M) | +7.1% | +6.5% (1H26) | Accelerating |
| Aggregate Leverage (Gearing) | 39.7% | 37.4% (1H26) | +2.3pp (post-Paragon) |
| Average Cost of Debt | 2.8% | 2.9% (1H26) | -0.1pp |
This is CICT’s strongest quarterly NPI performance in years. It reflects the first full quarter of contributions from Paragon — Singapore’s iconic Orchard Road mall and medical centre — which CICT acquired on 1 July 2026 for S$3.9 billion. The portfolio now spans 25 properties valued at S$28.7 billion.
Paragon: Was the S$3.9 Billion Bet Worth It?
When CICT announced the Paragon acquisition in April 2026, market reaction was mixed. Unitholders were diluted — the REIT raised equity through a private placement, pushing units in issue up 5.8% to 7.73 billion — and the S$3.9 billion price tag drew scrutiny in a high-rate environment. Three months of ownership in, the numbers validate management’s conviction.
Integrated developments (which now includes Paragon) saw NPI jump 40.8% to S$123.5 million in 3Q 2026. Paragon brings CICT its first freehold exposure to Orchard Road retail and a built-in medical cluster (Paragon Medical) that provides defensive, non-discretionary tenancy. This materially diversifies CICT’s income stream beyond suburban retail and Grade-A CBD office.
Management expects positive mid-single-digit rental reversions for both retail and office to continue into 4Q 2026. The Tampines Mall AEI completed during 3Q 2026 adds further organic growth momentum — renovation-refresh typically unlocks higher rents at lease renewals. Work has also commenced at Plaza Singapura and The Atrium@Orchard, with the Hougang Central commercial component AEI in progress.
Our CICT 2026 deep-dive analysis modelled that a 1 percentage point rise in interest rates would reduce annual DPU by only 0.33 cents — a manageable sensitivity for a REIT of this scale. With 76% of borrowings on fixed-rate terms, CICT is largely insulated from near-term rate movements.
The Asia Square Tower 2 Divestment: What Happens to S$2.45 Billion?
One of the biggest stories in CICT’s 3Q update is not a purchase, but a sale. On 17 September 2026, CICT completed the divestment of Asia Square Tower 2 (ASTW2) for net proceeds of approximately S$2.45 billion, at a 3.0% exit yield.
An exit yield of 3.0% on a Grade-A CBD office tower represents a favourable crystallisation — effectively selling at a premium to what the building’s net income alone would justify in the current market. The discipline here matters: CICT sold high, freed up capital, and the question now is how management deploys these proceeds. Three scenarios are on the table:
1. Debt repayment: Applying proceeds to loans would bring gearing from 39.7% back toward 35–36%, restoring substantial acquisition capacity for future growth. With Singapore office supply expected to tighten from 2028, this could position CICT to buy again at the right moment.
2. Distribution enhancement: A special capital distribution to unitholders is possible but unlikely near-term, as management has historically prioritised capital recycling over one-off payouts.
3. Asset enhancement initiatives: CICT has several ongoing AEIs totalling hundreds of millions — partially funding these from divestment proceeds avoids equity dilution and keeps distributions growing organically.
Management has not yet signalled its preference. The full-year 2026 results announcement — expected February 2027 — will be a critical watch point for how these funds are deployed.
CICT vs Peers: Portfolio Comparison at 3Q 2026
Context is everything. CICT competes for Singapore investors’ REIT allocation against CLAR, Keppel REIT, Frasers Centrepoint Trust, and others. Here is how the two largest CapitaLand REITs compare at the 3Q 2026 reporting mark:
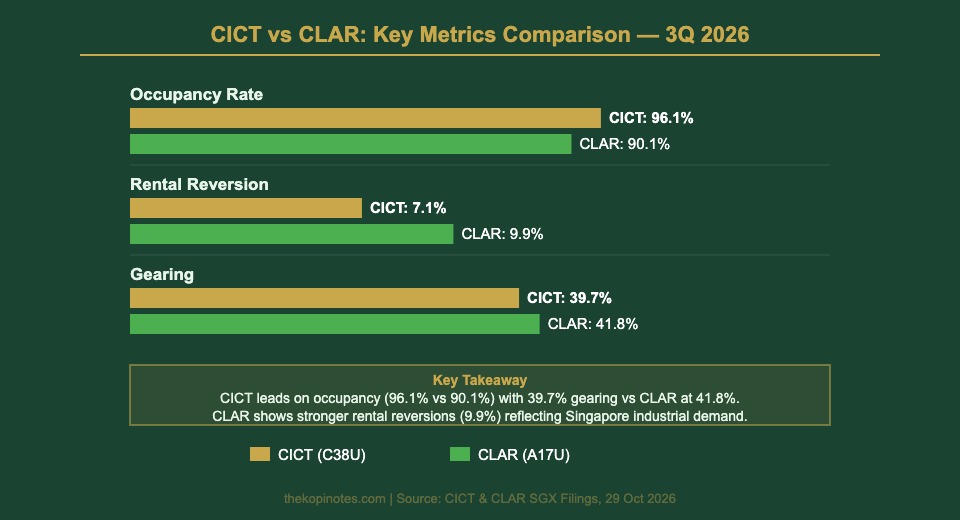
| REIT | Code | Occupancy (3Q26) | Rental Reversion | Gearing | 9M NPI Growth |
|---|---|---|---|---|---|
| CICT | C38U | 96.1% | Retail +4.6%, Office +7.1% | 39.7% | +10.4% |
| CLAR | A17U | 90.1% | +9.9% (3Q26) | 41.8% | N/A (H1 Rev +6.7%) |
CICT leads on occupancy and income predictability, while CLAR shows stronger raw rental reversions reflecting the booming Singapore industrial market. For investors building a core REIT position, understanding average S-REIT dividend yields in 2026 is essential context — the sector currently trades at a 5.8% forward yield, above its 5.1% long-run average.
DPU Outlook: What to Expect for 2H 2026
CICT distributes semi-annually, so 3Q business updates don’t include a DPU announcement. The last declared DPU was 6.02 cents for 1H 2026, up 7.1% year-on-year, with the balance of 2.04 cents paid in September 2026.
For 2H 2026 DPU, three factors are in play. On the positive side: a full half-year contribution from Paragon (versus just one quarter in 2H prior-year context), Tampines Mall AEI completion, and the easing cost of debt (2.8%, down from 2.9%). On the negative side: the ASTW2 divestment removes office income from September 2026, and the larger unit count from the April private placement dilutes per-unit distributions. The net: TKN estimates annualised FY2026 DPU of approximately 12.1–12.4 cents, implying a forward yield of 5.2–5.5% at recent price levels. This should be read alongside our Singapore property vs S-REITs analysis, which shows REIT yields still outperforming residential rental yields on a risk-adjusted basis.
Macro Context: Rates, MAS, and the S-REIT Sector
S-REITs don’t operate in isolation. Two macro factors are shaping the sector’s trajectory into year-end.
The US Federal Reserve held rates at 3.75–4.0% at its October 2026 meeting, as detailed in our Fed Holds October 2026 guide for Singapore investors. A prolonged hold reduces immediate pressure on REIT valuations but delays the re-rating tailwind that rate cuts would bring. Closer to home, MAS held its exchange rate policy steady at the October 2026 meeting — a surprise to markets expecting a third tightening. Our MAS October 2026 analysis covers the full implications.
For CICT specifically: the hold removes one potential headwind (further SGD appreciation crimping Frankfurt Gallileo earnings in SGD terms) while preserving stability for Singapore’s commercial real estate market. The Q3 2026 GDP growth of 5.4% is feeding through to tenant demand and justifies management’s confidence in maintaining positive rental reversions.
Bottom Line for SG Investors
CICT’s 3Q 2026 business update delivers exactly what the market needed to see: proof that the S$3.9 billion Paragon bet is paying off. The 13.8% NPI surge, accelerating rental reversions across both retail and office, and 96.1% portfolio occupancy support a narrative of genuine fundamental strength.
Here is the practical take for Singapore retail investors:
Income seekers: CICT’s estimated forward yield of 5.2–5.5% is competitive for a blue-chip, well-managed S-REIT. With the 2H 2026 distribution expected in early 2027, long-term holders are in a reasonable position. Check our best S-REITs for 2026 guide to see how CICT ranks against the full sector.
CPF/SRS investors: CICT (C38U) is CPF-OA and SRS-eligible. With gearing at 39.7% — well under MAS’s 50% limit — it meets conservative screening criteria for retirement-oriented portfolios. The S$2.45 billion in divestment cash also provides balance sheet optionality that defensively-minded investors will appreciate.
Growth-oriented investors: The ASTW2 divestment proceeds create significant optionality. Accretive deployment into new acquisitions or AEIs could accelerate the DPU trajectory through 2027. Watch the FY2026 results in February.
The risk to watch: Gearing at 39.7% is elevated versus CICT’s own historical range. Any global credit event or unexpected rate shock could widen interest expense. The ASTW2 cash mitigates this meaningfully, but investors should monitor the FY2026 results for confirmation of the deployment strategy.
Frequently Asked Questions: CICT 3Q 2026 Results
What was CICT’s NPI in 3Q 2026?
CICT’s net property income (NPI) in 3Q 2026 was S$334.9 million, up 13.8% year-on-year from S$294.3 million in 3Q 2025. For the nine months to September 2026, cumulative NPI was S$965.4 million, up 10.4% versus the same period in 2025. The main driver was the first full quarter of Paragon’s contribution following the July 2026 acquisition.
Did CICT declare a distribution for 3Q 2026?
No. CICT is a semi-annual distributor and does not declare DPU at quarterly business updates. The last distribution was 6.02 cents per unit for 1H 2026 (up 7.1% year-on-year), with the residual 2.04 cents paid in September 2026. The next DPU announcement will come with the full-year 2026 results, expected in early 2027.
What is CICT’s gearing after the Paragon acquisition?
CICT’s aggregate leverage rose to 39.7% at end-September 2026, up from 37.4% at end-June 2026. The increase reflects funding for the S$3.9 billion Paragon acquisition. This remains comfortably below MAS’s 50% gearing limit. With net proceeds of approximately S$2.45 billion from the Asia Square Tower 2 divestment now received, gearing could fall materially if proceeds are used for debt repayment.
What is CICT’s estimated forward dividend yield?
Based on 1H 2026 DPU of 6.02 cents (annualised to approximately 12.04 cents) and TKN’s estimate of low-to-mid single digit growth for 2H 2026, CICT’s estimated forward yield is approximately 5.2–5.5% at recent trading prices. Investors should verify the current unit price before calculating their personal yield. CICT is traded on SGX under the ticker C38U.
Is CICT eligible for CPF investment?
Yes. CICT (SGX: C38U) is eligible for purchase using CPF Ordinary Account (OA) funds under the CPF Investment Scheme (CPFIS), as well as Supplementary Retirement Scheme (SRS) funds. Investors using CPF-OA funds should note that these funds will not earn the guaranteed 2.5% OA interest rate while invested in CICT. Weigh this opportunity cost carefully relative to CICT’s forward yield.
What happened to Asia Square Tower 2 (ASTW2)?
CICT completed the divestment of Asia Square Tower 2 on 17 September 2026 for net proceeds of approximately S$2.45 billion, representing a 3.0% exit yield. The sale crystallised a capital gain for unitholders and freed up significant liquidity. Management has not yet confirmed how the proceeds will be deployed — options include debt repayment (which would reduce gearing to approximately 35–36%), asset enhancement funding, or future acquisitions.
How does CICT compare with CLAR (CapitaLand Ascendas REIT)?
CICT (retail and office) and CLAR (industrial, logistics, data centres) serve different sectors. At 3Q 2026: CICT occupancy was 96.1% versus CLAR’s 90.1%; CICT gearing was 39.7% versus CLAR’s 41.8%; CLAR showed stronger rental reversions (9.9% for 3Q26) versus CICT’s retail +4.6% and office +7.1% for 9M26. CICT is generally considered more defensive; CLAR offers higher growth potential with more geographic and sector complexity.
This article was researched with the help of AI. While we strive to keep all information accurate and up to date, there may be errors. If you notice any discrepancies, please contact us.