NTT DC REIT Q1 FY2027 Results: Distributable Income Beats IPO Forecast by 10.6% (SGX: NTDU)
Lower costs and favourable FX helped the data centre S-REIT outrun its own IPO projections again — here’s the full breakdown for Singapore investors.
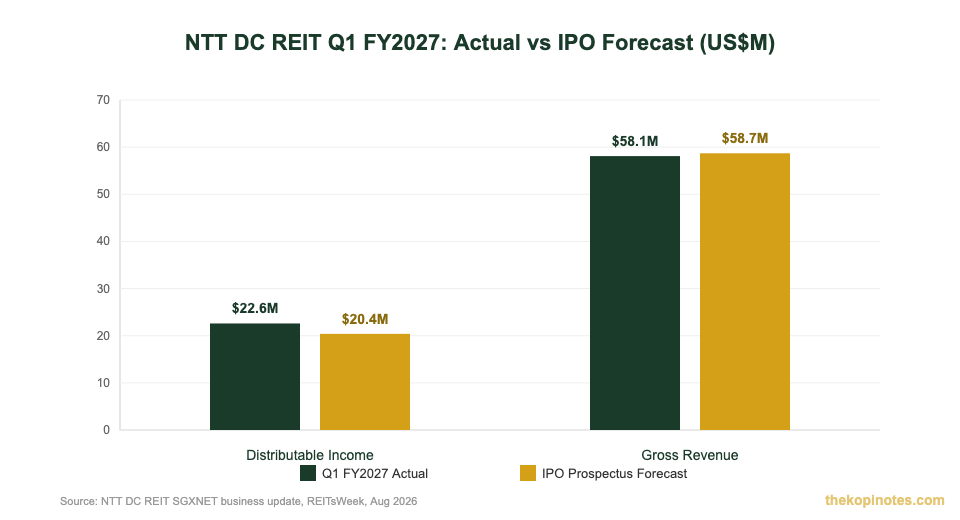
NTT DC REIT reported distributable income of US$22.6 million for the quarter ended 30 June 2026 (Q1 FY2027), 10.6% above the figure implied by its IPO prospectus. Gross revenue of US$58.1 million came in just 1.1% below forecast. Lower operating costs and favourable currency movements offset the small revenue miss, extending a pattern of beating IPO projections since listing.
Not financial advice. All figures are for educational reference only. Data as at 14 August 2026 unless noted.
- Q1 FY2027 distributable income of US$22.6M beat the IPO forecast by 10.6%, even though revenue missed by 1.1%.
- NTT DC REIT’s portfolio value has grown 11.3% since IPO, and its FY2026 DPU also beat forecast by 2.6%.
- UOB Kay Hian rates it a BUY with a US$1.43 target, but the counter still carries FX and AI-capex-cycle risk for SG investors.
What Is NTT DC REIT?
NTT DC REIT is a pure-play data centre real estate investment trust listed on the SGX Mainboard under ticker NTDU. It’s sponsored by NTT Limited, part of Japan’s NTT Group — one of the world’s largest telecommunications and data centre operators. The REIT IPO’d in mid-2025 with a portfolio of hyperscale and colocation data centres across Tier 1 markets including Japan, the United States, Austria, Singapore and other locations.
Unlike most S-REITs, NTT DC REIT distributes income in US dollars, not Singapore dollars. That matters for your returns — more on the currency risk in the risks section below. The REIT sits in the same “AI infrastructure” theme as Keppel DC REIT and Digital Core REIT, riding demand from hyperscalers and AI workloads for data centre capacity.
Q1 FY2027 Results at a Glance
NTT DC REIT’s fiscal year runs from April to March. The quarter ended 30 June 2026 is therefore its first quarter of FY2027 (1Q FY2027). Here’s how the actual numbers stacked up against what the IPO prospectus projected for the same period.
| Metric | Q1 FY2027 Actual | vs IPO Forecast |
|---|---|---|
| Distributable Income | US$22.6 million | +10.6% |
| Gross Revenue | US$58.1 million | -1.1% |
| Reporting Period | 3 months to 30 June 2026 | — |
Source: NTT DC REIT SGXNET business update; REITsWeek, 12 Aug 2026
Here’s why the beat matters even with revenue slightly missing. Lower-than-expected operating costs — think property taxes and management expenses — combined with favourable currency movements more than made up for the US$0.6 million revenue shortfall. In plain English: the REIT ran a tighter ship than its own prospectus assumed, and it got a currency tailwind on top.
How This Fits the FY2026 Full-Year Beat
This isn’t a one-off. NTT DC REIT’s full financial year FY2026 (12 months to 31 March 2026) also came in ahead of its own IPO projections. DPU of 5.56 US cents was 2.6% above forecast, translating to a yield of around 5.5% at IPO pricing. Gross revenue of US$164.8 million beat forecast by 2.5%, and net property income of US$74.9 million came in 2.3% higher than projected.
| Metric | FY2026 (12 months to 31 Mar 2026) | vs IPO Forecast |
|---|---|---|
| DPU | 5.56 US cents | +2.6% |
| Gross Revenue | US$164.8 million | +2.5% |
| Net Property Income | US$74.9 million | +2.3% |
Source: NTT DC REIT FY2026 results announcement, 30 January 2026
Here’s a rough way to sanity-check the trend, not a forecast: if you annualise the Q1 FY2027 distributable income figure (US$22.6 million × 4), you get approximately US$90 million for the full year — well above the US$87.9 million implied by 4× the FY2026 quarterly run-rate. That’s a simple back-of-envelope comparison, not guidance, since quarterly numbers move around with lease renewals, acquisitions and FX. But it’s a useful yardstick for tracking whether NTT DC REIT keeps outperforming its own numbers as FY2027 progresses.
Portfolio & Valuation Update
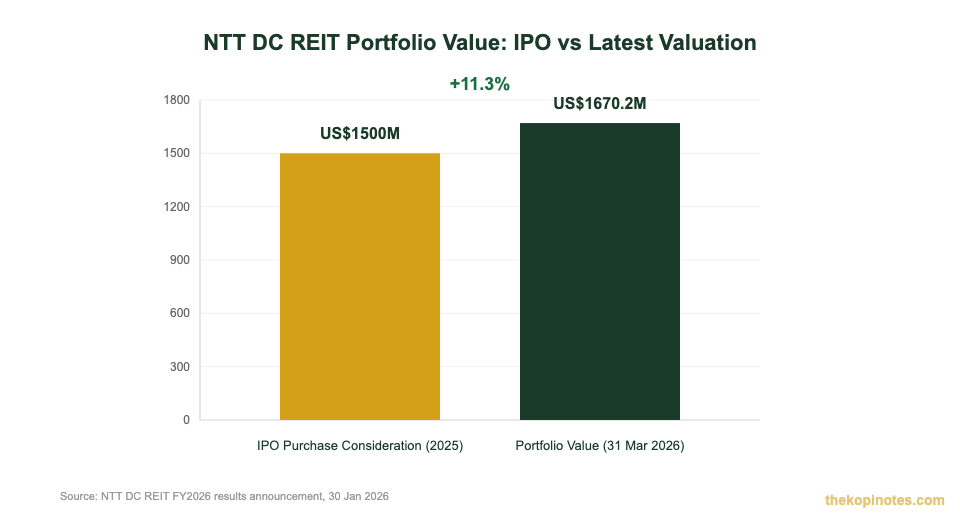
NTT DC REIT’s portfolio was valued at US$1,670.2 million as at 31 March 2026, up 11.3% from the US$1,500 million purchase consideration at IPO in 2025. That growth reflects positive rental reversions and continued rental growth across the REIT’s key markets, rather than fresh acquisitions alone.
On the leasing front, the REIT’s Singapore lease was renewed at a rent roughly 23% higher than the previous rate, according to UOB Kay Hian’s coverage note. That’s a meaningful data point for a market where Digital Core REIT and Keppel DC REIT are also fighting for hyperscaler tenants.
What Analysts Are Saying
UOB Kay Hian has a BUY rating on NTT DC REIT, with a target price of US$1.43. The house cites a high DPU yield, new lease signings, portfolio expansion into Tier 1 data centre markets, and potential acquisitions in Europe and Japan as reasons to like the counter. As at 14 August 2026, NTT DC REIT units trade around US$0.93–0.97, which would put UOB Kay Hian’s target meaningfully above the current price — though note that target price was set at the time of initiation and market prices move daily, so treat the upside figure as directional rather than precise.
| Broker | Rating | Target Price | Key Reasons |
|---|---|---|---|
| UOB Kay Hian | BUY | US$1.43 | DPU yield, new leases, Tier 1 expansion, EU/Japan acquisition pipeline |
Source: The Edge Singapore, brokers’ calls coverage, July 2026
NTT DC REIT vs Other Singapore Data Centre REITs
NTT DC REIT isn’t the only way to get data centre exposure on the SGX. Here’s how it stacks up against the two other listed pure-play options, Keppel DC REIT and Digital Core REIT.
| REIT | Ticker | Distribution Currency | Sponsor | Latest Occupancy |
|---|---|---|---|---|
| NTT DC REIT | NTDU | USD | NTT Limited (Japan) | Not separately disclosed in Q1 update |
| Keppel DC REIT | AJBU | SGD | Keppel Ltd | 92.5% (30 Jun 2026) |
| Digital Core REIT | DCRU | USD | Digital Realty | 97% (1H 2026) |
Source: Company SGX filings and results announcements, 2026
The USD distribution is the biggest structural difference for Singapore investors. It works in your favour when the US dollar strengthens against SGD, as it did this quarter, but it also means your income stream moves with FX in a way SGD-denominated REITs like Keppel DC REIT don’t.
Risks to Watch
NTT DC REIT’s IPO-beating quarters are encouraging, but you should weigh a few real risks before buying.
Currency risk. Distributions are declared in US dollars. If you’re a Singapore-based investor spending in SGD, a weaker USD trims what you actually receive, even if the REIT’s underlying performance holds up.
AI capex cycle risk. Data centre demand is tied to hyperscaler and AI spending. If that capex cycle slows or hyperscalers renegotiate leases downward, occupancy and rental reversions could soften across the sector — not just for NTT DC REIT.
Tenant concentration. Pure-play data centre REITs often lean on a small number of large hyperscaler tenants. A single lease non-renewal can move the needle more than it would for a diversified retail or industrial REIT.
Valuation gap to target. UOB Kay Hian’s US$1.43 target implies substantial upside from current levels, but a single broker’s target isn’t a guarantee — always check for updated coverage before acting on any target price.
For a broader view of how data centre S-REITs fit into an income portfolio, see our best S-REITs in Singapore 2026 roundup, and our guide to building passive income in Singapore using dividend-paying REITs. If you want to model how NTT DC REIT’s distributions could fit into your retirement income mix, our Singapore retirement calculator lets you plug in a target yield and portfolio size to see the numbers. And if you’re setting up a brokerage account to buy SGX-listed REITs like NTDU for the first time, you can start with the Syfe referral code and sign-up bonus for a straightforward entry point.
One more practical note: because NTT DC REIT trades in US dollars, check your broker’s FX conversion fees before buying. A 1% FX spread on distributions can meaningfully erode the yield advantage over a full year, especially if you’re reinvesting quarterly.
Frequently Asked Questions
What is NTT DC REIT?
NTT DC REIT is a pure-play data centre REIT listed on the SGX Mainboard under ticker NTDU. It’s sponsored by NTT Limited, part of Japan’s NTT Group, and owns hyperscale and colocation data centres across Tier 1 markets including Japan, the US, Austria and Singapore.
Did NTT DC REIT beat expectations in Q1 FY2027?
Yes. For the quarter ended 30 June 2026, distributable income of US$22.6 million came in 10.6% above the figure implied by the REIT’s IPO prospectus, even though gross revenue of US$58.1 million missed forecast by 1.1%. Lower operating costs and favourable FX made up the gap.
What is NTT DC REIT's dividend yield?
For FY2026 (12 months to 31 March 2026), NTT DC REIT’s DPU was 5.56 US cents, translating to roughly 5.5% yield based on IPO pricing. Because distributions are in US dollars, your actual SGD yield will vary with the USD/SGD exchange rate.
Is NTT DC REIT a buy according to analysts?
UOB Kay Hian rates NTT DC REIT a BUY with a target price of US$1.43, citing high DPU yield, new lease signings and a Tier 1 market expansion pipeline. As with any single broker call, check for the most recent coverage before making a decision, and don’t rely on one target price alone.
Can I invest in NTT DC REIT with CPF or SRS?
NTT DC REIT is not on the CPF Investment Scheme (CPFIS) approved list as at August 2026, so you cannot use CPF Ordinary Account funds to buy it directly — always check the latest CPFIS list before assuming eligibility. It may be purchased using SRS funds through brokers that support SRS trading of SGX-listed counters; confirm with your broker first.
What are the main risks of NTT DC REIT?
The biggest risks are currency exposure (distributions are in USD), a potential slowdown in AI-driven data centre demand, tenant concentration with large hyperscaler clients, and the usual REIT risks like interest rate sensitivity and refinancing costs.
Build a Diversified S-REIT Income Portfolio
Compare data centre S-REITs against the rest of the market and put your dividend income on autopilot.
This article was researched with the help of AI. While we strive to keep all information accurate and up to date, there may be errors. If you notice any discrepancies, please contact us.