Keppel DC REIT vs Mapletree Industrial Trust 2026: Which Data Centre REIT Wins?
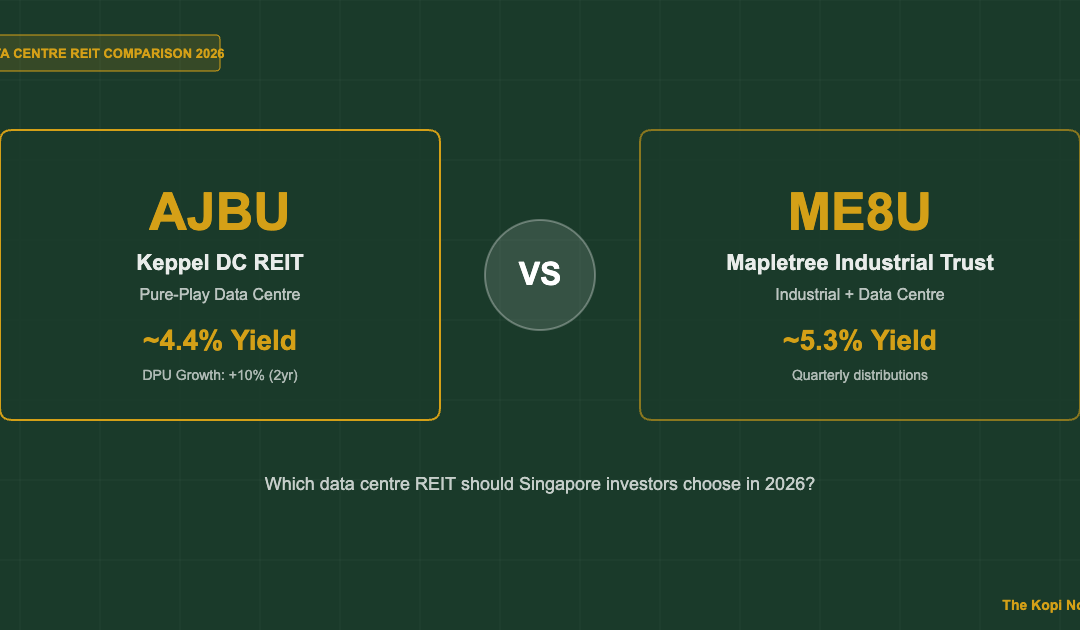
Keppel DC REIT (SGX: AJBU) and Mapletree Industrial Trust (SGX: ME8U) are Singapore’s two dominant data centre REITs — both benefiting from AI-driven colocation demand but with very different portfolios, yield profiles, and risk characteristics. AJBU offers a pure-play data centre bet at a ~4.4% yield; ME8U delivers a higher ~5.3% yield with a diversified industrial-plus-data-centre mix. Here is a side-by-side comparison to help Singapore investors decide which fits their portfolio better in 2026.
Not financial advice. All figures are for educational reference only. Data as at October 2026 unless noted.
Table of Contents
1. REIT Overviews at a Glance
Keppel DC REIT listed on the SGX in December 2014 as Asia’s first pure-play data centre REIT. As of October 2026, it holds 23 data centres across nine countries — Singapore, Australia, Germany, Netherlands, UK, Ireland, Italy, Malaysia, and Japan — with total assets under management (AUM) of approximately S$4.8 billion. Its tenants include Amazon Web Services, Microsoft Azure, Alibaba Cloud, and Google Cloud.
Mapletree Industrial Trust, meanwhile, has evolved significantly since its 2010 IPO. Today, roughly 58% of its portfolio by value is in data centres (primarily in the US, following the Mapletree Rosewood acquisition and subsequent campus expansions), with the remaining 42% in Singapore industrial properties including flatted factories, hi-tech buildings, and business parks. Its AUM is approximately S$8.9 billion — nearly twice the size of KDC. Both REITs carry strong sponsor backing from Keppel Corporation and Mapletree Investments (a Temasek subsidiary) respectively.
| Metric | Keppel DC REIT (AJBU) | Mapletree Industrial Trust (ME8U) |
|---|---|---|
| SGX Ticker | AJBU | ME8U |
| Market Cap (Oct 2026) | ~S$4.4B | ~S$7.2B |
| Share Price | ~S$2.20 | ~S$2.30 |
| Distribution Yield | ~4.4% | ~5.3% |
| AUM | ~S$4.8B | ~S$8.9B |
| Portfolio Focus | 100% data centres | ~58% data centres + 42% industrial |
| No. of Properties | 23 data centres | ~140 properties |
| Sponsor | Keppel Corporation | Mapletree Investments |
Source: SGX company disclosures, REIT annual reports (October 2026)
2. Yield & DPU Comparison
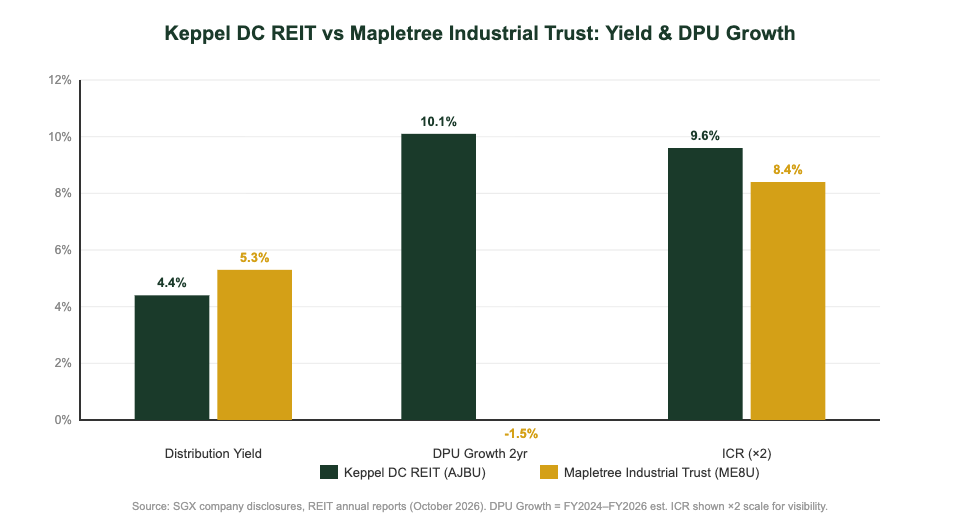
On a pure yield basis, Mapletree Industrial Trust has the edge — ME8U’s ~5.3% distribution yield is meaningfully higher than KDC’s ~4.4%. For a Singapore investor with a S$100,000 position, this translates to approximately S$5,300 per year from MIT versus S$4,400 from KDC — a difference of S$900 annually.
However, yield alone does not tell the full story. What matters is DPU growth sustainability. Keppel DC REIT has delivered consistent DPU growth since its 2014 IPO, supported by near-100% occupancy at most sites and long-term triple-net leases with built-in rent escalations (typically CPI-linked or 2–3% annual step-ups). As AI workload demand has driven unprecedented colocation pricing power since 2023, KDC’s rental reversions upon lease expiry have averaged +15–20%, supporting DPU growth even without acquisitions.
MIT, by contrast, has faced headwinds from its Singapore industrial segment — vacancy at flatted factories and softer demand for business parks have partially offset strong US data centre performance. Its FY2026 DPU of ~12.2 Singapore cents was roughly flat versus FY2025, whereas KDC’s ~9.6 cents represents approximately 4–5% year-on-year growth — a significant outperformance on the growth dimension.
| DPU Metric | Keppel DC REIT (AJBU) | Mapletree Industrial Trust (ME8U) |
|---|---|---|
| FY2024 DPU (S¢) | 8.72¢ | 12.38¢ |
| FY2025 DPU (S¢) | 9.15¢ | 12.18¢ |
| FY2026 DPU est. (S¢) | ~9.6¢ | ~12.2¢ |
| DPU Growth (FY24–26 est.) | +10.1% | −1.5% |
| Distribution Frequency | Semi-annual | Quarterly |
| Yield on Cost (IPO: S$0.93) | ~10.3% | ~13.1% |
Source: SGX company filings, REIT financial statements. FY2026 figures are estimates based on Q1–Q3 results.
MIT’s quarterly distribution cadence (versus KDC’s semi-annual) can be attractive for income investors who prefer more frequent cash flow. For investors building a passive income portfolio in Singapore, receiving distributions four times a year from MIT helps with cash flow management across quarterly living expenses.
3. Portfolio Quality & Geographic Diversification
Keppel DC REIT’s 100% data centre focus is both its greatest strength and a source of concentration risk. All 23 assets are mission-critical digital infrastructure facilities — purpose-built data centres with average occupancy above 98% and WALE (weighted average lease expiry) of approximately 7.4 years. The portfolio spans Europe (Germany, Netherlands, UK, Ireland, Italy) which provides geographic diversification, though it also introduces EUR/GBP foreign exchange exposure that can dampen SGD-denominated DPU in periods of SGD strength.
Mapletree Industrial Trust’s Singapore industrial segment (flatted factories, hi-tech buildings, stack-up factories, business parks) provides SGD-denominated income stability. Its data centres are concentrated in the United States — primarily across Virginia (the world’s largest data centre market), Texas, and California — giving it superior US AI cloud demand exposure. The US data centre segment now generates over 60% of MIT’s gross revenue, making it de facto a North American data centre REIT listed in Singapore.
From a tenant perspective, KDC’s top tenants include the four largest hyperscalers globally (Amazon Web Services, Microsoft Azure, Alibaba Cloud, Google Cloud), providing exceptional income visibility with typical lease terms of 8–15 years. MIT’s US assets serve a mix of hyperscalers and enterprise colocation tenants, while its Singapore segment has a more fragmented SME and MNC tenant base with shorter average lease terms of 3–5 years.
For Singapore investors seeking the best S-REITs in 2026, both KDC and MIT represent the highest-quality data centre options on the SGX. The key distinction is that KDC offers purer exposure while MIT provides a diversified industrial-plus-data-centre blend that may suit more risk-averse investors who value income floor protection from the Singapore industrial segment.
4. Gearing & Balance Sheet Strength
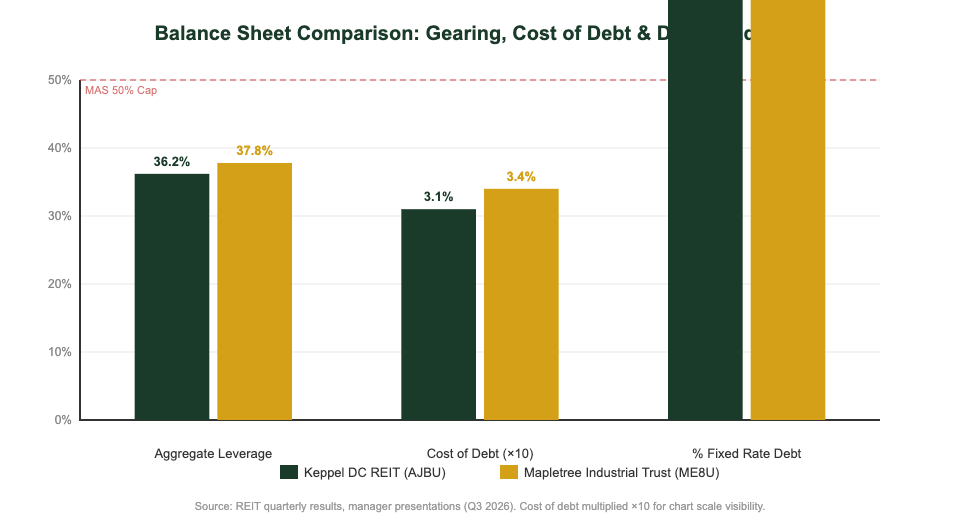
MAS regulations cap S-REIT aggregate leverage at 50% (or 55% if ICR exceeds 2.5x). Both KDC and MIT are well within limits, but the balance sheet comparison is instructive for investors assessing acquisition capacity and DPU safety.
Keppel DC REIT’s gearing stands at approximately 36.2% as at Q3 2026, leaving approximately S$460 million in debt headroom before reaching its internal 40% target and over S$1 billion before the regulatory 50% cap. This gives KDC considerable acquisition capacity without equity fundraising. Its weighted average debt maturity is approximately 3.2 years with a blended cost of debt around 3.1% — benefiting from fixed-rate hedging (approximately 82% of debt on fixed rates).
MIT’s aggregate leverage is slightly higher at approximately 37.8% as at Q2 FY2027 (MIT’s financial year ends March). Its cost of debt is approximately 3.4% — slightly higher than KDC’s given its larger proportion of USD-denominated borrowings in the US data centre segment. With gearing approaching the higher end of its comfort zone, any large-scale US acquisition by MIT would likely require an equity raise, which could be dilutive to existing unitholders’ DPU.
| Balance Sheet Metric | Keppel DC REIT (AJBU) | Mapletree Industrial Trust (ME8U) |
|---|---|---|
| Aggregate Leverage | ~36.2% | ~37.8% |
| Cost of Debt (blended) | ~3.1% | ~3.4% |
| % Fixed Rate Debt | ~82% | ~77% |
| ICR (Interest Coverage Ratio) | ~4.8x | ~4.2x |
| Debt Headroom to 45% cap | ~S$460M | ~S$320M |
| Weighted Avg. Debt Maturity | ~3.2 years | ~3.6 years |
Source: REIT quarterly results, manager presentations (Q3 2026 / Q2 FY2027). Estimates based on latest disclosed figures.
KDC holds a marginal balance sheet edge — lower gearing, lower cost of debt, and a higher ICR all translate to greater financial flexibility and DPU safety cushion. For Singapore investors comparing risk profiles within a broader fixed income strategy, consider our guides on Singapore Savings Bonds and Singapore T-bills 2026 as lower-risk income alternatives.
5. Valuation: P/NAV & Price Upside
Price-to-NAV (net asset value) is the primary valuation metric for S-REITs. A P/NAV above 1.0x means investors are paying a premium to book value; below 1.0x implies a discount, which may signal undervaluation or concerns about asset quality.
Keppel DC REIT trades at approximately 1.05x P/NAV — a slight premium reflecting the market’s willingness to pay up for pure-play data centre exposure and KDC’s superior DPU growth track record. At its peak in 2022, KDC traded above 2.5x P/NAV; the compression to ~1.05x represents a significant valuation reset that many analysts view as an attractive long-term entry point. With NAV per unit of approximately S$2.10 and a unit price of ~S$2.20, the premium to book is modest by historical standards.
Mapletree Industrial Trust trades closer to 1.0x P/NAV — roughly at fair value — with some compression in the Singapore industrial component offsetting premium valuations for its US data centre assets. The blended P/NAV reflects investor uncertainty about the drag from flatted factories and business parks on the overall NAV trajectory as demand for these assets remains structurally softer than data centres.
On a forward distribution yield basis, MIT’s ~5.3% yield is approximately 90–120 basis points above KDC’s ~4.4%. This yield gap has historically been closer to 50–80bps; the wider current spread suggests either MIT is undervalued, KDC is overvalued, or the market is pricing in higher long-term DPU growth for KDC — which the DPU track record in Section 2 supports.
Investors building towards retirement planning goals in Singapore should note that both REITs qualify for the CPF Investment Scheme (CPFIS), allowing OA funds to be deployed with potential tax-free compounding. For details, see our guide on CPF investment strategy.
6. Key Risks for Each REIT
Keppel DC REIT risks:
- Tenant concentration: KDC’s top 5 tenants account for approximately 55% of gross revenue. Loss of any single hyperscaler tenant (however unlikely given multi-year contracts) would be highly disruptive to DPU.
- European FX exposure: With ~40% of assets in Europe, EUR and GBP weakness versus SGD can materially reduce SGD DPU. In FY2023, FX headwinds trimmed KDC’s DPU by approximately 0.4 Singapore cents.
- Data centre power constraints: Securing power capacity for new data centres in Singapore and Europe faces increasing regulatory scrutiny. KDC’s Singapore pipeline may be constrained by EMA power quotas.
- Premium valuation risk: At 1.05x P/NAV, KDC has less valuation cushion than MIT. A broader S-REIT selloff driven by rising interest rates could see further P/NAV compression.
Mapletree Industrial Trust risks:
- Singapore industrial vacancy: Flatted factories and business parks face structural headwinds from Singapore’s shift to higher-value manufacturing. Any economic slowdown could push vacancy rates higher and weigh on DPU.
- USD/SGD FX risk: With 60%+ revenue in USD, a significant SGD appreciation against USD would reduce DPU in SGD terms. MIT partially hedges this with USD-denominated debt, but residual exposure remains significant.
- US data centre supply risk: MIT’s concentration in Virginia — a market now facing power and cooling bottlenecks — could constrain expansion optionality compared to more geographically diversified data centre owners.
- Rights issue risk: With gearing above 37%, any transformative US acquisition would likely trigger an equity raise that could dilute existing unitholders — a risk absent from KDC’s current balance sheet position.
7. Verdict: Which Should You Buy?
The right choice depends on your investment priorities:
Choose Keppel DC REIT (AJBU) if you prioritise:
- DPU growth over current yield — KDC’s +10% two-year DPU growth is among the best in the S-REIT universe
- Pure-play data centre exposure with no legacy industrial drag
- A stronger balance sheet with lower gearing (~36.2%) and higher ICR (~4.8x)
- Long WALE (7.4 years) providing exceptional earnings visibility through 2030+
Choose Mapletree Industrial Trust (ME8U) if you prioritise:
- Higher current yield (~5.3% vs ~4.4%) for immediate income generation
- Quarterly distributions for more frequent cash flow
- Greater US data centre market exposure (Virginia, Texas, California)
- Lower valuation risk — trading closer to book value (1.0x P/NAV vs 1.05x)
The case for holding both: Many Singapore investors hold both KDC and MIT as complementary data centre REIT positions — KDC for DPU growth visibility and MIT for higher current yield and quarterly distributions. With a combined weighting in a diversified S-REIT portfolio, they provide broad digital infrastructure exposure across Asia, Europe, and North America without doubling up on the same assets or the same risk profile.
Both REITs are available through major Singapore brokers. For cost-effective access, our guides to Syfe referral code and sign-up bonus and FSMOne referral code cover two of the most popular low-cost platforms for S-REIT investing. CPFIS investors can also access both via the Endowus referral code platform.
8. Frequently Asked Questions
Is Keppel DC REIT a good buy in 2026?
Is Mapletree Industrial Trust a data centre REIT?
Which S-REIT has the best data centre exposure in Singapore?
Can Singapore investors buy Keppel DC REIT using CPF?
What is Keppel DC REIT's estimated DPU for FY2026?
How does MIT's dividend compare to Keppel DC REIT's?
This article was researched with the help of AI. While we strive to keep all information accurate and up to date, there may be errors. If you notice any discrepancies, please contact us.