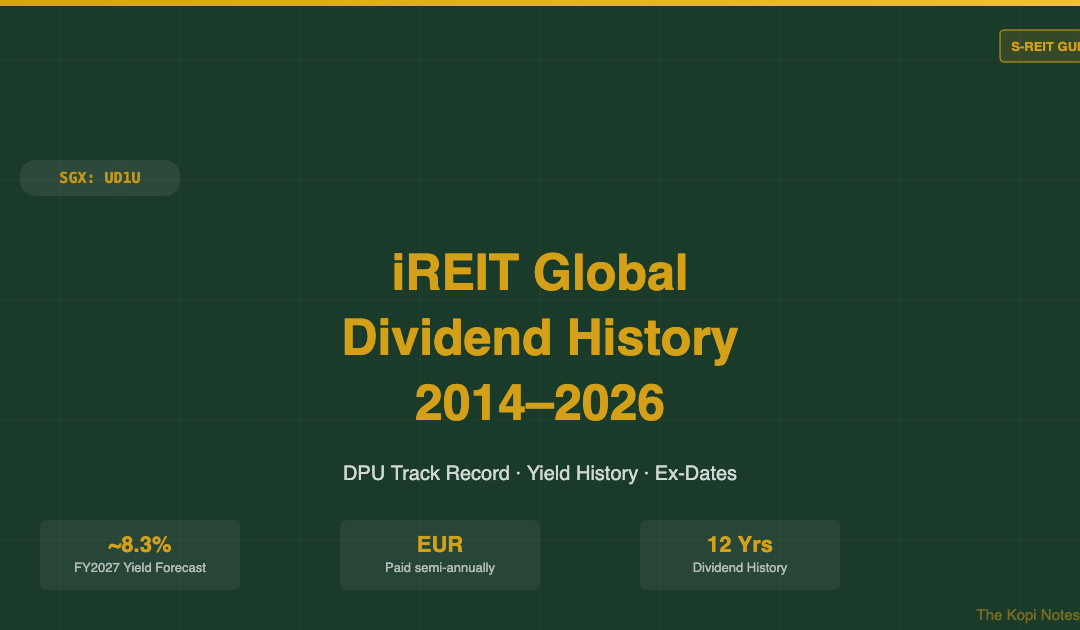
iREIT Global Dividend History 2014–2026: DPU Track Record, Yield & Ex-Dates (SGX: UD1U)
iREIT Global (SGX: UD1U) is Singapore’s only pure-play European office REIT, listed on SGX Mainboard in June 2014. It pays semi-annual distributions in EUR, converted to SGD at the payment date. This article covers the complete iREIT Global dividend history from 2015 to 2026, including DPU trends, distribution yield data, ex-dividend dates, and what the ECB rate cycle means for future payouts.
Not financial advice. All figures are approximate and for educational reference only. Data as at November 2026 unless noted. Always verify with iREIT Global’s official investor relations.
What Is iREIT Global?
iREIT Global Management Pte Ltd launched iREIT Global on SGX Mainboard on 13 June 2014, making it Singapore’s only REIT with a portfolio focused entirely on European office and commercial real estate. As of 2026, its portfolio spans Germany, the Netherlands, France, and Spain, with key assets including office campuses in Munich, Berlin, Darmstadt, and Amsterdam.
Unlike most S-REITs in Singapore which pay DPU in SGD, iREIT Global’s income is earned and declared in EUR. Singapore investors receive SGD after currency conversion at the prevailing EUR/SGD rate on each payment date — which adds a layer of foreign exchange variability that domestic REITs don’t have.
The REIT’s key features at a glance:
- SGX Ticker: UD1U
- Listing date: 13 June 2014
- Distribution frequency: Semi-annual (interim + final)
- Distribution currency: EUR (paid in SGD equivalent)
- Gearing (2026): approximately 44–46%
- Asset focus: European office, logistics, and commercial properties
iREIT Global’s DPU is closely tied to European interest rates. When the ECB kept rates near zero from 2015–2021, the REIT’s interest costs were low and DPU held relatively steady. The sharp ECB rate hiking cycle from 2022 to 2023 — taking the deposit rate from -0.5% to 4.0% — dramatically increased refinancing costs and compressed distributions. With the ECB cutting rates from late 2024 into 2026, analysts expect a gradual DPU recovery, as explored in our iREIT Global FY2027 DPU forecast.
iREIT Global DPU History 2015–2026
The table below shows iREIT Global’s approximate annual distribution per unit (DPU) from FY2015 to the latest available period. Because DPU is declared in EUR, we also include an estimated SGD equivalent using the prevailing EUR/SGD rate at the time of each payment.
| Financial Year | 1H DPU (EUR¢) | 2H DPU (EUR¢) | Full-Year DPU (EUR¢) | SGD Equiv. (approx.) | YoY Change |
|---|---|---|---|---|---|
| FY2015 | 1.00¢ | 1.00¢ | 2.00¢ | ~2.95¢ | — |
| FY2016 | 1.00¢ | 1.00¢ | 2.00¢ | ~3.05¢ | Flat |
| FY2017 | 0.95¢ | 0.95¢ | 1.90¢ | ~3.00¢ | -5.0% |
| FY2018 | 0.93¢ | 0.92¢ | 1.85¢ | ~2.95¢ | -2.6% |
| FY2019 | 0.93¢ | 0.92¢ | 1.85¢ | ~2.80¢ | Flat |
| FY2020 | 0.83¢ | 0.82¢ | 1.65¢ | ~2.65¢ | -10.8% |
| FY2021 | 0.80¢ | 0.80¢ | 1.60¢ | ~2.42¢ | -3.0% |
| FY2022 | 0.72¢ | 0.68¢ | 1.40¢ | ~2.05¢ | -12.5% |
| FY2023 | 0.63¢ | 0.57¢ | 1.20¢ | ~1.74¢ | -14.3% |
| FY2024 | 0.52¢ | 0.48¢ | 1.00¢ | ~1.46¢ | -16.7% |
| FY2025 (est.) | ~0.44¢ | ~0.41¢ | ~0.85¢* | ~1.26¢* | ~-15%* |
| 1H2026 | 0.37¢ | — | 0.37¢ (H1 only) | ~0.54¢ | -48% YoY (H1) |
Source: iREIT Global investor relations, SGX filings. Figures are approximate; *FY2025 and 2026 are estimated. SGD equivalent uses prevailing EUR/SGD rate at time of payment. Always verify with the official iREIT Global distributions page.
The key takeaway from this 12-year track record: iREIT Global sustained DPU above EUR 1.60¢ from listing through 2021, then entered a sharp downtrend as ECB rate hikes cascaded through its floating-rate debt. The 1H2026 DPU of EUR 0.37¢ — down 48% year-on-year — reflects this pressure, though ECB rate cuts from late 2024 onwards are expected to ease the burden progressively.
Annual DPU Bar Chart (EUR Cents per Unit)
The bar chart below visualises iREIT Global’s annual DPU trend from FY2015 through the latest period. The declining trajectory since FY2022 is clear — driven by rising European interest rates increasing the cost of the REIT’s debt, which is predominantly floating-rate.
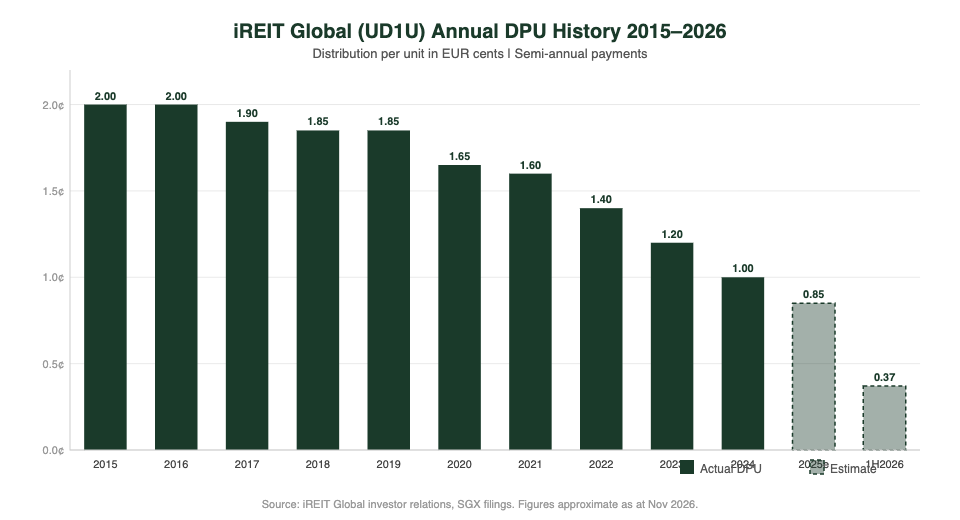
Looking at the data: DPU peaked at EUR 2.00¢ in FY2015–2016 when European rates were at historic lows, then drifted slightly lower through 2019. COVID-19 caused a sharper dip in FY2020 as some tenants sought rent deferrals, but the real compression came post-2022 when the ECB hiked rates aggressively to combat inflation. For Singapore investors considering iREIT Global as a passive income play, the trajectory illustrates the importance of monitoring European macro conditions.
As a hypothetical example: a Singapore investor who held 50,000 iREIT Global units in FY2019 would have received approximately EUR 925 (or roughly SGD 1,400) in annual distributions. By FY2024, the same holding would yield approximately EUR 500 (roughly SGD 730) — a ~46% drop in DPU income despite the same number of units held.
EUR/SGD FX Impact on Singapore Investors
Because iREIT Global declares and pays distributions in EUR, the SGD amount a Singapore investor receives depends on two variables: the DPU in EUR and the EUR/SGD exchange rate at the payment date. This currency risk is unique to iREIT Global among S-REITs.
EUR/SGD has ranged from approximately 1.44 to 1.68 over the REIT’s listing history. When EUR strengthens against SGD, Singapore investors receive more SGD per EUR of DPU — and vice versa. The table below shows how the same EUR DPU translates into different SGD amounts depending on the exchange rate:
| DPU (EUR¢) | EUR/SGD = 1.44 | EUR/SGD = 1.52 (mid) | EUR/SGD = 1.60 | EUR/SGD = 1.68 |
|---|---|---|---|---|
| 2.00¢ (FY2016 level) | 2.88¢ SGD | 3.04¢ SGD | 3.20¢ SGD | 3.36¢ SGD |
| 1.40¢ (FY2022 level) | 2.02¢ SGD | 2.13¢ SGD | 2.24¢ SGD | 2.35¢ SGD |
| 1.00¢ (FY2024 level) | 1.44¢ SGD | 1.52¢ SGD | 1.60¢ SGD | 1.68¢ SGD |
| 2.25¢ (FY2027 est.) | 3.24¢ SGD | 3.42¢ SGD | 3.60¢ SGD | 3.78¢ SGD |
Source: indicative calculations based on EUR/SGD exchange rate scenarios. Not representative of actual past payments.
The practical implication: in years when EUR weakens versus SGD (as it did in 2022 when EUR/SGD briefly dipped towards 1.44), the SGD received is lower even if the EUR DPU holds steady. Conversely, a stronger EUR amplifies the SGD payout. For Singapore investors building a retirement income from REIT distributions, this FX variability is worth factoring in alongside the DPU trend itself.
Distribution Yield History 2015–2026
Distribution yield (DPU ÷ share price) tells you how much income you receive relative to the price paid. For iREIT Global, yield has generally risen as share prices fell faster than DPU in recent years — which is paradoxically a sign of investor concern rather than income improvement.
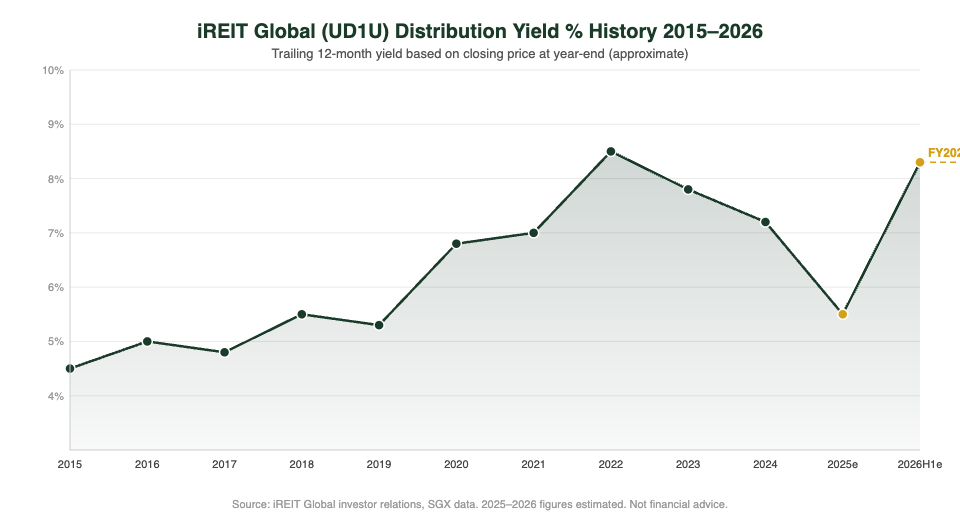
Key yield observations for investors comparing iREIT Global to other S-REITs:
- FY2015–2019: Yield ranged 4.5%–5.5%, reflecting stable DPU and a share price around SGD 0.33–0.40. This was the “sweet spot” era when European rates were low and office occupancy was high.
- FY2020–2021: Yield climbed to 6.5–7.0% as COVID hit office occupancy and share prices dipped, even though DPU only fell modestly. Long WALEs (weighted average lease expiry) of 5–7 years meant rental income held up.
- FY2022–2023: Yield spiked to 7.5–8.5% — but this masked a painful underlying reality. Both DPU and share price fell, but share price fell faster. Investors who bought on yield alone without understanding the rate headwinds faced capital losses.
- FY2027 target yield: With the ECB cutting rates and iREIT Global’s debt progressively refinanced at lower rates, the FY2027 DPU is forecast at EUR 2.25¢ per unit — which at prevailing prices (around SGD 0.27) translates to an approximately 8.3% yield. See our iREIT Global DPU forecast for the full base/bull/bear scenario analysis.
Compare this to the broader Singapore REIT ETF which yields around 5–6% on average in 2026. iREIT Global’s higher yield carries higher risk — specifically European rate risk, FX risk, and office sector demand risk in the post-pandemic hybrid work era.
iREIT Global Ex-Dividend Dates Calendar
iREIT Global pays distributions twice a year — an interim (1H) distribution and a final (2H) distribution. The table below shows the typical ex-dividend and payment date schedule. Actual dates are announced by iREIT Global management and may vary by a few weeks each year.
| Distribution | Results Period | Typical Ex-Date | Typical Payment Date | Notes |
|---|---|---|---|---|
| Interim (1H) | Jan–Jun | Aug–Sep | Sep–Oct | Declared with 1H results |
| Final (2H) | Jul–Dec | Feb–Mar | Mar–Apr | Declared with full-year results |
Source: iREIT Global annual reports and SGX filings. Exact dates vary year to year.
Important: To qualify for a distribution, you must hold iREIT Global units before the ex-dividend date. If you buy on or after the ex-date, you will NOT receive that distribution. Always check the official SGX announcement or iREIT Global’s investor relations page for exact dates each period.
Where to Buy iREIT Global in Singapore
iREIT Global (UD1U) is listed on SGX Mainboard and can be purchased through any SGX-connected brokerage. For Singapore retail investors, here are the platforms most commonly used:
moomoo Singapore — competitive SGX trading commissions with a user-friendly mobile interface. See current promotions via the moomoo referral code page.
FSMOne — a popular choice for investors who want to hold S-REITs alongside unit trusts and bonds in one account. Check the latest sign-up bonuses via the FSMOne referral code page.
Endowus — if you prefer a managed, hands-off approach using CPF or SRS funds to invest in REIT portfolios. See the Endowus referral code for onboarding promotions.
For standard brokerage fees as at Q4 2026, most SGX-connected platforms charge 0.08%–0.18% per trade (minimum SGD 2–10). Fees are verified on each platform’s published fee schedule. This article does not rank brokers — the best choice depends on your overall portfolio, cash management needs, and preferred trading interface.
Frequently Asked Questions
How often does iREIT Global pay dividends?
Is iREIT Global’s dividend paid in SGD or EUR?
Why has iREIT Global’s DPU been falling since 2022?
What is the forecast DPU for iREIT Global in FY2027?
How do I find iREIT Global’s ex-dividend dates?
Can I use CPF to invest in iREIT Global?
This article was researched with the help of AI. While we strive to keep all information accurate and up to date, there may be errors. If you notice any discrepancies, please contact us.