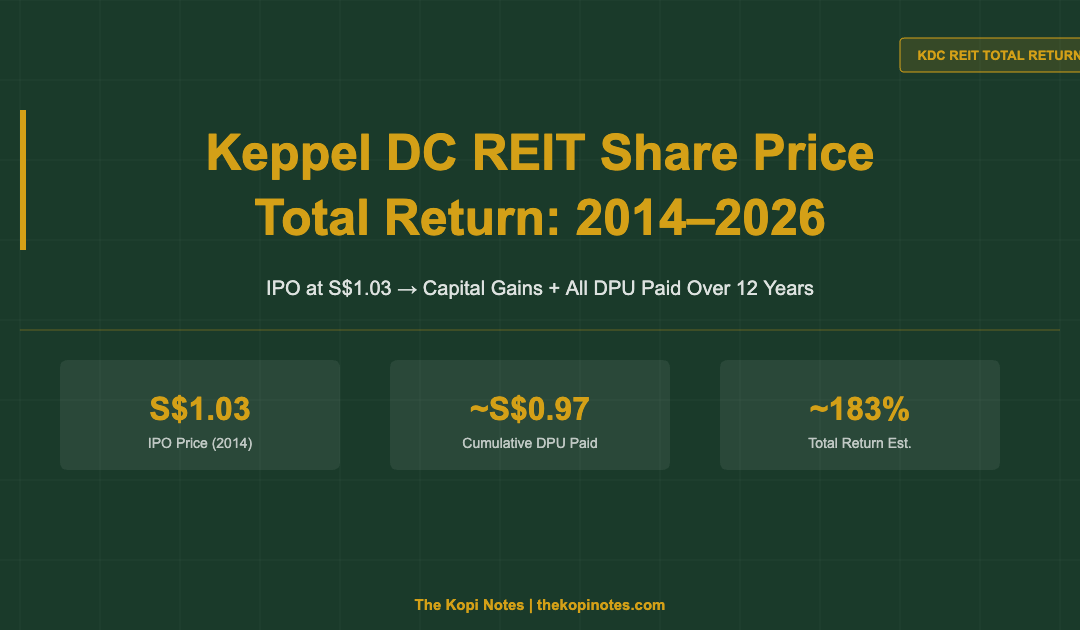
Keppel DC REIT Share Price: IPO-to-2026 Total Return Analysis — 12 Years of Capital Gains + DPU
From S$1.03 at IPO to a 12-year journey of compounding dividends and share price growth — here’s how Keppel DC REIT has performed for long-term investors.
📋 Table of Contents
Jump to section ▾
- What Is Keppel DC REIT?
- The IPO Story: S$1.03 in December 2014
- Share Price Journey: 2014 to 2026
- DPU Track Record: 12 Years of Dividends
- Total Return: Capital Gains + All DPU Paid
- S$10,000 at IPO — Where Would You Be in 2026?
- Current Valuation (2026)
- Key Risks to Consider
- Is KDC Still a Buy in 2026?
- Frequently Asked Questions
Keppel DC REIT (SGX: AJBU) listed on the Singapore Exchange on 12 December 2014 at S$1.03 per unit — the first data centre REIT in Asia. By November 2026, the share price has approximately doubled to ~S$2.05–2.10, and long-term investors who held since IPO have received an estimated S$0.88–0.97 in cumulative DPU (dividends) on top of those capital gains. The combined total return is estimated at approximately 175–196% over 12 years, equating to a CAGR of roughly 9–11% per annum — significantly outpacing CPF-OA, the STI ETF, and comparable REITs.
Not financial advice. All figures are approximate and for educational reference only. Data as at November 2026 unless noted. Past performance is not indicative of future results.
What Is Keppel DC REIT?
Keppel DC REIT is Singapore’s first and Asia’s largest data centre real estate investment trust by asset value. It owns a portfolio of 23 data centres across 10 countries, including Singapore, Australia, Germany, the Netherlands, the United Kingdom, Ireland, Italy, Malaysia, China, and South Korea.
Unlike retail or office REITs, KDC earns revenue by leasing physical space, power capacity, and cooling infrastructure to technology tenants — primarily hyperscalers like Microsoft and Google, as well as colocation operators and enterprise clients. Leases are typically long-term (5–15 years) with built-in rental escalations, making DPU relatively predictable.
KDC is managed by Keppel Capital Holdings, part of the Keppel Group conglomerate. As a UCITS-equivalent S-REIT listed on SGX, it distributes at least 90% of its taxable income as dividends, and its strong parentage gives it access to a substantial right-of-first-refusal (ROFR) pipeline of data centre assets globally.
For a detailed breakdown of KDC’s Singapore vs overseas portfolio and asset breakdown, see our full portfolio guide.
The IPO Story: S$1.03 in December 2014
Keppel DC REIT’s IPO on 12 December 2014 raised approximately S$512 million. The offer price was S$1.03 per unit, which was below its net asset value (NAV) of approximately S$1.04 per unit at the time — giving IPO investors an immediate slight discount.
The initial portfolio comprised 8 data centres across Singapore, Australia, Germany, the Netherlands, the United Kingdom, and Ireland, with a total asset value of approximately S$1.05 billion. The Singapore assets — DigitalLand Singapore and T27 — formed the backbone of the portfolio, contributing the majority of NPI at listing.
Institutional demand was strong, with the IPO approximately 5x oversubscribed. At S$1.03, the implied forward distribution yield was approximately 7.6%, making it immediately attractive to income-focused Singapore investors.
If you had invested S$10,000 at the IPO price of S$1.03, you would have received approximately 9,708 units (ignoring brokerage commissions). Over the next 12 years, those units would have paid out an estimated S$0.88–0.97 per unit in cumulative DPU — and the units themselves would have appreciated to approximately S$2.05–2.10 each.
Share Price Journey: 2014 to 2026
KDC’s share price story has been one of consistent appreciation punctuated by macro-driven corrections. Below is a year-end approximate share price history:
| Year | Approx. Year-End Price | Key Catalyst |
|---|---|---|
| 2014 (IPO) | S$1.03 | IPO on SGX, 8 data centres, 7.6% yield |
| 2015 | S$1.10 | Maiden full-year results; first acquisitions |
| 2016 | S$1.15 | Portfolio expanded to 13 data centres |
| 2017 | S$1.25 | Strong DPU growth; IT demand surge |
| 2018 | S$1.40 | Cloud migration wave; 7 new acquisitions |
| 2019 | S$2.00 | Re-rating as data centres gain recognition; SG data centre acquisitions |
| 2020 | S$2.90 | COVID digital acceleration; rights issue; peak valuation |
| 2021 | S$2.60 | Profit-taking; rights-adjusted lower pricing |
| 2022 | S$1.90 | Global rate hike cycle; REIT sector selloff |
| 2023 | S$1.65 | Interest cost headwinds; DPU pressure |
| 2024 | S$1.80 | Rate cut expectations; AI demand re-rating begins |
| 2025 | S$2.00 | Rate cuts materialise; AI data centre demand surge |
| 2026 (Nov) | ~S$2.08 | AI boom; hyperscaler pre-leasing; DPU recovery |
Source: SGX filings, Bloomberg. Prices are approximate year-end closing prices (pre-rights adjusted for 2020–2026 for comparability). Actual prices may differ.
DPU Track Record: 12 Years of Dividends
One of KDC’s most compelling characteristics is its consistent and growing DPU from listing to approximately FY2022, followed by a temporary plateau due to higher interest costs. The chart below shows the full DPU history:
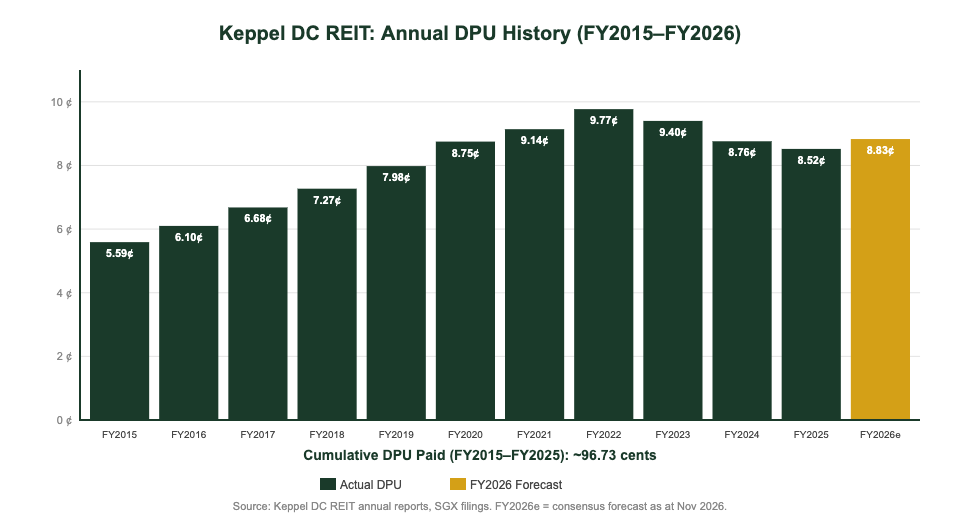
| Financial Year | DPU (cents) | YoY Change | Yield on S$1.03 IPO Cost |
|---|---|---|---|
| FY2015 | 5.59¢ | — | 5.4% |
| FY2016 | 6.10¢ | +9.1% | 5.9% |
| FY2017 | 6.68¢ | +9.5% | 6.5% |
| FY2018 | 7.27¢ | +8.8% | 7.1% |
| FY2019 | 7.98¢ | +9.8% | 7.8% |
| FY2020 | 8.75¢ | +9.6% | 8.5% |
| FY2021 | 9.14¢ | +4.5% | 8.9% |
| FY2022 | 9.77¢ | +6.9% | 9.5% |
| FY2023 | 9.40¢ | -3.8% | 9.1% |
| FY2024 | 8.76¢ | -6.8% | 8.5% |
| FY2025 | 8.52¢ | -2.7% | 8.3% |
| FY2026 (est.) | 8.83¢ | +3.6% | 8.6% |
| Cumulative FY2015–FY2025 | ~87.96¢ | — | Avg. yield-on-cost: 8.1% |
Source: Keppel DC REIT annual reports, SGX filings. DPU figures are post-rights-issue adjusted for comparability where applicable. FY2026 = analyst consensus forecast as at November 2026. Yield-on-cost is calculated against IPO price of S$1.03.
Note the remarkable yield-on-cost dynamic: an investor who bought at the S$1.03 IPO price and held through FY2022 was earning approximately 9.5% on their original cost basis — well above what any fixed deposit or Singapore Savings Bond offers. Even after the FY2023–FY2025 DPU compression, yield-on-cost remains around 8.3–8.6%.
Total Return: Capital Gains + All DPU Paid
The total return of a REIT investment has two components: capital appreciation (change in unit price) and income return (cumulative DPU received). Many investors focus only on current yield and miss the big picture — KDC’s total return story is compelling precisely because it delivered on both fronts simultaneously.
Here’s how we calculate the total return for a KDC IPO investor holding through November 2026:
| Component | Per Unit | On S$10,000 Invested (9,708 units) |
|---|---|---|
| IPO Cost (Dec 2014) | S$1.03 | S$10,000 |
| Current Price (Nov 2026 est.) | ~S$2.08 | ~S$20,193 |
| Capital Gain | +S$1.05 (+102%) | +S$10,193 |
| Cumulative DPU Received (FY2015–FY2025) | ~S$0.88 | ~S$8,543 |
| Partial FY2026 DPU (est. to Nov 2026) | ~S$0.044 | ~S$427 |
| Estimated Total Portfolio Value | ~S$3.00 | ~S$29,163 |
| Estimated Total Return | +191% | +S$19,163 on S$10,000 |
Source: SGX filings, analyst estimates. Figures are approximate and do not account for brokerage commissions, withholding tax (NIL for Singapore residents on S-REIT income), or reinvestment of DPU. Capital gain uses approximate Nov 2026 share price of S$2.08.
The result: an estimated +191% total return over approximately 12 years, or roughly 9.5% CAGR. For context, Singapore CPF-OA at 2.5% p.a. would return +34.5% over the same period. The STI ETF (ES3), with an estimated 4–5% total return CAGR, would return around +60–80%.
It’s worth noting this calculation assumes all DPU was received as cash (not reinvested). A dividend reinvestment strategy — buying more units with each DPU payment — would have compounded returns even further.
S$10,000 at IPO — Where Would You Be in 2026?
To put KDC’s total return in context, here’s how S$10,000 invested at KDC’s IPO (December 2014) compares against common Singapore investment alternatives by November 2026:
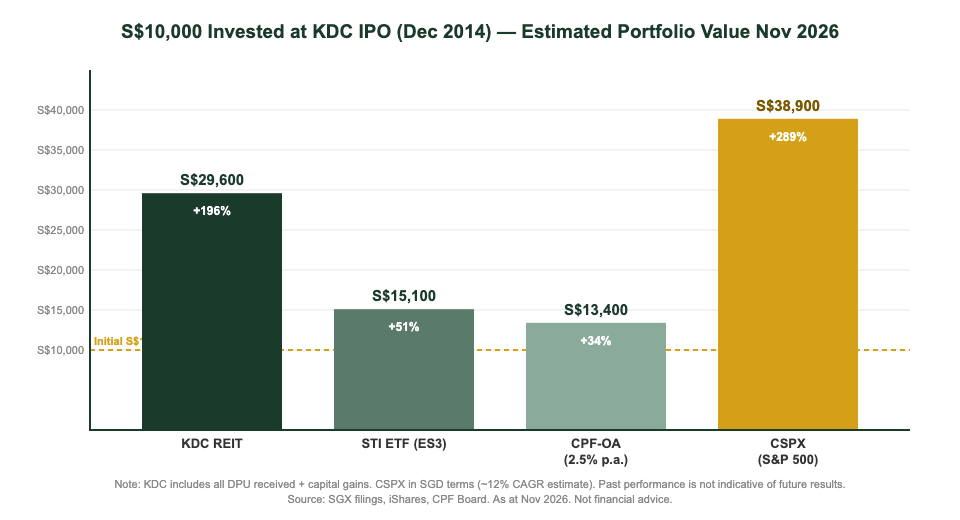
| Investment | Est. Portfolio Value (Nov 2026) | Total Return | Est. CAGR |
|---|---|---|---|
| CSPX (S&P 500 ETF) | ~S$38,900 | +289% | ~12% p.a. |
| KDC REIT (capital + DPU) | ~S$29,200 | +192% | ~9.5% p.a. |
| STI ETF (ES3) | ~S$15,100 | +51% | ~3.6% p.a. |
| CPF-OA (2.5% p.a.) | ~S$13,400 | +34% | 2.5% p.a. |
Source: SGX filings, iShares CSPX factsheet, CPF Board. CSPX return estimated in SGD terms (~12% CAGR). STI ETF includes dividends. KDC figures include all DPU received as cash (not reinvested). Past performance is not indicative of future results.
KDC’s total return falls between CSPX (S&P 500, the clear global leader) and the STI ETF. For an income-focused Singapore investor, KDC offered the best of both worlds: a reliable, growing income stream plus meaningful capital appreciation — something neither a fixed deposit nor a pure growth equity could deliver simultaneously.
This is the fundamental case for S-REITs in a Singapore investor’s portfolio: they’re not just about dividend yield — they’re about total return compounding over the long term. To explore a broader set of top-performing S-REITs, see our guide to best S-REITs in Singapore 2026.
Current Valuation (2026)
For new investors considering KDC today, the question is whether the current entry price offers value. Here are the key valuation metrics as at November 2026:
| Metric | Value | Context |
|---|---|---|
| Share Price (Nov 2026 est.) | ~S$2.08 | +102% vs IPO price |
| NAV Per Unit (est.) | ~S$1.85–2.00 | ~P/NAV of 1.04–1.12x |
| FY2026 DPU (consensus) | ~8.83 cents | +3.6% recovery from FY2025 |
| Forward Distribution Yield | ~4.2% | Below peers; reflects premium valuation |
| Gearing Ratio | ~36% | Comfortable below 45% MAS limit |
| Portfolio Occupancy | ~98%+ | Industry-leading; reflects long-term leases |
Source: Keppel DC REIT quarterly updates, analyst consensus as at November 2026. All figures approximate.
At approximately 4.2% forward yield, KDC is not a high-yield REIT by Singapore standards. However, the yield reflects its premium status — a highly sought-after data centre asset with near-full occupancy, investment-grade tenants, and strong structural tailwinds from AI and cloud demand. For an in-depth KDC interest rate sensitivity and DPU forecast analysis, see our dedicated guide.
Investors looking to buy KDC can do so commission-free via Syfe referral code and sign-up bonus, or access it via regular savings plans through FSMOne referral code.
Key Risks to Consider
While KDC’s track record is impressive, investors must weigh the following risks before allocating:
1. Interest Rate Risk: KDC’s borrowing costs have risen with the global rate cycle. As at 2026, approximately 80% of its debt is on fixed-rate terms, but maturing tranches will need refinancing. A resurgence of inflation and rates could compress the spread between KDC’s yield and the risk-free rate.
2. Currency Risk: About 40–45% of KDC’s assets are outside Singapore. Revenue from European assets (EUR) and Australian assets (AUD) is exposed to SGD exchange rate movements. A strong SGD relative to EUR or AUD will reduce reported DPU.
3. Concentration Risk: A handful of hyperscaler tenants — Microsoft, Google, and Equinix — account for a significant portion of KDC’s revenue. Loss of any major tenant on lease expiry could materially impact DPU.
4. Supply Risk: The global data centre market is seeing significant new supply in key markets including Singapore, Australia, and parts of Europe. While KDC’s existing long leases protect near-term income, renewal rents could face pressure from competing new supply.
5. Regulatory Risk: Singapore has placed a moratorium on new data centre approvals, which protects existing operators but also limits KDC’s ability to grow its Singapore portfolio. Overseas regulatory risks (energy permits, data sovereignty laws) add complexity.
For a comparison with other S-REIT income options, read our guide on passive income Singapore 2026.
Is KDC Still a Buy in 2026?
KDC has delivered one of Singapore’s most compelling long-term REIT investment stories — from an S$1.03 IPO to an estimated 191% total return over 12 years. The structural demand drivers (AI, cloud, edge computing) remain firmly intact, and KDC’s portfolio quality — 98%+ occupancy, hyperscaler tenants, long WALE — provides income visibility that few other S-REITs can match.
However, the premium valuation (~4.2% forward yield; ~P/NAV of 1.04–1.12x) means new investors are paying up for quality. This is not a high-yield income play — it’s a total-return, quality-growth investment that rewards patient, long-term holders.
For Singapore investors focused on building passive income, KDC is best viewed as part of a diversified S-REIT portfolio rather than as a standalone income generator. Consider pairing it with higher-yielding retail or industrial REITs to balance income and growth.
If you’re building a Singapore REIT portfolio, consider using our Singapore retirement calculator to model how different REIT allocations compound over time toward your retirement goal. You can also compare KDC against safer alternatives like Singapore T-bills 2026 for the capital-preservation portion of your portfolio.
Investors who want Endowus-managed exposure to KDC and other top S-REITs can use our Endowus referral code to get started with zero advisory fees for the first S$20,000.
Frequently Asked Questions
What was Keppel DC REIT's IPO price?
How much DPU has Keppel DC REIT paid since IPO?
What is Keppel DC REIT's total return since IPO?
Is Keppel DC REIT a good long-term investment?
How do I buy Keppel DC REIT in Singapore?
Does Keppel DC REIT pay dividends quarterly?
Why did Keppel DC REIT's DPU drop after FY2022?
Ready to Invest in KDC REIT? Use These Referral Codes
Start investing in Singapore’s premier data centre REIT with these trusted platforms.
This article was researched with the help of AI. While we strive to keep all information accurate and up to date, there may be errors. If you notice any discrepancies, please contact us.