Keppel DC REIT: Singapore vs Overseas Portfolio — Revenue Mix, Occupancy & Growth 2026
Keppel DC REIT (SGX: AJBU) operates 23 data centres across 9 countries, with Singapore remaining the largest revenue contributor at approximately 38% of net property income. The trust’s overseas portfolio — spanning Australia, the Netherlands, Germany, the UK, Ireland and Malaysia — provides diversification and growth exposure to hyperscale cloud demand. Understanding this geographic split is key to assessing DPU sustainability and long-term growth trajectory for Singapore investors.
Not financial advice. All figures are for educational reference only. Data as at H1 2026 unless noted.
Table of Contents
Table of Contents
- KDC Portfolio at a Glance
- Singapore: The Stable Core (~38% of NPI)
- Australia: Reliable Returns from Sydney and Melbourne
- Europe: Growth from Netherlands, Germany and UK
- Malaysia and Emerging Markets
- Revenue and NPI Breakdown by Geography
- Occupancy Rates Across Markets
- What the Geographic Mix Means for DPU
- Frequently Asked Questions
KDC Portfolio at a Glance
As at mid-2026, Keppel DC REIT holds 23 data centres spread across Singapore, Australia, the Netherlands, Germany, the United Kingdom, Ireland and Malaysia. Total assets under management stand at approximately S$3.9 billion, making it the largest pure-play data centre REIT listed in Singapore by market capitalisation and AUM.
The portfolio’s geographic spread reflects deliberate strategy: Singapore assets anchor the trust with long master leases and near-full occupancy, while European and Australian properties provide exposure to hyperscale cloud demand and multi-tenanted co-location revenue. This bifurcation — stable domestic core plus growth-oriented overseas assets — is the key structural feature investors should understand when modelling future DPU.
For Singapore investors seeking exposure to the best S-REITs in Singapore 2026, KDC’s geographic mix represents a differentiated proposition: the safety of Singapore’s regulated land market combined with the growth upside of European hyperscale co-location demand.
KDC Portfolio Summary (H1 2026)
| Country | Properties | Approx. NPI Share | Occupancy | Structure |
|---|---|---|---|---|
| Singapore | 9 | ~38% | 99.7% | Master Leases |
| Australia | 4 | ~16% | 97.5% | Co-location |
| Netherlands | 3 | ~13% | 100% | Co-location |
| Germany | 2 | ~9% | 95.0% | Co-location |
| UK | 2 | ~7% | 98.0% | Co-location |
| Malaysia | 1 | ~6% | 94.8% | Master Lease |
| Others (Ireland, Italy) | 2 | ~11% | 98.5% | Co-location |
Source: Keppel DC REIT H1 2026 Financial Results. Figures are approximate and for educational reference only.
Singapore: The Stable Core (~38% of NPI)
Singapore remains Keppel DC REIT’s most important market by net property income, contributing roughly 38% of total NPI in H1 2026. The trust’s nine Singapore properties span co-location and managed hosting facilities, with Keppel DC Singapore 1 through 7 forming the backbone of this domestic portfolio. These assets are primarily held under long-dated master leases with investment-grade anchor tenants, providing contractual income visibility for 7 to 12 years.
The structural advantage of Singapore’s data centre market lies in its position as Southeast Asia’s pre-eminent digital infrastructure hub. Singapore accounts for over 70% of the region’s hyperscale data centre capacity, driven by political stability, robust submarine cable connectivity and a mature regulatory environment under the Infocomm Media Development Authority (IMDA). The government’s moratorium on new data centre builds — which ran from 2019 to 2022 — further entrenched the scarcity value of existing assets like those held by KDC, and new development approvals since 2022 have been highly selective, preserving the supply discipline.
Singapore occupancy has remained at or near 100% — specifically 99.7% as at H1 2026 — for multiple consecutive quarters. This reflects the near-impossibility of vacancy in a landlord market with capped supply and rising AI-driven cloud demand.
Why Singapore’s NPI share matters for DPU: Master leases with built-in rental escalators (typically 1–4% per annum) mean that Singapore NPI grows predictably regardless of quarterly spot demand. Even as new overseas acquisitions grow as a percentage of AUM, Singapore’s contribution provides a DPU floor. When stress-testing DPU in a downside scenario, investors can treat Singapore’s NPI as near-fixed, with variability predominantly coming from the co-location assets in Europe and Australia.
Investors comparing KDC to its peers should note this structural difference: unlike Mapletree Industrial Trust (MIT), which holds a diversified industrial portfolio alongside data centres, KDC’s Singapore exposure is almost entirely pure-play data centre, commanding premium lease rates per square foot of critical IT load.
Australia: Reliable Returns from Sydney and Melbourne
Australia accounts for approximately 16% of Keppel DC REIT’s NPI — the second-largest market after Singapore. The trust holds four properties in Sydney and Melbourne, the two largest data centre markets in Oceania, serving as regional distribution nodes for APAC cloud traffic.
Australian data centres benefit from growing cloud infrastructure demand across the Asia-Pacific region, with hyperscalers including Microsoft Azure, Amazon Web Services (AWS) and Google Cloud all expanding capacity in-country. KDC’s Australian assets are structured as co-location facilities with multiple tenants, providing greater revenue diversification compared to Singapore’s master lease model but also slightly more occupancy variability.
Occupancy across the Australian portfolio sat at 97.5% in H1 2026, marginally below Singapore’s near-100% rate but still strong by international co-location standards. The modest vacancy primarily reflects fit-out periods between tenant leases rather than structural demand weakness — a positive sign of an active tenanting market.
For Singapore investors, the Australian portfolio adds AUD/SGD currency exposure. KDC actively hedges this through rolling forward contracts, with approximately 80–85% of expected AUD income hedged 12 months forward as at H1 2026. Residual unhedged AUD movements can create quarter-to-quarter DPU variability but are generally immaterial over a 12-month horizon.
Europe: Growth from Netherlands, Germany and UK
The European portfolio — comprising 7 properties across the Netherlands, Germany, the United Kingdom and Ireland — collectively contributes approximately 36% of NPI (Netherlands ~13%, Germany ~9%, UK ~7%, Ireland ~4% approximately). This makes Europe KDC’s largest overseas region by NPI contribution and its most important growth driver.
Netherlands (3 properties, ~13% NPI, 100% occupancy): Three properties in Almere and Amsterdam make the Netherlands KDC’s largest European market. Dutch data centres serve as regional hubs for hyperscalers routing traffic between the UK, Germany and Scandinavia. The Amsterdam Internet Exchange (AMS-IX) is one of the world’s largest internet peering points, making Netherlands-based data centres structurally attractive for latency-sensitive workloads. The 100% occupancy figure as at H1 2026 reflects the acute supply tightness in Amsterdam, where power constraints have significantly limited new development.
Germany (2 properties, ~9% NPI, 95.0% occupancy): Two properties in the Frankfurt market — Europe’s largest data centre hub by total power capacity — contribute around 9% of NPI. Germany’s strong industrial and financial sector generates consistent co-location demand from banking, automotive and manufacturing firms undergoing cloud migration. The 95% occupancy rate, slightly below the portfolio average, reflects one asset where a tenant expansion is underway, with the vacant space pre-committed to an incoming hyperscaler for mid-2027 delivery.
United Kingdom (2 properties, ~7% NPI, 98.0% occupancy): Two UK properties in Bristol and the London suburbs contribute approximately 7% of NPI with 98.0% occupancy. UK data centres benefit from a mature enterprise cloud adoption cycle and strong financial-sector demand. Post-Brexit dynamics have shifted some European HQ functions to Dublin and Amsterdam, but KDC’s UK assets focus on co-location demand from domestic enterprises rather than European routing, which insulates them from Brexit-related tenant drift.
Ireland (1 property, ~4% NPI, 100% occupancy): One Dublin-based asset contributes roughly 4% of NPI at 100% occupancy. Dublin has emerged as a key EU data sovereignty hub for US technology companies, with Meta, Google and Microsoft all operating significant infrastructure in the country. Ireland’s corporate tax framework and English-speaking talent base continue to attract digital investment, underpinning long-term data centre demand.
The European portfolio’s co-location structure means European assets offer greater DPU upside in a rising demand environment — KDC can mark leases to market at renewal or backfill vacated space at higher rates — but also carry more near-term occupancy variability than Singapore’s master leases.
Malaysia and Emerging Markets
Malaysia contributes approximately 6% of NPI via one Kelang Valley data centre operating at 94.8% occupancy. The Malaysian asset is held under a master lease structure, providing income predictability similar to KDC’s Singapore properties. Malaysia provides exposure to Southeast Asia’s emerging cloud adoption curve, with growing domestic demand from banking, government digitisation and e-commerce platforms driving steady occupancy improvement year on year.
The “Others” segment — approximately 11% of NPI, including properties in Ireland (counted separately above) and Italy — provides further geographic diversification. As KDC continues to evaluate acquisition targets across APAC and Europe, this segment’s contribution is expected to grow as a share of AUM over the medium term.
Geographic diversification and DPU risk: While Singapore provides the NPI floor, KDC’s overseas assets — particularly the European co-location properties and Australia — introduce FX risk, local regulatory risk and co-location vacancy risk. The trust actively hedges EUR, AUD and GBP income streams using rolling forward contracts. Investors planning for passive income Singapore strategies built around KDC distributions should model a 3–5% downside from residual FX movements in any given year.
Revenue and NPI Breakdown by Geography
The chart below illustrates KDC’s NPI contribution by country as at H1 2026. Singapore’s 38% share is the largest single-country contribution, with Australia (16%) and Netherlands (13%) as the two largest overseas contributors. The combined overseas share of approximately 62% reflects KDC’s international growth strategy executed since 2017.
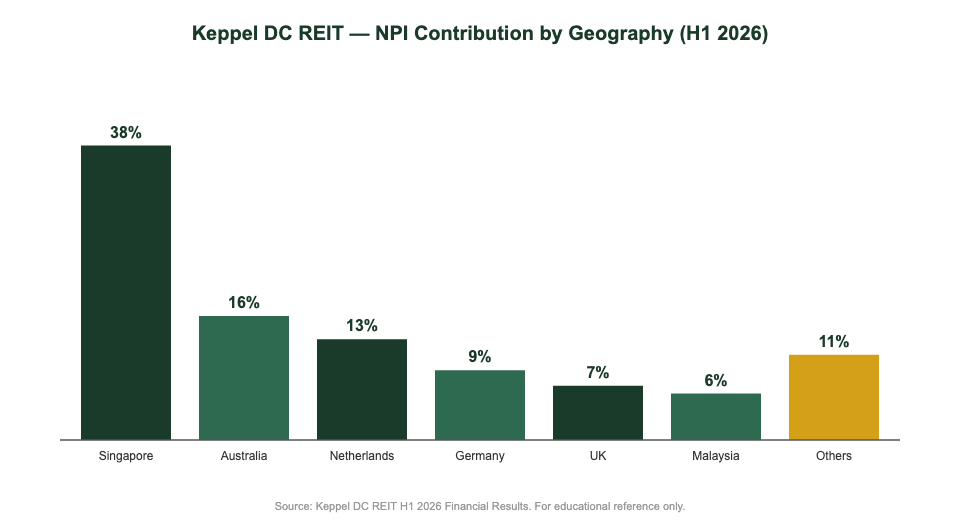
Chart: Keppel DC REIT NPI contribution by geography, H1 2026. Source: KDC financial results. For educational reference only.
An important nuance in reading the NPI breakdown: NPI margins vary substantially between markets. Singapore’s master leases deliver NPI margins of approximately 85–90% because most operating costs (utilities, maintenance, insurance) are passed through to tenants under the lease structure. European and Australian co-location assets typically generate NPI margins of 70–75%, as KDC bears more direct operating costs in those markets. This means Singapore contributes a disproportionately high share of distributable income relative to its revenue contribution.
KDC NPI Margin by Market Type (H1 2026, approximate)
| Market Type | Key Markets | NPI Margin (approx.) | Cost Structure |
|---|---|---|---|
| Master Leases | Singapore, Malaysia | 85–90% | Costs passed to tenants |
| Co-location (Tier 1) | Netherlands, Ireland | 72–78% | KDC bears utility costs |
| Co-location (General) | Germany, UK, Australia | 68–75% | Mixed pass-through |
Source: Keppel DC REIT H1 2026 financial results and management commentary. For educational reference only.
Occupancy Rates Across Markets
Across the full portfolio, KDC’s weighted average occupancy stands at approximately 98.0% in H1 2026, among the highest of any data centre REIT in Asia. High portfolio-wide occupancy reflects the structural undersupply of quality data centre space in all of KDC’s operating markets — a key differentiator versus more cyclical property sectors like retail or office REITs.
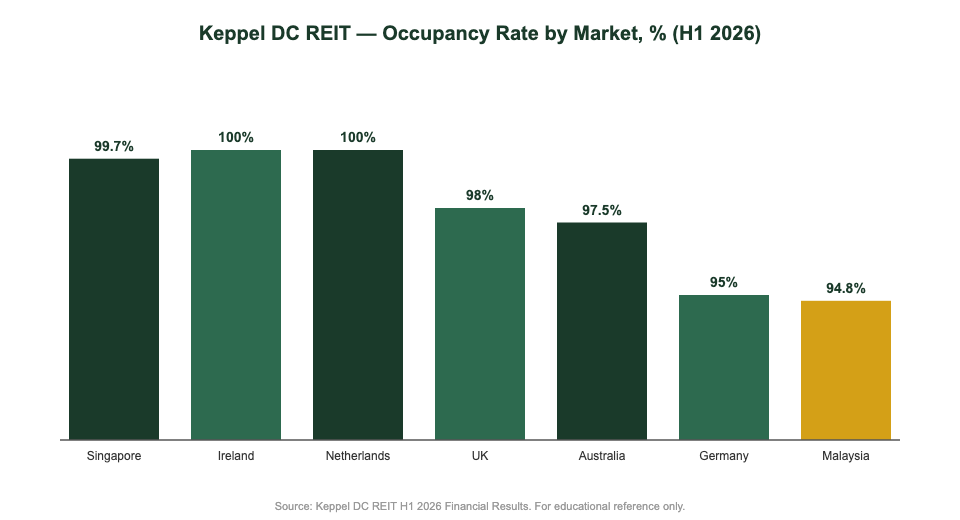
Chart: Keppel DC REIT occupancy rate by market, H1 2026. Source: KDC financial results. For educational reference only.
Ireland (100%) and Netherlands (100%) lead the portfolio on occupancy, reflecting acute supply constraints in both markets. Germany (95%) and Malaysia (94.8%) are the two markets with the most upside from occupancy improvement — and both have committed tenants in the pipeline, suggesting near-term improvement through 2026 and 2027.
Investors wishing to understand how occupancy trends flow through to DPU can refer to TKN’s Keppel DC REIT valuation analysis, which models DPU sensitivity to occupancy changes across each geographic segment. For the broader AI infrastructure theme driving hyperscaler demand, see the Singapore retirement calculator for income planning tools and our retirement resources.
What the Geographic Mix Means for DPU
For income-focused Singapore investors tracking KDC’s distributions per unit (DPU), the geographic portfolio mix has several practical implications worth modelling explicitly:
1. Singapore’s master lease structure underpins DPU stability. With built-in rental escalators of typically 1–4% per annum, Singapore NPI grows predictably regardless of quarterly spot demand. Even if a European co-location tenant vacates, Singapore’s contractual income partially offsets the impact. Historically, Singapore’s NPI contribution has been the most reliable quarter-to-quarter earnings component for KDC.
2. European and Australian growth assets drive DPU upside. As hyperscale demand intensifies in Frankfurt, Amsterdam and Sydney, KDC’s ability to backfill vacated space quickly — or expand capacity for existing tenants — drives NPI upside beyond the Singapore floor. The 100% occupancy in Netherlands and Ireland illustrates this dynamic: these markets are effectively at maximum utilisation and any new capacity would command premium rates.
3. FX hedging reduces — but does not eliminate — overseas exposure. KDC hedges its EUR, AUD and GBP income streams using rolling forward contracts. As at H1 2026, approximately 80–85% of expected overseas income is hedged for the next 12 months. Residual FX movements can create quarter-to-quarter DPU variability of up to 3–5% in an adverse scenario.
4. Gearing and interest costs matter across borders. KDC’s borrowings include both SGD and EUR-denominated debt. As global interest rates normalise from their 2022–2024 peaks, refinancing costs are trending lower — particularly in Europe where the ECB has cut rates multiple times since 2024. Each 25 basis point decline in weighted average borrowing costs is estimated to add approximately S$0.001 to S$0.002 per unit per quarter to distributable income, benefiting investors across all geographies. For investors interested in building SRS contributions alongside their REIT portfolio, consider the Syfe referral code for SRS-linked investing or FSMOne referral code for self-directed SRS accounts.
5. Acquisition growth is primarily an overseas story. KDC’s Singapore portfolio is largely constrained by land availability and government planning approvals. Future DPU accretion from acquisitions is therefore more likely to come from Europe (particularly Germany and the UK, where pricing has become more attractive following yield expansion in 2022–2023) or new APAC markets. Investors should monitor acquisition activity in these regions as the primary swing factor for medium-term DPU growth.
Frequently Asked Questions
How many data centres does Keppel DC REIT own overseas?
Is Keppel DC REIT's Singapore portfolio at risk of oversupply?
Does Keppel DC REIT pay distributions in SGD regardless of overseas income?
How does KDC's occupancy compare to peers like Mapletree Industrial Trust?
Can I invest in Keppel DC REIT using my SRS account?
What drives DPU growth for Keppel DC REIT's overseas portfolio?
Start Investing in S-REITs Today
Invest in Keppel DC REIT and other S-REITs through a trusted Singapore broker. Use a referral code to get started with a bonus.
- Syfe — Use code SRPRFFFCD for a fee waiver on your first S$30,000
- FSMOne — Use code P0544985 for SGX trade rebates
- Endowus — Use code 2V343 for S$20 off management fees
This article is for educational purposes only and does not constitute financial advice. Past distributions are not indicative of future performance. Please conduct your own due diligence before investing.
This article was researched with the help of AI. While we strive to keep all information accurate and up to date, there may be errors. If you notice any discrepancies, please contact us.