
Mapletree Industrial Trust Share Price 2026 (SGX: ME8U): Gearing Ratio, Debt Headroom & Acquisition Capacity
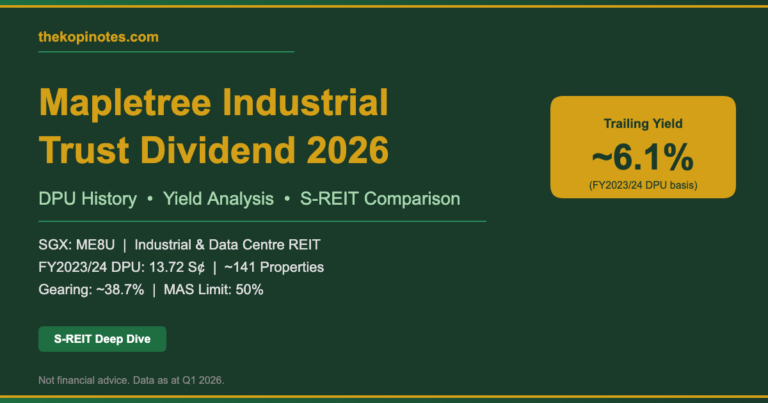
MIT carries one of the lowest gearing ratios among Singapore’s large-cap industrial and data centre REITs — sitting at approximately 36.7% as at 2Q FY2026/27, well below the MAS 50% regulatory limit. That leaves an estimated S$1.3 billion in debt headroom — capital that could fund MIT’s next wave of data centre acquisitions and drive DPU growth toward FY2027.
Published: October 2026 | Not financial advice. Always do your own due diligence.
📋 Table of Contents
- What Is MIT’s Gearing Ratio?
- MIT Gearing vs Industrial & Data Centre REIT Peers
- How Much Debt Headroom Does MIT Have?
- MIT’s Acquisition Capacity: How Much Can It Buy?
- DPU Accretion: What New Acquisitions Mean for Unitholders
- MIT Data Centre Pipeline & Balance Sheet Strategy
- Key Risks: Rising Interest Rates & Refinancing
- Verdict: Is MIT’s Gearing a Strength or a Risk?
- FAQs
What Is MIT’s Gearing Ratio?
MIT’s gearing ratio (also called the aggregate leverage ratio) measures how much of the REIT’s total assets are funded by debt. Under MAS regulations (Property Funds Appendix), Singapore REITs cannot exceed a 50% leverage limit — and if gearing exceeds 45%, the REIT must maintain a minimum interest coverage ratio (ICR) of at least 2.5x.
As at 2Q FY2026/27 (September 2026), MIT’s gearing ratio sits at approximately 36.7% — positioning it as one of the more conservatively leveraged industrial/data centre REITs in Singapore. This is a deliberate management strategy: MIT maintains dry powder for opportunistic acquisitions without compromising financial resilience.
MIT Key Balance Sheet Metrics (2Q FY2026/27)
- Total Assets: ~S$9.0 billion
- Gross Borrowings: ~S$3.30 billion
- Gearing Ratio: ~36.7%
- Weighted Average Interest Rate: ~3.4% p.a.
- Interest Coverage Ratio (ICR): ~4.5x
- Weighted Average Debt Maturity: ~3.8 years
- Proportion of Fixed-Rate Debt: ~79%
The 79% fixed-rate debt is particularly significant: it shields MIT’s DPU from immediate interest rate volatility, giving management and unitholders visibility into near-term distributions even in a higher-for-longer rate environment.
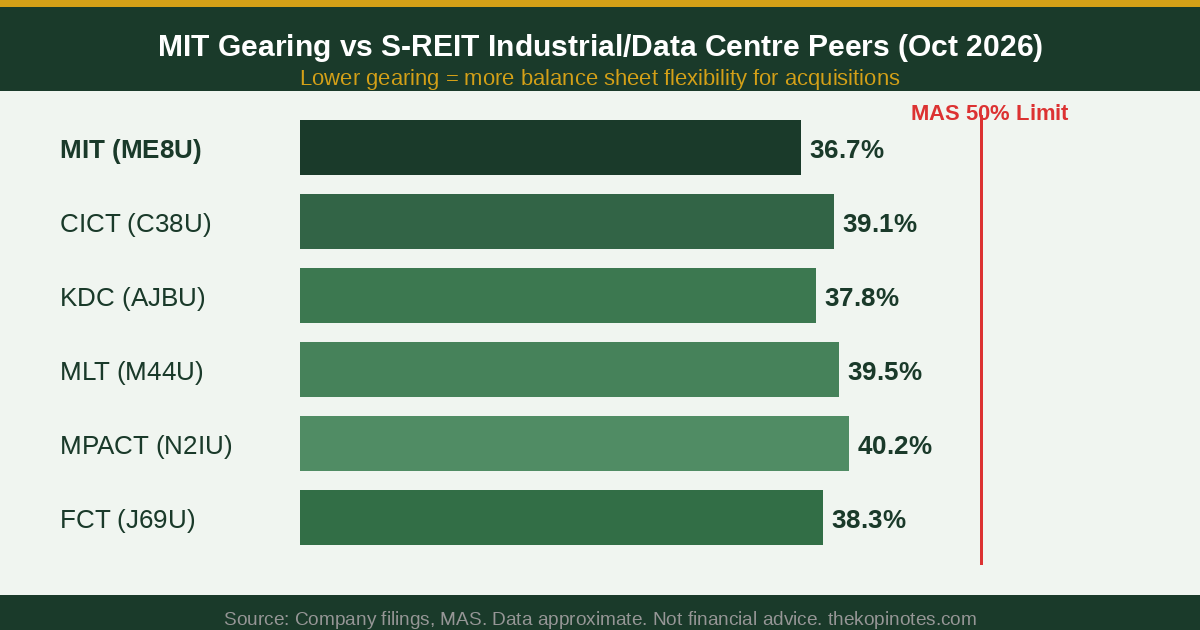
Chart: MIT gearing vs industrial & data centre S-REIT peers. MAS 50% regulatory limit shown in red. Data approximate; source: company filings Oct 2026.
MIT Gearing vs Industrial & Data Centre REIT Peers
Compared to its S-REIT peers in the industrial and data centre space, MIT’s gearing ratio is among the lowest — providing a meaningful competitive advantage when it comes to debt-funded acquisitions:
| REIT (SGX) | Gearing (%) | ICR (x) | Yield (%) |
|---|---|---|---|
| MIT (ME8U) | 36.7% | 4.5x | ~6.1% |
| KDC REIT (AJBU) | 37.8% | 4.2x | ~4.8% |
| CICT (C38U) | 39.1% | 3.9x | ~5.4% |
| FCT (J69U) | 38.3% | 4.0x | ~5.8% |
| MLT (M44U) | 39.5% | 3.7x | ~5.9% |
| MPACT (N2IU) | 40.2% | 3.5x | ~5.6% |
MIT’s lower gearing ratio versus peers like MPACT (40.2%) or MLT (39.5%) is not coincidental. Management has consistently maintained conservative leverage — a stance that proved its worth during the 2022–2023 rate hike cycle, when REITs with higher gearing faced significant distribution cuts.
How Much Debt Headroom Does MIT Have?
With total assets of approximately S$9.0 billion and the MAS 50% leverage cap, the theoretical maximum gross debt MIT could carry is S$4.5 billion. At current borrowings of ~S$3.30 billion, that leaves approximately S$1.2–1.3 billion in unused debt capacity.
However, management typically targets a gearing range of 35–40%, not the 50% ceiling. At a 40% comfort ceiling, the more realistic debt headroom is approximately S$900 million to S$1.0 billion.
The practical acquisition capacity is typically larger than the raw debt figure, because:
- Equity fundraising: MIT can issue new units (private placement or rights issue) to fund part of an acquisition, reducing the debt component. A typical structure might be 60% debt / 40% equity, effectively doubling the total acquisition firepower.
- Assumed debt: If MIT acquires a property with existing financing, that debt is reflected in the total assets calculation, reducing its gearing impact.
- Asset recycling: MIT can divest mature or non-core assets and redeploy the proceeds into higher-yielding data centre assets — improving both DPU and portfolio quality without increasing gearing.
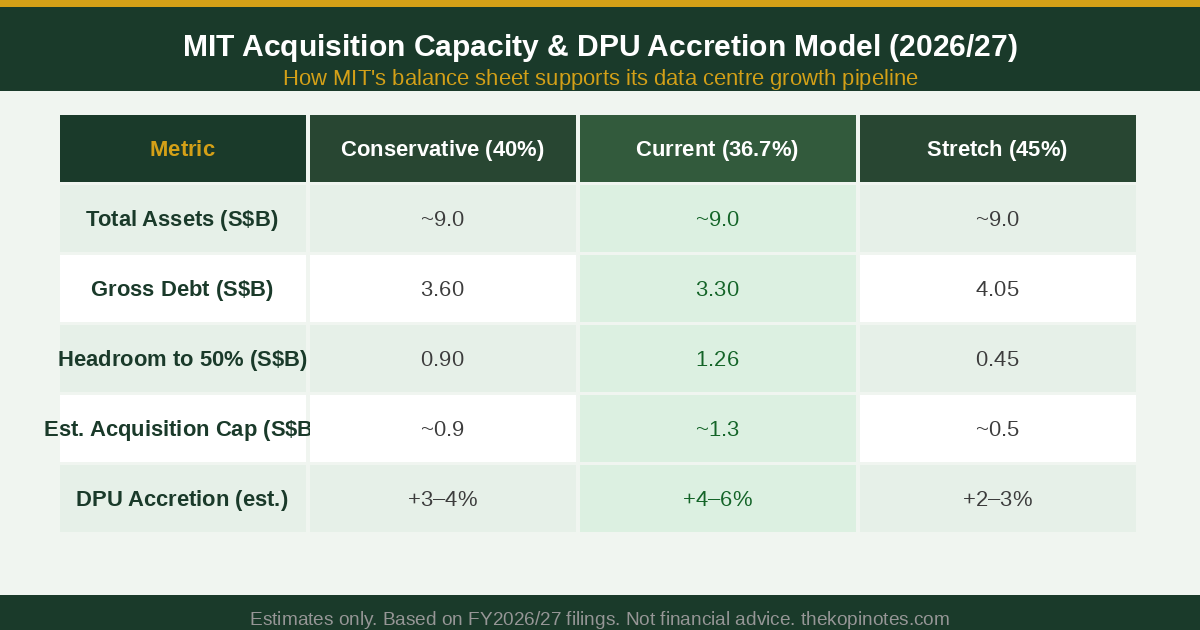
Chart: MIT acquisition capacity under different gearing scenarios. DPU accretion estimates assume 6% acquisition yield. Not financial advice.
MIT’s Acquisition Capacity: How Much Can It Buy?
Combining debt headroom (~S$1.3 billion at 50% MAS cap) with potential equity fundraising (at a 60/40 debt-to-equity ratio), MIT’s total acquisition capacity could reach approximately:
- Conservative (40% gearing ceiling): ~S$900M debt + ~S$600M equity = ~S$1.5 billion total
- Current (36.7% → 50% MAS cap): ~S$1.3B debt + ~S$870M equity = ~S$2.2 billion total
This is a significant war chest — particularly for data centre acquisitions, where individual assets often range from S$200 million to S$800 million.
What MIT Is Likely to Target
Based on MIT’s stated strategy and historical acquisition pattern, the most likely targets fall into two categories:
- US Data Centres: MIT has built a significant US data centre portfolio through its partnership with Mapletree’s sponsor pipeline. Additional hyperscale or colocation facilities in key US markets (Virginia, Texas, Oregon) would be yield-accretive given US cap rates of 5.5–7.0%.
- Singapore Hi-Tech Buildings: Singapore industrial land is scarce, but MIT continues to develop and selectively acquire high-spec hi-tech buildings for tech and pharmaceutical tenants, with typical development yields of 6–7%.
DPU Accretion: What New Acquisitions Mean for Unitholders
The DPU impact of an acquisition depends on the acquisition yield, the cost of capital, and the financing structure. Using a simplified model:
- Scenario: MIT acquires a US data centre for S$600 million at a 6.5% NPI yield
- Financing: 60% debt at 4.2% cost / 40% equity at ~2.2 billion units outstanding
- Incremental NPI: S$39M per year
- Net interest cost: ~S$15.1M (S$360M × 4.2%)
- Net income accretion: ~S$24M
- Per-unit DPU accretion: ~0.6–0.8 Singapore cents (approximately +4–6% DPU growth)
This is meaningful accretion — at a current DPU of approximately 13.5 Singapore cents per year, a 4–6% DPU uplift would add roughly 0.5–0.8 cents per unit annually, pushing total distributions toward 14.0–14.3 cents per unit by FY2027/28.
MIT Data Centre Pipeline & Balance Sheet Strategy
MIT’s portfolio has undergone a dramatic transformation over the past five years. Data centres — once a small niche — now represent approximately 50% of MIT’s total portfolio value, spanning Singapore, the United States, Japan, and Europe.
Key data centre metrics (as at 2Q FY2026/27):
- Number of data centres: 57 (Singapore + overseas)
- Occupancy rate: ~92–95% (hyperscale-grade colocation)
- Lease WALE (data centres): ~7.0 years
- Typical lease structure: Triple-net or fully-loaded with annual rental escalation clauses
The high WALE and triple-net structure mean MIT’s data centre income is both predictable and inflation-linked — an ideal combination for long-term DPU sustainability.
MIT’s Asset Recycling Strategy
In parallel with acquisitions, MIT has been actively recycling older flatted factory and business park assets that are lower-yielding or approaching end of land lease. Proceeds from divestments — typically at or above book value — are redeployed into higher-yielding data centre assets, improving overall portfolio quality without increasing gearing.
This virtuous cycle (divest low-yield → acquire high-yield data centres → DPU grows) is a key reason why MIT’s DPU trajectory has remained resilient even during the rate hike cycle.
Key Risks: Rising Interest Rates & Refinancing
Even with conservative gearing, MIT is not immune to interest rate risk. Approximately 21% of MIT’s debt is floating-rate — meaning higher-for-longer rates would gradually erode distribution income as floating-rate tranches reprice.
Key risks to monitor:
- Interest rate refinancing risk: MIT has significant debt tranches maturing in FY2027. If the prevailing cost of new borrowings is 4.5–5.0% versus the blended current rate of ~3.4%, the net impact could be a reduction of 0.3–0.5 cents per unit in annual DPU — assuming all else equal.
- USD/SGD FX risk: MIT’s US data centres generate USD-denominated income. A strengthening SGD would reduce the SGD value of US distributions. MIT uses forward contracts and natural hedges to manage this, but residual FX exposure remains.
- Acquisition yield compression: If data centre cap rates tighten significantly (as occurred in 2021–2022), future acquisitions may be less accretive than historical transactions. MIT must maintain acquisition discipline.
- Occupancy risk in legacy industrial assets: Flatted factories and business parks face competition from newer developments. Vacancy increases in this segment could partially offset data centre DPU gains.
Verdict: Is MIT’s Gearing a Strength or a Risk?
MIT’s gearing ratio of ~36.7% is unambiguously a strength in the current environment. It provides:
- ✅ S$1.3 billion in debt headroom at the MAS 50% cap (S$900M at a conservative 40% ceiling)
- ✅ Firepower for DPU-accretive acquisitions — particularly US data centres at 6–7% yields
- ✅ Buffer against gearing covenant breaches if asset values fall (which reduces total assets and pushes gearing higher)
- ✅ Lower cost of capital — less-leveraged REITs typically command tighter credit spreads and lower borrowing costs
For long-term investors, MIT’s conservative balance sheet is one of its most underappreciated advantages. While a higher-geared REIT might deliver marginally higher yield in a stable rate environment, MIT’s financial resilience is worth a premium — especially given the potential for meaningful DPU uplift from debt-funded acquisitions in the data centre segment.
At a current yield of approximately 6.1% and a P/NAV of ~0.95–1.05x, MIT offers a compelling combination of income, growth optionality, and balance sheet safety for Singapore dividend investors.
Start Building Your S-REIT Portfolio
If MIT is part of your income portfolio strategy, the right brokerage matters. We use and recommend:
Frequently Asked Questions
What is Mapletree Industrial Trust's current gearing ratio?
How much can MIT borrow for new acquisitions?
What is MIT's dividend yield in 2026?
Is MIT's gearing ratio safe compared to its peers?
Will MIT raise equity (rights issue) for its next acquisition?
How does MIT's gearing affect its DPU sustainability?
Disclaimer: This article is for informational purposes only and does not constitute financial advice. All figures are approximate and sourced from publicly available company filings. S-REIT investments carry risks including market risk, interest rate risk, and FX risk. Past performance is not indicative of future results. Please consult a licensed financial adviser before making investment decisions. The Kopi Notes may receive referral fees from linked platforms.
This article was researched with the help of AI. While we strive to keep all information accurate and up to date, there may be errors. If you notice any discrepancies, please contact us.