Mapletree Industrial Trust Tenant Profile 2026: Top Tenants, WALE & Lease Expiry Schedule (ME8U)
By The Kopi Notes | October 2026 | 9 min read
TABLE OF CONTENTS
- What Is Mapletree Industrial Trust?
- Portfolio Breakdown by Property Type
- Top Tenants by Gross Revenue 2026
- WALE: Weighted Average Lease Expiry
- Data Centre Concentration: Risk or Resilience?
- Singapore vs North America Tenant Split
- Lease Expiry Schedule 2026
- What This Means for DPU Stability
- Investor Verdict
- FAQ
Mapletree Industrial Trust (SGX: ME8U) holds a diversified industrial portfolio spanning data centres, hi-tech buildings, business parks, and flatted factories across Singapore and North America. As at FY2026, data centres contribute approximately 50% of gross revenue, anchored by long-term leases of 10 to 15 years. The trust’s blended weighted average lease expiry (WALE) of approximately 4.5 years provides strong DPU visibility — here is a full breakdown of who MIT’s tenants are and what it means for your investment.
Not financial advice. All figures are for educational reference only. Data as at October 2026 unless noted.
What Is Mapletree Industrial Trust?
Mapletree Industrial Trust (MIT) is a Singapore-listed real estate investment trust (S-REIT) managed by Mapletree Industrial Trust Management Ltd, a wholly-owned subsidiary of Mapletree Investments Pte Ltd — a Singapore government-linked real estate company under Temasek Holdings.
Listed on the Singapore Exchange in October 2010, MIT has grown from a predominantly Singapore flatted factory REIT into a globally diversified industrial and data centre trust. As at FY2026, MIT’s portfolio comprises approximately 140 properties across Singapore and North America, with a total assets under management of approximately S$8.8 billion.
For income-seeking investors tracking the Mapletree Industrial Trust share price, understanding WHO occupies MIT’s properties — and for HOW LONG — is every bit as critical as the headline distribution per unit (DPU) or dividend yield. A high-quality, long-tenured tenant base is the foundation of DPU sustainability. Let us break it down.
MIT Portfolio Breakdown by Property Type
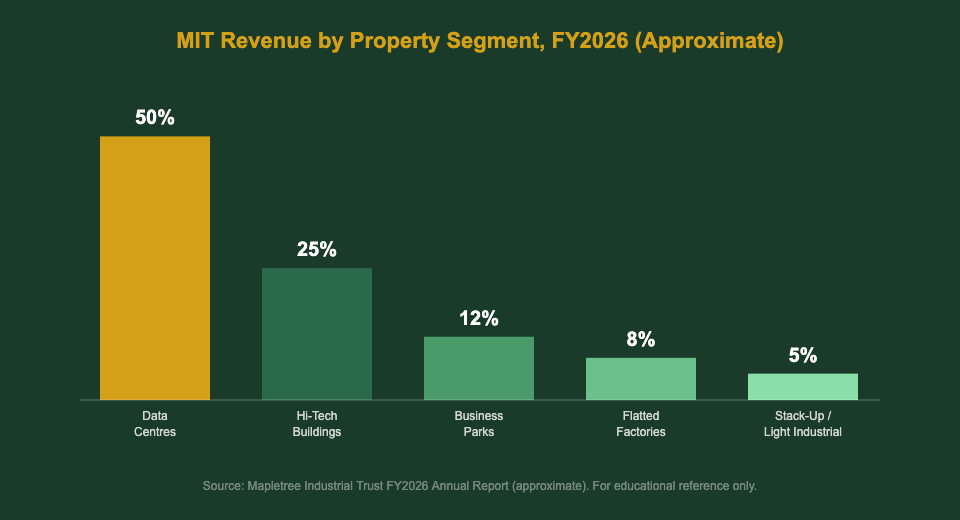
MIT’s portfolio spans five main asset types. Data centres now form the single largest revenue segment, displacing flatted factories that historically dominated the trust at IPO. The shift reflects MIT’s strategic pivot toward higher-yielding, longer-lease digital infrastructure.
| Property Type | Est. % of Gross Revenue | Key Characteristics |
|---|---|---|
| Data Centres (SG + North America) | ~50% | Long leases (10–15yr), mission-critical, hyperscaler clients |
| Hi-Tech Buildings | ~25% | R&D, laboratory, light manufacturing, corporate tech tenants |
| Business Park Buildings | ~12% | Office-adjacent, professional services, tech firms |
| Flatted Factories | ~8% | Multi-tenanted, SME occupiers, shorter leases (1–3yr) |
| Stack-Up / Light Industrial | ~5% | Logistics-adjacent, flexible industrial use |
Source: Mapletree Industrial Trust FY2026 Annual Report (approximate figures; percentages rounded for illustrative purposes).
MIT Top Tenants by Gross Revenue 2026
MIT does not publish a granular tenant list naming every client with their precise revenue share. However, based on MIT’s published investor presentations, segment disclosures, and annual reports, we can profile the trust’s key tenant categories and their approximate contributions to gross revenue.
| Tenant / Segment | Asset Type | Approx. Revenue Share | Lease Profile |
|---|---|---|---|
| Hyperscalers & Colo Operators* | Data Centres (NA) | ~30–35% | 10–15yr NNN leases |
| Data Centre Clients (SG) | Data Centres (SG) | ~15–18% | Long-term master leases |
| Enterprise Tech Firms (incl. HPE, DXC) | Hi-Tech Buildings (SG) | ~12–15% | 3–7yr corporate leases |
| Biomedical / Pharma / R&D | Hi-Tech / Business Parks (SG) | ~8–10% | 3–5yr, renewal-heavy |
| SMEs / Light Industrial | Flatted Factories / Stack-Up | ~10–14% | 1–3yr, multi-tenanted |
| Others (Gov’t-linked, MNC offices) | Business Park / Misc. | ~5–8% | Various terms |
*MIT does not publicly name individual hyperscaler clients in North America. Estimates based on segment-level disclosures and investor presentations.
The most important observation: MIT’s top two tenant categories — North American hyperscalers and Singapore data centre clients — together represent roughly 45–50% of total gross revenue. Both occupy properties under long-term leases. This is the critical anchor of MIT’s income stability.
You can cross-reference with our analysis of KDC REIT valuation 2026 for a comparison of data centre REIT tenant strategies in Singapore.
WALE: MIT’s Weighted Average Lease Expiry
MIT’s blended WALE of approximately 4.5 years (by gross rental income, FY2026) conceals a two-speed lease structure that is crucial for any investor assessing the trust’s income durability.
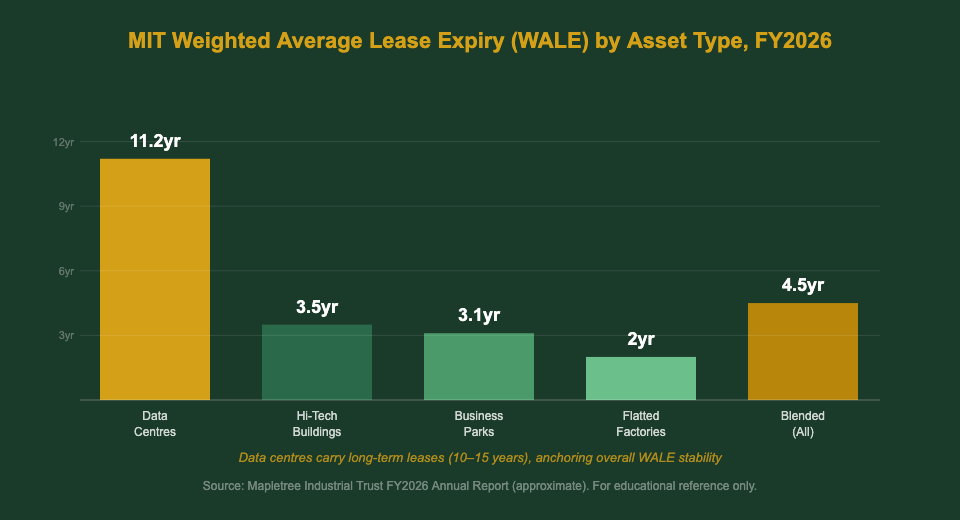
Breaking down the WALE by asset type reveals the structural advantage MIT’s data centres provide:
- Data Centre leases (NA + SG): ~10–12 years average WALE. Triple-net (NNN) structures mean tenants pay operating costs, reducing MIT’s outgoings. Early termination is commercially impractical for mission-critical data centre operators.
- Hi-Tech Buildings: ~3–4 years WALE. Corporate technology tenants renew regularly, with rent reviews allowing MIT to capture market uplifts. Positive rent reversions of 5–10% have been observed in recent cycles.
- Business Park Buildings: ~3 years WALE. Short but predictable, with a diverse SME and corporate tenant base.
- Flatted Factories / Stack-Up: ~1.5–2 years WALE. Highest tenant turnover, but MIT benefits from active management and proximity to JTC-administered industrial estates.
The practical implication: even if every short-lease industrial tenant in Singapore simultaneously vacated (an extreme scenario), the long-term data centre income stream would cushion MIT’s DPU. This asymmetric protection is what distinguishes MIT from a pure-play Singapore industrial REIT.
For broader context on Singapore’s income investing landscape, explore our guide to passive income strategies in Singapore for 2026.
Data Centre Concentration: Risk or Resilience?
With data centres now contributing approximately half of MIT’s gross revenue, investors reasonably ask: is this concentration a risk or a strength? The answer depends on your time horizon and assumptions about tenant renewal behaviour.
The bull case for data centre concentration: AI adoption is driving exponential data centre demand. Hyperscalers — the cloud giants that occupy MIT’s North American data centres — are expanding rapidly, adding capacity and signing long-term leases. MIT’s existing footprint positions it to benefit from renewals at potentially higher rents when today’s 10–15 year leases eventually expire. The infrastructure nature of data centres means non-renewal is exceptional rather than the rule.
The bear case to consider: When large North American data centre leases (potentially representing 15–25% of total revenue each) come up for renewal from FY2032 onwards, any renegotiation at below-inflation rent increments could pressure DPU. Single-tenant risk is also higher in purpose-built data centres — if a major hyperscaler client consolidates or exits, finding a replacement at equivalent rents could take time.
The Kopi Notes View: Data centre leases are among the stickiest in real estate. The capital cost of migrating a live data centre is prohibitively expensive — typically years of planning and hundreds of millions of dollars. MIT’s North American data centres benefit from exactly this switching cost moat. We view the concentration as a structural resilience feature, not a risk, for the foreseeable 5–7 year horizon.
MIT’s data centre expansion also positions it as a Singapore-investor gateway to the global AI infrastructure buildout — without the complexity of buying overseas REITs directly. For investors comparing alternatives, our Singapore REIT ETF guide covers diversified S-REIT exposure options.
Singapore vs North America: Tenant Composition
MIT’s geographic diversification adds another dimension to its tenant profile. As at FY2026, the trust generates approximately 55% of gross revenue from Singapore and 45% from North America.
| Geography | % of Gross Revenue | Property Mix | WALE Characteristics |
|---|---|---|---|
| Singapore | ~55% | Flatted factories, hi-tech, business parks, SG data centres | 2–5yr average; rent reversion upside |
| North America | ~45% | Predominantly data centres (~18 properties) | 10–15yr NNN; income visibility |
Source: MIT FY2026 Annual Report (approximate). Singapore includes all SGX-listed MIT properties.
The Singapore portfolio provides inflation-hedged income with periodic rent reviews, JTC-governed supply constraints, and exposure to high-growth industries (semiconductor, pharma, biomedical, logistics). The North America portfolio provides long-dated, high-visibility income underpinned by structural AI-driven data centre demand.
A key risk to monitor: with 45% of income in USD, MIT’s SGD-reported DPU is sensitive to the USD/SGD exchange rate. A strengthening SGD reduces translated income. MIT hedges a portion of its foreign income, but residual FX exposure remains. This is particularly relevant when investors compare MIT’s yield against pure-play Singapore industrial REITs.
Investors deploying capital via a Syfe referral code into S-REIT portfolios should be aware that MIT is a common constituent of diversified S-REIT strategies due to its size and institutional quality.
MIT Lease Expiry Schedule 2026
Understanding the lease expiry profile tells investors when rental income is at risk of repricing. MIT’s distribution by expiry year (as at FY2026) looks broadly manageable:
| Lease Expiry Window | Est. % of Gross Revenue | Key Implications |
|---|---|---|
| Within 1 Year (FY2027) | ~12–15% | Primarily short-lease SG industrial; manageable renewal risk |
| FY2028–FY2029 | ~25–30% | Mix of hi-tech and SG data centre leases; active asset management window |
| FY2030–FY2031 | ~20–25% | Moderate expiry concentration; 3–5yr corporate leases renewing |
| FY2032 and Beyond | ~30–35% | Bulk of NA data centre leases; high retention probability |
Estimates based on MIT’s published WALE profile and asset type mix. Individual lease expiry dates are subject to extension options and early renewals.
The approximately 12–15% of revenue expiring within FY2027 is almost entirely short-lease industrial space in Singapore. At current Singapore industrial market rents (which have generally trended upward due to JTC supply constraints), renewal risk is low. MIT’s experienced asset management team actively re-leases properties well before formal expiry, typically achieving positive rent reversions.
The larger concern for long-term investors is the FY2032+ cohort — North American data centre leases which, when they eventually come up for renewal, will be renegotiated in whatever data centre market environment exists then. The structural case for renewal remains strong, but investors should track this over time. For broader income planning, our Singapore retirement planning calculator can help model how MIT’s DPU fits into a long-term income portfolio.
What MIT’s Tenant Profile Means for DPU Stability
Synthesising the tenant profile, WALE analysis, and lease expiry schedule, here are the five key DPU stability factors for MIT shareholders:
- Data centre income is infrastructure-grade: Long leases, NNN structures, and high switching costs make data centre DPU exceptionally stable. This underpins approximately half of MIT’s total distribution.
- Singapore industrial provides rent upside: Short-lease properties in Singapore may see positive rent reversions of 5–10% on renewal given tight industrial supply, partially offsetting any vacancy risk from tenant turnover.
- Occupancy is the swing variable: MIT’s portfolio occupancy of approximately 92–94% (FY2026) means limited room for occupancy-driven income growth unless new assets are added. Any occupancy improvement in Singapore’s multi-tenanted buildings has a direct DPU uplift effect.
- FX is an ongoing headwind to monitor: With ~45% of income in USD, a 5% SGD appreciation against USD reduces MIT’s gross revenue by approximately 2.25%. Investors should track USD/SGD alongside MIT’s quarterly DPU announcements.
- Gearing creates acquisition optionality: MIT’s leverage of approximately 37–40% (FY2026) is below the 50% regulatory ceiling, providing firepower for accretive data centre or industrial acquisitions that could expand and diversify the tenant base further.
For context, compare MIT’s profile against other best S-REITs in Singapore 2026 to see where MIT sits on the risk-return spectrum relative to retail, office, and logistics REITs.
Investor Verdict: Should You Buy MIT Based on Its Tenant Profile?
MIT’s tenant profile is a net positive for income investors. The data centre anchor (~50% of revenue, 10–15yr WALE) provides infrastructure-like income stability. The Singapore industrial portfolio offers rent reversion upside. Together they create a complementary, two-speed income engine.
Key Metrics to Watch
- Quarterly DPU per unit (track YoY trend)
- Data centre WALE — should stay above 10yr to signal lease stability
- North America data centre occupancy (aim for 95%+)
- Singapore industrial rent reversions (positive = bullish signal)
- USD/SGD exchange rate impact on translated income
- Gearing ratio — acquisitions above 40% gearing require careful scrutiny
For a long-term passive income investor seeking S-REIT exposure with infrastructure-like stability, MIT’s tenant profile compares favourably. The data centre anchor provides a moat around income; the Singapore industrial portfolio adds cyclical upside. The primary risk is FX (USD exposure) and the eventual repricing of North American data centre leases from FY2032 onwards — both are manageable with appropriate position sizing.
This is not financial advice. Always conduct your own due diligence before investing in any S-REIT.
Frequently Asked Questions (FAQ)
Who are Mapletree Industrial Trust's biggest tenants?
What is MIT's weighted average lease expiry (WALE)?
How does MIT's data centre exposure affect its share price?
Is Mapletree Industrial Trust safe for income investors?
How often does MIT pay dividends and what is the current DPU?
How does MIT compare with KDC REIT on tenant quality?
Where can I buy MIT shares in Singapore?
Related Reading
- Best S-REITs in Singapore 2026 — full yield comparison
- Passive income Singapore: building a dividend portfolio in 2026
- Singapore REIT ETF guide — for diversified S-REIT exposure
- Singapore retirement planning calculator
- KDC REIT Valuation 2026
Start Investing in S-REITs
Get cashback or fee waivers when you open a new brokerage or robo-advisory account:
- Syfe referral code — SRPRFFFCD (fee waiver on managed portfolios)
- FSMOne referral code — P0544985 (SGX-listed REITs & ETFs)
- Endowus referral code — 2V343 (CPF, SRS & cash investing)
This article was researched with the help of AI. While we strive to keep all information accurate and up to date, there may be errors. If you notice any discrepancies, please contact us.