Keppel DC REIT Overseas Portfolio 2026: Germany, Netherlands, Australia & Malaysia — How Foreign Assets Impact DPU
A complete breakdown of KDC REIT’s international data centre exposure and what it means for Singapore investors
Table of Contents
Keppel DC REIT (SGX: AJBU) is Singapore’s first and largest listed data centre REIT, with a portfolio spanning Singapore, Germany, the Netherlands, Australia, and Malaysia. As at H1 2026, approximately 60% of assets under management sit in Singapore, while the remaining 40% are spread across overseas markets. For Singapore investors, understanding the geographic mix — and its effect on DPU stability — is essential before buying.
Not financial advice. All figures are for educational reference only. Data as at October 2026 unless noted.
What is Keppel DC REIT?
Keppel DC REIT (ticker: AJBU) was listed on the Singapore Exchange (SGX) in December 2014 and is sponsored by Keppel Corporation Limited, one of Singapore’s largest diversified conglomerates. It was the first pure-play data centre REIT in Asia Pacific and holds a portfolio of purpose-built and conversion data centres catering to enterprise and hyperscaler tenants.
As of 2026, KDC REIT operates 23 data centres across 9 cities in 8 countries, with a total assets under management (AUM) of approximately S$3.9 billion. The REIT is managed by Keppel DC REIT Management Pte. Ltd., a wholly owned subsidiary of Keppel Capital Holdings.
Singapore investors can hold KDC REIT units via the Central Depository (CDP), and it is also eligible for inclusion in the CPF investment strategy under the CPF Investment Scheme (CPFIS).
KDC REIT Global Portfolio Overview (2026)
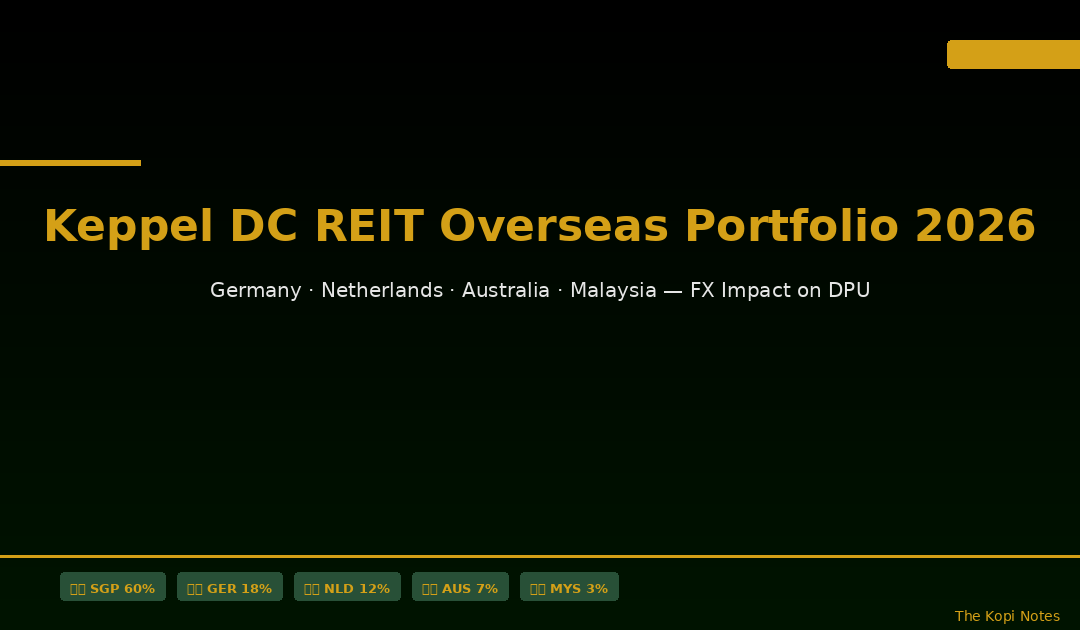
Keppel DC REIT’s 23-asset portfolio spans three broad geographic clusters: (1) Singapore, which forms the anchor; (2) Europe — specifically Germany and the Netherlands; and (3) Asia-Pacific — comprising Australia and Malaysia. Each cluster has different demand drivers, lease structures, and currency exposures.
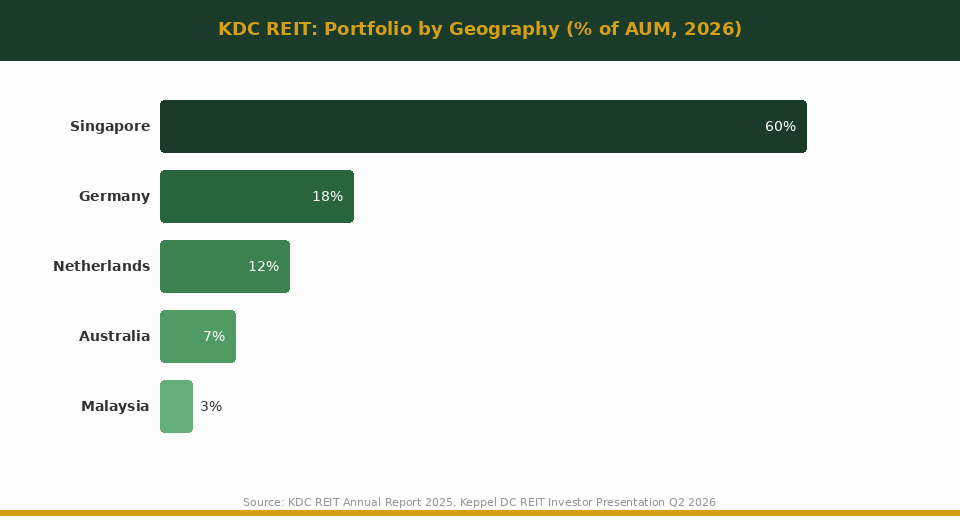
Source: Keppel DC REIT Investor Presentation, Q2 2026. Singapore includes SGD-denominated assets; estimates rounded to nearest percentage.
| Geography | Currency | No. of Assets | % of AUM (est.) | Key Tenants (Type) |
|---|---|---|---|---|
| Singapore | SGD | 10 | ~60% | Hyperscalers, enterprise, govt |
| Germany | EUR | 5 | ~18% | Colocation, enterprise |
| Netherlands | EUR | 3 | ~12% | Internet exchange, colocation |
| Australia | AUD | 3 | ~7% | Hyperscaler, wholesale |
| Malaysia | MYR | 2 | ~3% | Regional enterprise |
Source: Keppel DC REIT 2025 Annual Report; Q2 2026 Business Update. Asset count and AUM percentages are estimates based on disclosed valuations.
Singapore Data Centres: The Core Revenue Driver
Singapore accounts for roughly 60% of KDC REIT’s AUM and is the backbone of the REIT’s income stability. The Singapore assets include flagship facilities such as KDC Singapore 1 through 7, located in established data centre hubs like Serangoon North, Woodlands, and Tuas. These assets cater primarily to hyperscaler clients — large cloud providers that need dedicated, high-power-density space — and enterprise clients with multi-year, triple-net lease structures.
Singapore’s data centre market benefits from several structural advantages that make it a premium location globally: political stability, a robust power grid, proximity to submarine cable landing stations, and MAS-regulated financial system reliability. The Singapore government’s 2024-2026 data centre moratorium — which has since been lifted — has actually tightened existing supply, supporting rental reversion prospects for KDC REIT’s Singapore assets.
Why Singapore Data Centres Carry Zero FX Risk for DPU
Because Singapore assets are denominated in SGD, the income they generate does not fluctuate with foreign exchange movements. For Singapore investors focused on passive income Singapore strategies, this is an important distinction: approximately 60% of KDC REIT’s DPU is fully shielded from currency risk. The remaining 40% — the overseas assets — introduce a layer of FX volatility that is critical to understand.
Germany & Netherlands: European Exposure (30% combined)
KDC REIT’s European footprint, spanning roughly 18% in Germany and 12% in the Netherlands, gives the REIT meaningful exposure to one of the world’s most mature and sought-after data centre markets. Together, these assets represent approximately 30% of AUM — the largest overseas exposure block.
Germany: Frankfurt Data Centre Hub
Germany is home to Frankfurt, one of Europe’s top three data centre hubs alongside Amsterdam and London. Frankfurt’s appeal comes from its central location, dense fibre network, and proximity to the financial centre. KDC REIT’s German assets include colocation facilities servicing European enterprise and financial sector tenants with long lease durations (typically 5–15 years) and built-in rental escalations.
German data centres have historically commanded strong occupancy rates above 95%, and the rise of AI workload processing has begun to push power demand at existing campuses, supporting the case for future rental reversion or acquisition-led growth.
Netherlands: Amsterdam — Internet Exchange Capital
The Netherlands portfolio is anchored in Amsterdam, home to AMS-IX — one of the world’s largest internet exchange points. KDC REIT’s Amsterdam assets benefit from this position as a network-dense hub, attracting internet and content delivery network (CDN) operators who require ultra-low latency interconnection with European networks.
Both Germany and the Netherlands generate income in Euros (EUR). As of October 2026, the EUR/SGD exchange rate is approximately 1.44–1.46. A 10% strengthening of the EUR versus SGD would increase KDC REIT’s overseas income from this bloc by an estimated 0.07¢ per unit annualised — material for a REIT currently distributing approximately 9.5¢ per year.
Australia & Malaysia: Asia-Pacific Diversification
Australia (AUD): Growing Hyperscaler Demand
Australia makes up approximately 7% of KDC REIT’s AUM, with assets primarily serving Australian hyperscalers and wholesale colocation clients. Australia’s digital economy has expanded rapidly, driven by increasing cloud adoption in financial services and healthcare, and the government’s push for sovereign cloud capabilities.
The Australian assets are denominated in AUD, which has historically traded in a range of SGD 0.85–0.98. As at October 2026, the AUD has experienced mild depreciation versus SGD year-to-date (-1.8%). While the magnitude of Australia’s DPU contribution is modest (~7% of AUM), any significant AUD weakness could act as a marginal drag on distributions.
Malaysia (MYR): Emerging Regional Hub
Malaysia is the smallest component at approximately 3% of AUM, with assets in Kuala Lumpur’s developing data centre corridor in Cyberjaya and Johor. Malaysia has emerged as an increasingly important regional data centre destination, driven by lower land costs, competitive electricity rates, and proximity to Singapore — which faces supply constraints. KDC REIT’s Malaysia exposure gives it a foothold in what could become a meaningful growth market over the coming decade.
MYR income represents a small fraction of total DPU and carries limited FX sensitivity at current scale. Given that both Singapore and Malaysia are ASEAN economies with tightly correlated trade cycles, MYR-SGD volatility has historically been contained relative to EUR or AUD movements.
FX Risk: How EUR, AUD & MYR Affect DPU
KDC REIT does not fully hedge its foreign currency income — a disclosure made clear in its financial statements and management presentations. The REIT employs partial natural hedging (matching local borrowings to local income) and occasionally uses cross-currency swaps for larger tranches, but a residual FX exposure remains.
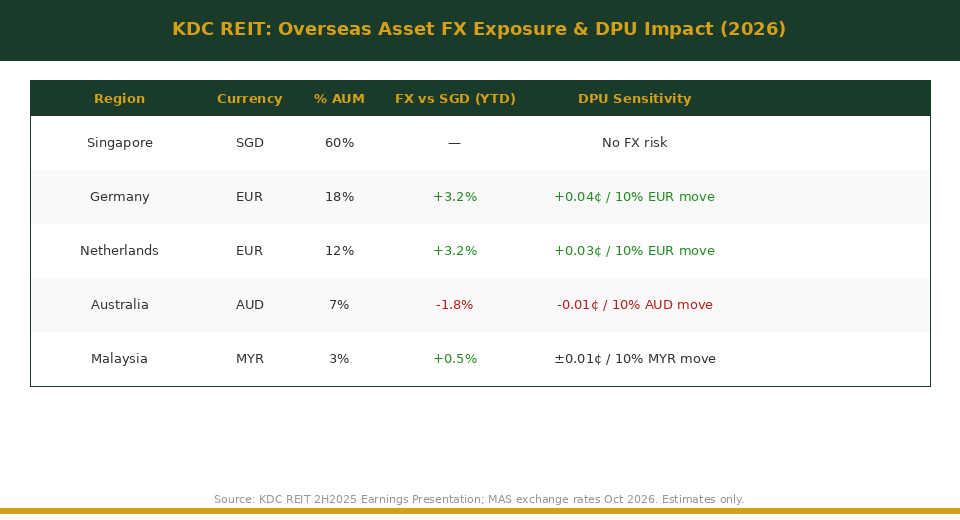
Source: KDC REIT 2H2025 Earnings Presentation; MAS exchange rates October 2026. DPU sensitivity figures are estimates for illustrative purposes.
The practical implication for Singapore investors: in a year where EUR strengthens significantly against SGD — as it did in early 2024 — KDC REIT’s overseas income translates into more SGD, providing a DPU uplift. Conversely, EUR weakness (as seen in 2022) drags on distributions. Over the past 3 years, EUR/SGD volatility has contributed an estimated ±3–5% swing in KDC REIT’s annual DPU, based on the REIT’s stated 30% overseas exposure.
KDC REIT’s Hedging Strategy
Management has disclosed a partial hedging policy in multiple presentations. Key points from KDC REIT’s 2025 Annual Report and Q2 2026 Business Update:
- EUR exposure: ~50–60% of EUR income is hedged 12 months forward using rolling contracts, leaving a residual exposure.
- AUD exposure: Partially hedged via natural offset (AUD-denominated debt against AUD income); residual ~30–40% unhedged.
- MYR exposure: Largely unhedged at current scale; management monitors this but deems MYR-SGD volatility low risk.
- Hedging costs are a line item in distributable income, meaning that in high-interest-rate environments, the cost of forward contracts increases, slightly reducing the net income available for distribution.
What This Means for Singapore Investors
Understanding KDC REIT’s overseas portfolio is not just an academic exercise. It directly shapes three practical investor considerations: DPU predictability, portfolio diversification benefits, and the REIT’s long-term growth thesis.
1. DPU Predictability
A 60% SGD base provides meaningful income stability. The remaining 40% introduces FX noise, but KDC REIT’s management has consistently guided that partial hedging and multi-year lease structures mitigate the worst-case FX scenarios. Investors should treat the FX component as a secondary variable — not a primary risk — given the REIT’s long weighted average lease expiry (WALE) of approximately 7 years, which anchors income regardless of short-term currency moves.
2. Portfolio Diversification
The geographic spread actually reduces rather than increases risk in some scenarios. If Singapore’s data centre market faces a slowdown — due to power constraints, policy changes, or competition from new supply — the European and Australia segments can provide an uncorrelated income stream. This is one of the structural arguments for KDC REIT versus a purely Singapore-focused industrial REIT. Investors interested in best S-REITs in Singapore 2026 comparisons should factor this diversification into their analysis.
3. Growth Runway Overseas
The overseas portfolio is not static. KDC REIT has a right-of-first-refusal (ROFR) on Keppel Corporation’s pipeline of data centres globally, which could include additional German, Australian, or new-market assets. Each acquisition that is DPU-accretive (yield-on-cost exceeding the REIT’s cost of capital) would expand the overseas income base and — depending on FX — either add currency diversification or concentrate it further.
For investors using a Singapore retirement calculator to model passive income needs, KDC REIT’s geographic spread means the REIT’s yield (approximately 4.5–5.0% as at October 2026) comes with a nuanced mix of SGD-stable and FX-variable components that differs from a purely domestic-income S-REIT.
Broker Options for Buying KDC REIT (SGX: AJBU)
Singapore investors can buy KDC REIT units through most brokerage platforms that offer SGX access. Popular choices include using the Syfe referral code and sign-up bonus for a managed portfolio approach, or the FSMOne referral code for a DIY brokerage account with competitive commissions. Investors who prefer to use their CPF or SRS funds to buy KDC REIT should verify CPFIS eligibility before transacting, as the eligible list is updated quarterly by CPF Board.
| Metric | Value (Oct 2026 est.) | Notes |
|---|---|---|
| Indicative Share Price | S$2.08–2.22 | SGX daily range; verify before trading |
| Annualised DPU (est.) | ~9.4–9.8¢ | Based on H1 2026 DPU × 2 |
| Indicative Yield | ~4.3–4.7% | At current price range |
| Gearing Ratio | ~34–36% | Below MAS 50% limit; comfortable buffer |
| WALE | ~7.0 years | Income locked in for medium term |
| Overseas Income (% of total) | ~40% | EUR + AUD + MYR combined |
Source: KDC REIT Q2 2026 Business Update; SGX price data October 2026. All figures estimates for illustrative purposes only. Verify with official filings before any investment decision.
For a broader view of the S-REIT market, compare KDC REIT against other sectors in our Singapore REIT ETF guide.
Frequently Asked Questions
What percentage of KDC REIT's portfolio is overseas?
Does KDC REIT's overseas portfolio affect DPU for Singapore investors?
Is Keppel DC REIT's Germany portfolio large?
Can I buy Keppel DC REIT with CPF funds?
What is KDC REIT's current gearing ratio?
How does KDC REIT's overseas portfolio compare to other S-REITs?
⚠️ Disclaimer: This article is for informational and educational purposes only. It does not constitute financial advice or a recommendation to buy or sell any security. All data and estimates are sourced from publicly available information and are accurate to the best of the author’s knowledge as at October 2026. Past performance is not indicative of future results. Singapore investors should consult a licensed financial adviser before making any investment decisions. The Kopi Notes may earn referral fees when readers sign up via links on this site.
This article was researched with the help of AI. While we strive to keep all information accurate and up to date, there may be errors. If you notice any discrepancies, please contact us.