How to Invest in Singapore When the Market Is at an All-Time High (2026)
The STI keeps hitting fresh records in 2026. Here’s what history says about buying now — and a practical plan either way.
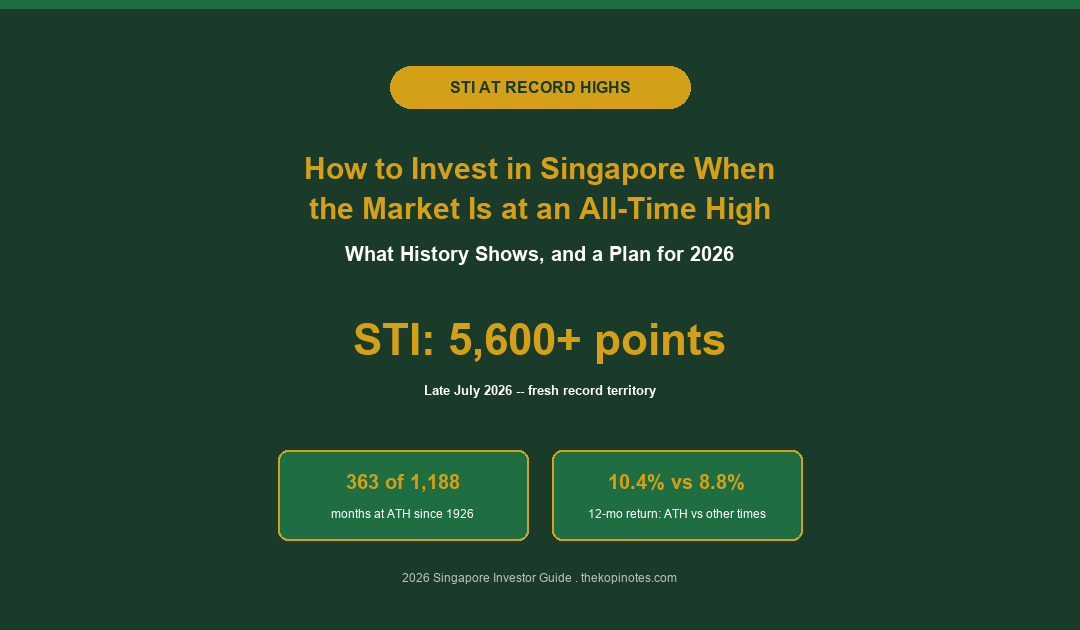
The Straits Times Index (STI) has repeatedly hit record highs in July 2026, trading above 5,600 points. If you’re wondering whether it’s “too late” to invest, history says otherwise: markets sit at all-time highs about a third of the time, and returns after a new high are historically similar to, or better than, other periods.
Not financial advice. All figures are for educational reference only. Data verified as at 31 July 2026 unless otherwise noted.
- Markets spend roughly a third of their time at all-time highs — it’s normal, not a red flag.
- Historically, investing right at a new high has produced 12-month returns similar to, or slightly better than, investing at any other time.
- If you have a lump sum, investing it now beats waiting on the sidelines most of the time — but a fixed monthly plan still protects you emotionally if a drop would make you panic-sell.
Why Investing at a Record High Feels Risky
When the STI is making headlines for hitting new highs, it feels intuitive to wait. Surely a market that’s already climbed this much is “due” for a fall, and putting fresh money in now means buying at the worst possible price.
That instinct is understandable, but it isn’t well supported by the data. A record high isn’t a special, fragile moment — it’s simply what a market that’s been trending upward looks like most of the time. If you waited for every all-time high to pass before investing, you’d have spent enormous stretches of the last century sitting in cash while the market kept climbing anyway.
This matters especially now because Singapore’s market isn’t the only one near records — global indices, including the US market, have also spent much of 2026 near their own highs. If you’re only willing to invest when markets are “cheap” or “beaten down,” you may end up waiting far longer than makes financial sense, especially if you’re investing for a goal 10, 20, or 30 years away.
This guide builds on our beginner investing guide for Singapore and complements our market-crash survival guide — together they cover both ends of the emotional cycle: buying when prices are falling, and buying when they’re at a record.
What History Says About Investing at All-Time Highs
The clearest data on this comes from the US market, which has over a century of daily price history. Of the 1,188 months since January 1926, the market was at an all-time high in 363 of them — 31% of the time. Hitting a record isn’t rare. It’s roughly a one-in-three occurrence.
Research from RBC Global Asset Management, analysing S&P 500 data from 1950 to mid-2025, found that average 12-month returns following a new all-time high were actually slightly better than returns following other periods — 10.4% versus 8.8%. Over five-year windows the pattern reverses slightly (10.5% following a high versus 11.4% at other times), which is a useful reminder that no single stat guarantees anything — but neither horizon shows buying at a high leading to meaningfully worse outcomes.
| Metric (S&P 500, 1950-2025) | After a New All-Time High | At Other Times |
|---|---|---|
| Average 12-month return | 10.4% | 8.8% |
| Average 5-year return | 10.5% | 11.4% |
| Share of months at an all-time high (1926-2025) | 31% (363 of 1,188 months) | |
Source: RBC Global Asset Management analysis of S&P 500 data (1950-mid 2025), figures widely reported in financial media — retrieved 31 July 2026. US data used as illustration; Singapore-specific long-run studies of this kind are not publicly available.
The takeaway isn’t that markets never fall after a record — they sometimes do, sharply. It’s that a new high, by itself, doesn’t statistically signal an imminent drop. Waiting on the sidelines for a pullback that may not come for years carries its own, very real cost: lost time in the market.
Singapore’s Market Right Now: STI at a Record High
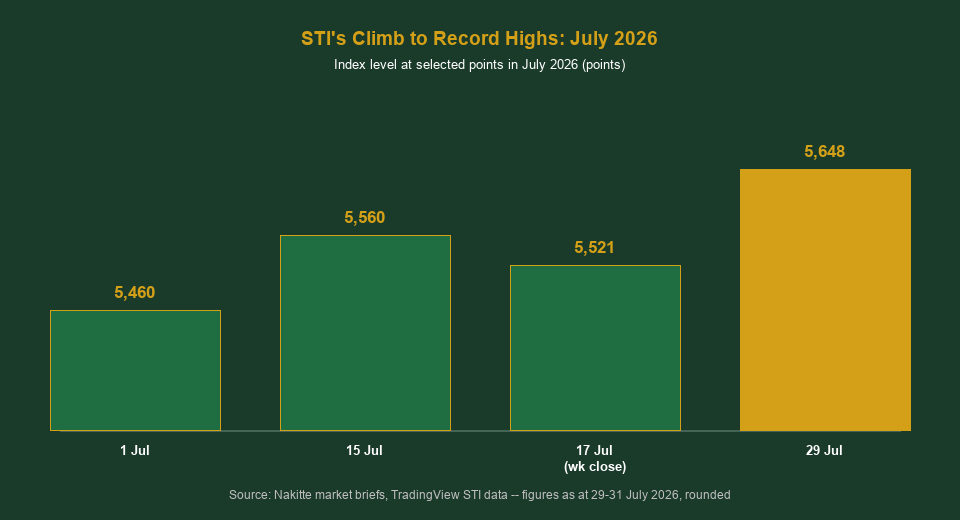
The Straits Times Index (STI) touched a record closing high of 5,559.72 points on 15 July 2026, then finished that week at 5,521.27. By 29 July 2026, the index had climbed further to an intraday high near 5,648 points, and was trading above 5,600 points through the rest of the month. Banks — DBS, OCBC, and UOB — have been a major driver of the rally, alongside continued strength in the broader Singapore market.
| Date (2026) | STI Level | Note |
|---|---|---|
| 15 July | 5,559.72 | Record closing high (at the time) |
| 17 July (week close) | 5,521.27 | Weekly close, slightly off the high |
| 29 July | ~5,648 | New intraday record territory |
Source: Nakitte market briefs, TradingView STI historical data — figures as at 29-31 July 2026, rounded; index levels move daily.
For CPF savers, the third quarter of 2026 (1 July-30 September) brings no change on the safe side of your portfolio: the Ordinary Account (OA) interest rate stays at its floor of 2.5% per annum, and Special, MediSave, and Retirement Account (SMRA) monies continue earning the 4% floor rate, according to the CPF Board’s official Q3 2026 announcement. That steady, guaranteed floor is worth remembering when equity markets feel volatile — your CPF savings aren’t affected by the STI’s swings at all.
Lump Sum vs Dollar-Cost Averaging: Which Wins Near a High?
If you’ve got a windfall — a bonus, an inheritance, matured savings — the question of whether to invest it all at once (lump sum) or spread it out over several months (dollar-cost averaging, or DCA) feels more urgent when the market is at a record.
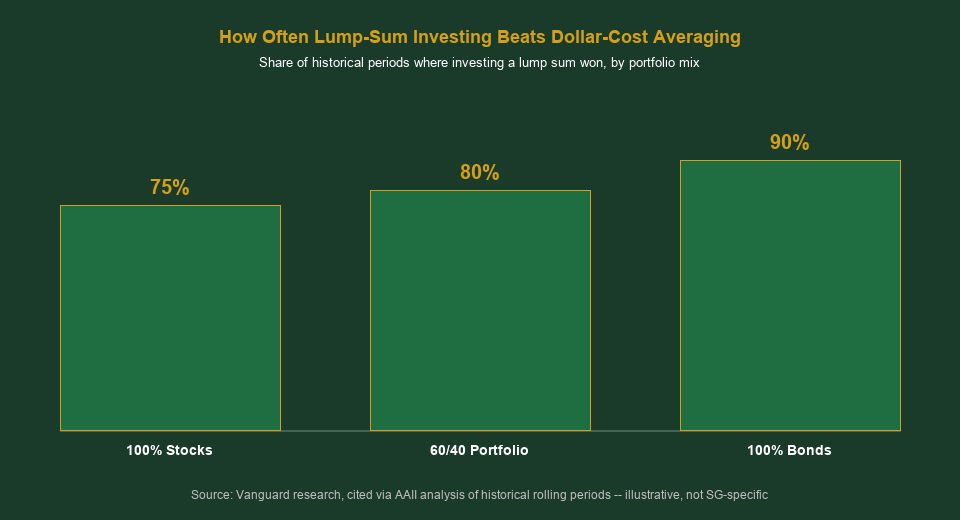
Vanguard’s well-known research on this, cited widely including by AAII, found that lump-sum investing beat DCA in the large majority of historical rolling periods — because markets rise more often than they fall, and DCA leaves part of your money sitting in cash (earning little) while it waits to be deployed.
| Portfolio Mix | Lump Sum Outperformed DCA |
|---|---|
| 100% stocks | 75% of periods |
| 60% stocks / 40% bonds | 80% of periods |
| 100% bonds | 90% of periods |
Source: Vanguard research on historical rolling investment periods, cited via AAII analysis — US market data, illustrative rather than Singapore-specific.
But there’s an important exception: during sharp downturns, DCA cushions the blow. In 2008, when the S&P 500 fell about 38.5% for the year, an investor who spread contributions evenly through the year saw a paper loss closer to 26% — meaningfully smaller than a lump sum invested right at the start.
The honest answer for most Singapore investors: if you’re emotionally able to hold through a 20-30% drop without panic-selling, investing a lump sum as soon as you have it is the historically stronger choice. If a sudden drop right after investing would genuinely tempt you to sell everything, spreading a large sum over 6-12 months is a reasonable trade — you’re paying a small statistical cost for a large behavioural benefit.
What to Actually Do With New Money Right Now
If you’re already investing regularly (RSP or robo-advisor): keep going. Stopping or pausing your Regular Savings Plan (RSP) because the market feels “too high” is exactly the market-timing behaviour the data above argues against. Your monthly contribution is small relative to your total portfolio, so the entry price of any single month matters far less than staying consistent for years.
If you have a new lump sum: decide based on your own temperament, not the headlines. Investing it now is the historically stronger choice for most goals with a 10+ year horizon. If you’d panic at a 20% drop the month after investing, split it into 6-12 monthly tranches instead — imperfect, but far better than staying in cash indefinitely waiting for a “better” entry point that may never come.
If you need the money within 1-3 years: a record high in the STI is not the environment to be taking on new equity risk with short-term money at all. Park it instead in instruments matched to that timeline — see our Singapore Savings Bonds guide for capital-guaranteed options, or our goal-based investing guide for matching different savings goals to the right vehicle.
If you haven’t started investing at all: a record high is a worse reason to avoid starting than almost any other. The cost of waiting an extra year “for a dip” is real — and unlike a single bad entry price, it’s guaranteed to happen every year you delay.
Check Whether You Need to Rebalance
A sharp, sustained rally like the one the STI has had in 2026 changes your portfolio’s composition even if you never touch it. If equities have climbed faster than your bonds, cash, or REIT holdings, your original target mix — say, 70% equities and 30% bonds — may have quietly drifted to 80/20 without any action from you.
A simple, common rule: rebalance when any asset class drifts more than 5 percentage points from its target weight, checked once or twice a year. This isn’t about predicting a top — it’s about trimming your winners back to your original risk level and buying more of what’s lagged, which happens to be a disciplined way of “selling high, buying low” without trying to time anything.
If you’re not sure what your target mix should be in the first place, our risk profile framework walks through how to set one based on your age, goals, and comfort with volatility.
Common Mistakes Near Market Highs
Mistake 1: Waiting indefinitely for a “big correction.” There’s no reliable way to know when, or if, a meaningful pullback arrives. Every month spent waiting is a month of potential growth and dividends missed, on top of the fact that markets are at highs about a third of the time by nature.
Mistake 2: Selling winners “just in case.” Trimming a position because it’s gone up a lot, with no other reason, often triggers unnecessary capital gains or transaction costs and removes you from further gains if the rally continues — rebalancing based on a target weight is different from panic-selling based on a feeling.
Mistake 3: Going all-in on a single hot sector or stock. A record-high market often has a narrow group of leaders — in this rally, Singapore’s banks. Concentrating new money entirely in whatever has led the recent run adds risk exactly when valuations for that group are richest.
Mistake 4: Ignoring your emergency fund to chase the rally. New money that should be sitting in an emergency fund or short-term instrument doesn’t become “safer” to invest just because markets are strong. Keep that separation regardless of what the STI is doing.
Ready to Invest, Regardless of Headlines?
Open an account and use these referral codes for sign-up perks on your first qualifying deposit.
Frequently Asked Questions
Is it too late to invest in Singapore now that the STI is at a record high?
No single data point supports that. The STI has spent much of July 2026 at record levels, but historically, markets sit at all-time highs roughly a third of the time, and returns in the year after a new high have not been meaningfully worse than at other times. Waiting indefinitely for a pullback carries its own real cost.
What does history say about investing when the stock market hits an all-time high?
Analysis of S&P 500 data from 1950-2025 by RBC Global Asset Management found average 12-month returns after a new all-time high were 10.4%, slightly above the 8.8% average at other times. Five-year returns showed a smaller, reversed gap. Neither suggests buying at a record is a mistake.
Should I invest a lump sum now or spread it out with dollar-cost averaging?
Historical research from Vanguard found lump-sum investing outperformed dollar-cost averaging in 75%-90% of periods, depending on portfolio mix, because markets rise more often than they fall. DCA remains a reasonable choice if a sudden drop right after investing would genuinely make you panic-sell.
What happened to CPF interest rates in the third quarter of 2026?
No change. The CPF Ordinary Account rate stays at its 2.5% per annum floor, and Special, MediSave, and Retirement Account monies continue earning the 4% floor rate for 1 July to 30 September 2026, per the CPF Board’s official announcement.
How do I know if my portfolio needs rebalancing after a market rally?
Check your current asset allocation against your original target. A common rule of thumb is to rebalance once any asset class has drifted more than 5 percentage points from its target weight, reviewed once or twice a year.
Where should I park money I'll need in the next 1-2 years instead of investing it?
Short-term money is generally better suited to Singapore Savings Bonds, T-bills, or high-yield savings accounts than to equities, regardless of what the STI is doing — a record-high market is not the environment to take on new short-term equity risk.
Does a record-high STI mean Singapore stocks are overvalued?
Not necessarily. A rising index level reflects price growth, not valuation by itself — valuation depends on earnings and other fundamentals too. Banks have driven much of the 2026 rally; check individual valuation metrics rather than assuming the index level alone signals overvaluation.
Not financial advice. Data verified as at 31 July 2026 against the CPF Board’s official Q3 2026 interest rate announcement, RBC Global Asset Management’s published analysis of S&P 500 data, Vanguard’s dollar-cost-averaging research as cited by AAII, and Nakitte/TradingView STI market data. STI figures move daily and may differ from the levels shown here by the time you read this. The Kopi Notes may earn referral fees when you sign up using our codes.
This article was researched with the help of AI. While we strive to keep all information accurate and up to date, there may be errors. If you notice any discrepancies, please contact us.