VWRA Historical Returns: Annual Performance & CAGR Since 2019
What the Vanguard FTSE All-World UCITS ETF has actually returned since its July 2019 inception — official rolling 12-month data, since-inception CAGR, and how it stacks up against CSPX.
VWRA (Vanguard FTSE All-World UCITS ETF, USD Accumulating) has returned 12.93% annualised since its 23 July 2019 inception, turning a notional USD 10,000 into roughly USD 23,980 by 30 September 2026 — a cumulative gain of about 140%. Along the way it swung from +31.47% in one 12-month period to -20.59% in another, which is the real story behind the headline average.
Not financial advice. All figures are sourced directly from Vanguard’s and iShares’ official fund factsheets and are for educational reference only. Data as at 30 September 2026 unless otherwise stated.
Table of Contents
Contents — Click to expand
What Is VWRA?
VWRA is the London Stock Exchange, USD-denominated, accumulating share class of the Vanguard FTSE All-World UCITS ETF (ISIN IE00BK5BQT80). It tracks the FTSE All-World Index, a market-cap-weighted benchmark of roughly 4,200 large and mid-cap stocks across developed and emerging markets — effectively the entire global investable equity universe in one fund. VWRA itself held 3,821 stocks as at 30 September 2026, with a total expense ratio (TER) of 0.14% p.a.
The fund was incepted on 23 July 2019, is domiciled in Ireland under UCITS rules, and is managed by Vanguard Asset Management, Limited. It uses physical replication through optimised sampling rather than holding every index constituent, and — because it is an accumulating share class — dividends are reinvested automatically rather than paid out. Total assets across all VWRA/VWRP/VWCE share classes stood at USD 87.29 billion as at 30 September 2026, according to Vanguard’s official VWRA fund factsheet, making it one of the largest globally diversified UCITS ETFs available to Singapore investors on the LSE. For how this compares against the narrower, US-only CSPX, VWRA and LSE ETFs framework, Singapore investors typically hold one or both as their core equity allocation.
As at 28 October 2026, VWRA’s NAV was USD 191.52, within a 52-week range of USD 161.35 to USD 195.62 — itself a reminder of how much a “global equity ETF” can move in a single year even while tracking its index almost perfectly (more on tracking accuracy below).
VWRA’s Rolling 12-Month Returns Since Inception
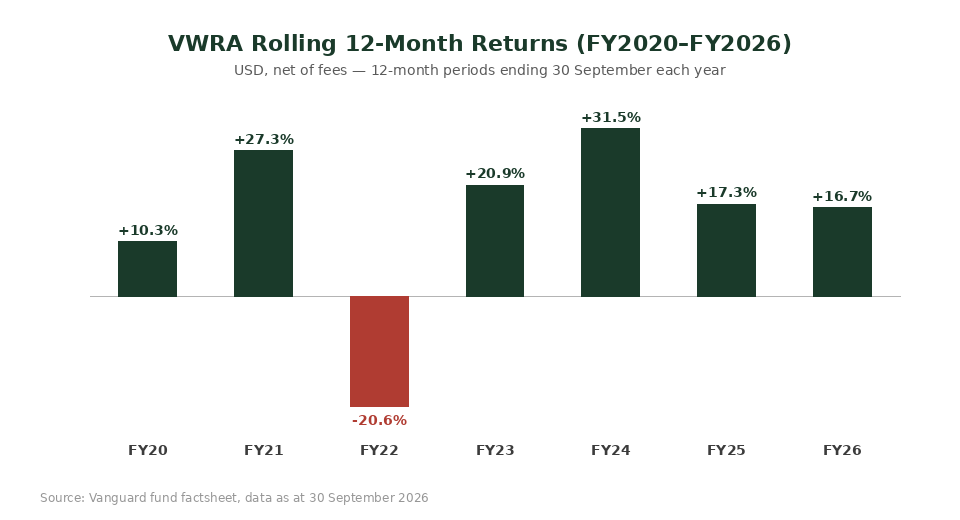
Vanguard does not publish VWRA’s performance as neat calendar-year figures in its factsheet. Instead, it discloses rolling 12-month periods ending each 30 September — which is actually more useful for understanding real-world volatility, because it shows what an investor who bought at different points in the year would have experienced. The table below is taken directly from Vanguard’s official VWRA factsheet.
| 12-Month Period | VWRA (Net of Fees) | FTSE All-World Index (Benchmark) |
|---|---|---|
| Oct 2019 – Sep 2020 (FY20) | +10.32% | +10.31% |
| Oct 2020 – Sep 2021 (FY21) | +27.34% | +27.41% |
| Oct 2021 – Sep 2022 (FY22) | -20.59% | -20.59% |
| Oct 2022 – Sep 2023 (FY23) | +20.90% | +20.89% |
| Oct 2023 – Sep 2024 (FY24) | +31.47% | +31.56% |
| Oct 2024 – Sep 2025 (FY25) | +17.32% | +17.32% |
| Oct 2025 – Sep 2026 (FY26) | +16.71% | +16.66% |
Source: Vanguard VWRA fund factsheet, data as at 30 September 2026.
Four things stand out. First, VWRA tracks its benchmark almost perfectly — the gap between fund and index in any given year is a few hundredths of a percentage point, confirming Vanguard’s optimised-sampling approach works as intended (see the CSPX & VWRA tracking difference guide for why your UCITS ETF doesn’t match the index to the decimal). Second, the single worst 12-month stretch in VWRA’s six-year-plus history was the FY22 period (October 2021 to September 2022), when rising interest rates and a bear market in growth stocks drove a -20.59% decline. Third, the recovery afterwards was dramatic: the following 12-month period, FY24, delivered +31.47%, more than reversing the prior loss. Fourth, the most recent three years (FY24–FY26) have each been comfortably double-digit, averaging around 21.8% annually on a simple basis — well above VWRA’s long-run trend.
VWRA vs CSPX: Annualised Returns Compared
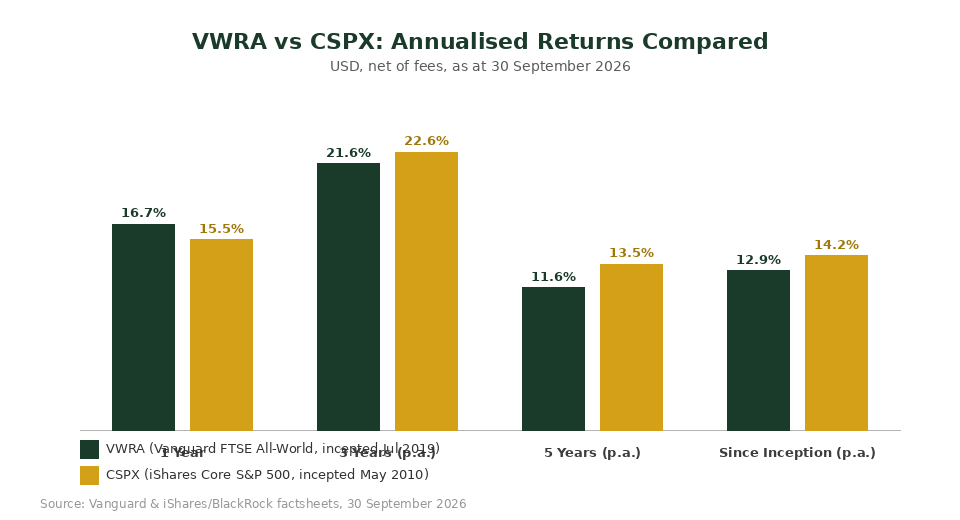
Because CSPX (the iShares Core S&P 500 UCITS ETF) tracks a narrower, US-only index while VWRA tracks roughly 4,200 stocks globally, the two have diverged meaningfully over different horizons — but perhaps by less than investors assume, given VWRA is still about 60% weighted to the US. The table and chart below use each fund’s own officially published annualised figures from the iShares CSPX fund factsheet, as at 30 September 2026.
| Period | VWRA (p.a.) | CSPX (p.a.) | Winner |
|---|---|---|---|
| 1 Year | 16.71% | 15.47% | VWRA |
| 3 Years | 21.65% | 22.57% | CSPX |
| 5 Years | 11.56% | 13.48% | CSPX |
| Since Inception | 12.93% (from Jul 2019) | 14.16% (from May 2010) | CSPX* |
*Since-inception figures are not a fair apples-to-apples comparison — CSPX’s clock started in May 2010, VWRA’s in July 2019, so the periods capture different market cycles. Source: Vanguard VWRA factsheet and iShares CSPX factsheet, both data as at 30 September 2026.
Over the 1-year window, VWRA’s global diversification actually edged out CSPX, because non-US markets (Japan, Taiwan, UK, Europe) contributed positively alongside US mega-cap tech. Over 3 and 5 years, CSPX’s US concentration has paid off given how dominant US equities — and specifically the “Magnificent Seven” style mega-caps that both funds hold heavily anyway — have been in this period. VWRA’s 1.1 percentage-point edge over CSPX in the trailing year narrows the long-run gap but does not close it; CSPX remains ahead on both the 3-year and 5-year annualised figures.
Reading the Numbers: CAGR, Tracking Error & Drawdown
A few terms matter here and are routinely conflated by first-time ETF investors. CAGR (compound annual growth rate) is the single smoothed rate that, applied every year, would get you from the starting value to the ending value — it is not the average of the yearly returns, which is always a higher (and misleading) number when returns are volatile. VWRA’s since-inception CAGR of 12.93% is a geometric average across a period that included one -20.59% year and one +31.47% year; a simple arithmetic average of VWRA’s rolling 12-month figures above would overstate the true compounding experience.
Tracking error measures how closely the fund follows its benchmark day-to-day. VWRA’s annualised tracking error was just 0.07% over 1 and 3 years and 0.08% over 5 years as at 30 September 2026 — extremely tight, and part of why Vanguard is one of the two dominant providers Singapore investors default to alongside iShares. A low TER (0.14% p.a.) and tight tracking error together mean very little performance is lost to fund mechanics; almost all of VWRA’s return variation comes from the market itself, not from fund management slippage.
Maximum drawdown is the worst peak-to-trough decline an investor would have experienced if they bought at the worst possible moment and sold at the worst possible moment afterwards. Third-party tracking (justETF) puts VWRA’s maximum drawdown since inception at roughly -33%, which lines up with the FY22 rolling-return figure above plus the sharper short-term drop that preceded it. This is the number that matters most for anyone deciding how much of their portfolio to hold in a single globally diversified equity ETF rather than splitting across asset classes — see our Singapore retirement calculator for modelling different equity allocations against a retirement timeline.
What Drove the Big Swings
The FY22 drawdown (October 2021 to September 2022) coincided with the fastest US interest rate hiking cycle in decades, which hit long-duration growth and technology stocks — a meaningful chunk of VWRA’s top holdings — disproportionately hard, on top of a broader de-rating across global equities as the “cheap money” era of the prior decade reversed. Both VWRA and its benchmark fell by exactly the same -20.59%, underlining that this was a market-wide move, not a fund-specific issue.
The subsequent FY24 rebound (+31.47%) reflects the 2023–2024 “AI capex supercycle” rally, during which US mega-cap technology names — many of which sit at the top of VWRA’s holdings list alongside NVIDIA, Apple, Microsoft, Amazon and Alphabet — re-rated sharply on expectations of AI-driven earnings growth. Because VWRA is roughly 60% US-weighted and its top-10 holdings mirror the same mega-cap names that dominate CSPX, the two funds’ big up and down years tend to move in the same direction even though their long-run returns diverge.
A Worked Example: Compounding Since Inception
Here is the calculation behind the opening paragraph, shown step by step so it isn’t just a quoted number. VWRA’s inception date is 23 July 2019; as at 30 September 2026, that is approximately 7.19 years. Vanguard’s published since-inception annualised return is 12.93% p.a. (net of the 0.14% TER). Compounding that rate: (1.1293)^7.19 ≈ 2.398, meaning a USD 10,000 lump sum invested at inception would be worth approximately USD 23,980 today — a cumulative gain of around 139.8%, with zero manual rebalancing required because this is an accumulating share class.
Scaled up: a Singapore investor who converted SGD 64,500 into roughly USD 50,000 (at an indicative rate of SGD 1.29 per USD, late October 2026) at VWRA’s inception would be holding approximately USD 119,900 today — before accounting for the bid-ask spread and FX conversion cost on entry, which our VWRA liquidity and bid-ask spread guide covers in detail, and before any currency movement between SGD and USD over the holding period, which our VWRA currency risk guide addresses separately. This figure is a single lump-sum scenario, not a regular savings plan (RSP) outcome — an investor who dollar-cost-averaged into VWRA monthly since 2019 would have a different (and path-dependent) result, since they would have bought fewer units during the FY24 rally and relatively more during the FY22 drawdown.
Does Past Performance Predict the Future?
No — and Vanguard says so explicitly on every factsheet page: “past performance is not a reliable indicator of future results.” VWRA’s 12.93% since-inception CAGR was earned over a specific seven-year window that included a global pandemic recovery, the fastest rate-hiking cycle in forty years, and an unusually concentrated AI-driven equity rally. None of those conditions are guaranteed to repeat, and long-run historical equity return expectations (closer to 7–8% real for global equities over multi-decade periods) are meaningfully lower than what VWRA has delivered since 2019.
What the data above does show reliably is tracking quality (VWRA has consistently delivered what its index delivered, minus a small, predictable TER) and volatility range (a globally diversified equity ETF can still lose over 20% in a single year). Both of those facts should inform position-sizing and time horizon decisions more than the headline CAGR number itself. For a broader view of how ETFs fit alongside other Singapore investment options, see our Singapore REIT ETF guide for an income-generating complement to a growth-oriented global equity core.
Frequently Asked Questions
What has VWRA returned since inception?
VWRA has returned 12.93% annualised (CAGR) from its 23 July 2019 inception to 30 September 2026, according to Vanguard’s official fund factsheet. That compounds to a cumulative gain of roughly 139.8% over the period, net of the fund’s 0.14% TER. This figure reflects a specific historical window and is not a guarantee of future returns.
What was VWRA's worst year?
VWRA’s worst 12-month period since inception was October 2021 to September 2022 (Vanguard’s fiscal-year reporting window), when the fund fell -20.59% alongside its benchmark. This coincided with the US Federal Reserve’s rapid interest rate hiking cycle and a global de-rating of growth and technology stocks. It remains the only double-digit negative 12-month period in VWRA’s history to date.
Is VWRA's CAGR the same as its average annual return?
No. CAGR (compound annual growth rate) is a geometric average that accounts for compounding and volatility drag, while a simple average of yearly returns ignores both. Because VWRA’s rolling 12-month returns ranged from -20.59% to +31.47%, a simple average of those figures would overstate the true return an investor actually experienced. The 12.93% since-inception figure Vanguard publishes is the CAGR, which is the correct number to use for any compounding calculation.
How does VWRA's performance compare to CSPX?
As at 30 September 2026, VWRA’s 1-year return (16.71%) was slightly ahead of CSPX’s (15.47%), but CSPX led on both the 3-year annualised figure (22.57% vs 21.65%) and the 5-year annualised figure (13.48% vs 11.56%). Since-inception figures are not directly comparable because CSPX launched in May 2010 and VWRA in July 2019, covering different market cycles. Singapore investors often hold both as complementary — not competing — core holdings.
Does VWRA track its index accurately?
Yes. VWRA’s annualised tracking error against the FTSE All-World Index was just 0.07% over 1 and 3 years and 0.08% over 5 years, as at 30 September 2026. In practice this means the fund’s return in any given year differs from its benchmark by only a few hundredths of a percentage point — most of that gap is explained by the 0.14% TER itself.
Can I use VWRA's historical returns to project my retirement savings?
You can use it as one data point, but it should not be your sole assumption. VWRA’s since-inception CAGR of 12.93% was earned during an unusually strong period for global equities and is well above long-run historical averages for diversified equity portfolios (closer to 7–8% real over multi-decade periods). A more conservative long-run assumption, stress-tested against a scenario resembling VWRA’s FY22 drawdown, will give a more realistic retirement projection than extrapolating the last seven years forward.
Ready to Start Investing in Global ETFs?
Open a brokerage account and build your own globally diversified core with VWRA. Use our referral links for exclusive sign-up offers.
This article was researched with the help of AI. While we strive to keep all information accurate and up to date, there may be errors. If you notice any discrepancies, please contact us.