CSPX & VWRA Tracking Difference Explained: Why Your UCITS ETF Doesn’t Match the Index Exactly (2026 Guide)
What iShares and Vanguard’s own factsheets show about the real gap between fund returns and index returns — and why CSPX has actually beaten the S&P 500 every year since 2016.
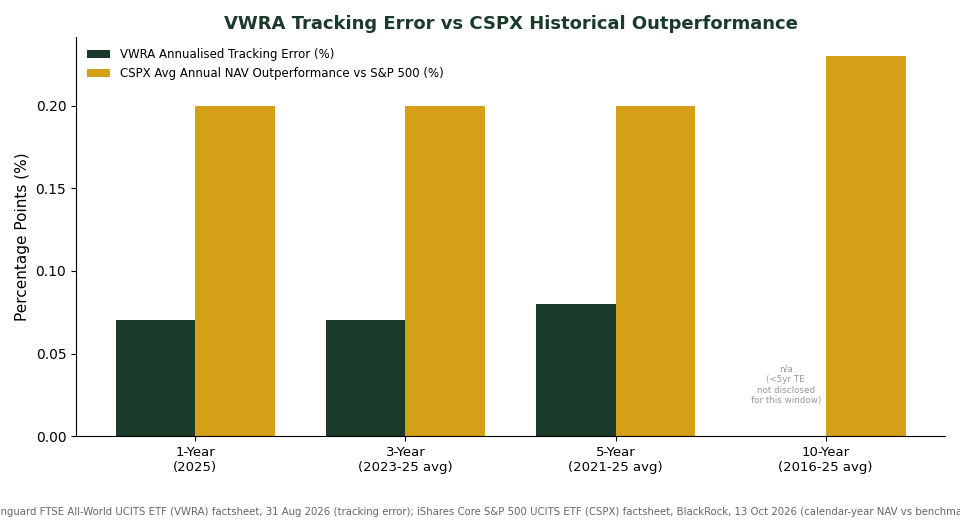
CSPX and VWRA rarely track their index to the decimal. iShares’ own factsheet shows CSPX has outperformed the S&P 500 by roughly 0.2–0.3 percentage points every calendar year since 2016, while Vanguard discloses VWRA’s annualised tracking error at 0.07–0.08% over 1, 3 and 5 years. The gap comes from securities lending income, sampling methodology, and withholding tax timing — not fund manager error.
Not financial advice. All figures are for educational reference only. Data as at Q4 2026 unless noted — verified against the iShares CSPX factsheet (13 Oct 2026) and Vanguard VWRA factsheet (31 Aug 2026).
Table of Contents
Contents — Click to expand
- Why Tracking Difference Matters More Than the TER Sticker Price
- Tracking Difference vs Tracking Error: What’s the Difference?
- CSPX’s 10-Year Tracking Record: The Real iShares Data
- VWRA’s Tracking Error: Why Sampling Isn’t the Same as Replication
- Why Some UCITS ETFs Beat Their Index: Securities Lending Explained
- What This Means for a Singapore Investor’s Portfolio
- What to Actually Check Before You Buy an ETF
- Frequently Asked Questions
Why Tracking Difference Matters More Than the TER Sticker Price
Most Singapore investors comparing CSPX and VWRA stop at the Total Expense Ratio (TER) — 0.07% for CSPX, 0.14% for VWRA — and assume that number is exactly how much the fund will lag its benchmark each year. It isn’t. The TER is only one input into what actually matters: tracking difference, the real annual gap between the fund’s net asset value (NAV) return and the index return it is meant to replicate.
This matters because tracking difference can be negative (the fund underperforms by more than the TER implies), roughly equal to the TER, or — as the data below shows for CSPX — actually positive, where the fund beats its own benchmark despite charging a fee. A UCITS ETF investor who only checks the TER on a fund factsheet before buying is missing the one number that tells you whether the fee is the whole story or only part of it.
For Singapore investors building a core portfolio around a handful of UCITS ETFs for decades, a persistent 0.1–0.3 percentage point difference compounds meaningfully. On a SGD 100,000 position held for 20 years, a sustained 0.2 percentage point annual gap compounds to roughly SGD 4,000–5,000 in cumulative difference — larger than most people expect from what looks like a rounding error on a factsheet.
Tracking Difference vs Tracking Error: What’s the Difference?
These two terms are often used interchangeably but measure different things, and fund providers disclose them differently:
- Tracking difference is the actual annual gap between the fund’s return and the index’s return over a specific period — a single number per year, e.g. “+0.2% in 2025.” It captures everything: the TER, securities lending income, dividend reinvestment timing, withholding tax drag, and sampling effects, all netted together.
- Tracking error is a statistical measure (the standard deviation of the daily or monthly return differences between fund and index) — it tells you how volatile or consistent the tracking is, not whether the fund is ahead or behind. A low tracking error with a negative tracking difference means the fund consistently underperforms by a small, predictable amount. A low tracking error with a positive tracking difference — CSPX’s case — means the fund consistently and reliably beats its benchmark by a small amount.
iShares discloses tracking difference implicitly through its calendar-year performance table (fund NAV return vs benchmark return, side by side). Vanguard discloses tracking error explicitly as an annualised statistic (1-year, 3-year, 5-year) but does not publish a simple fund-vs-index calendar year table for VWRA in the way iShares does for CSPX. This asymmetry in disclosure is itself worth knowing before you compare the two providers’ numbers directly.
CSPX’s 10-Year Tracking Record: The Real iShares Data
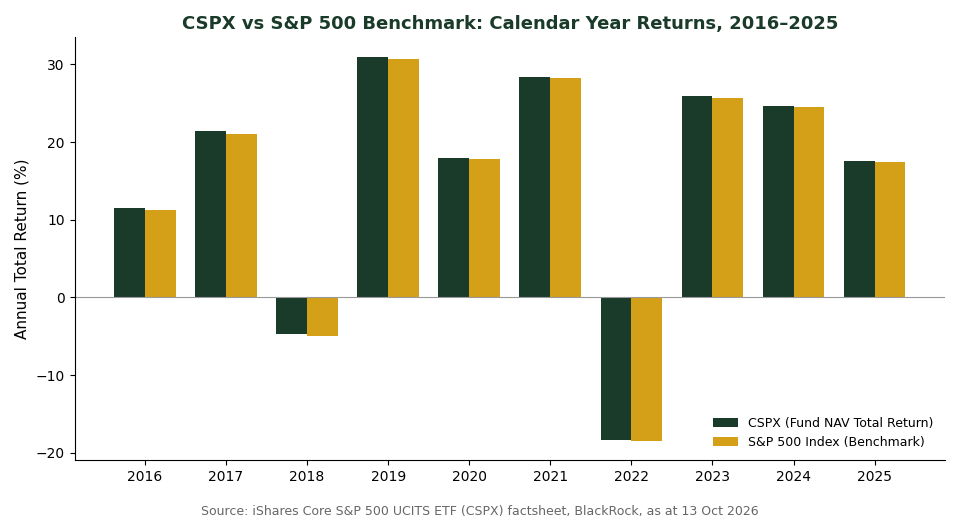
CSPX (iShares Core S&P 500 UCITS ETF, ISIN IE00B5BMR087) uses full physical replication — it holds all 504 constituents of the S&P 500 directly, with no sampling. According to the iShares factsheet (BlackRock, as at 13 Oct 2026), the fund’s calendar-year NAV total return has beaten its own S&P 500 benchmark in every single year from 2016 to 2025 — ten consecutive years:
| Year | CSPX NAV Return | S&P 500 Benchmark | Tracking Difference |
|---|---|---|---|
| 2016 | 11.5% | 11.2% | +0.3% |
| 2017 | 21.4% | 21.1% | +0.3% |
| 2018 | -4.7% | -4.9% | +0.2% |
| 2019 | 31.0% | 30.7% | +0.3% |
| 2020 | 18.0% | 17.8% | +0.2% |
| 2021 | 28.4% | 28.2% | +0.2% |
| 2022 | -18.3% | -18.5% | +0.2% |
| 2023 | 25.9% | 25.7% | +0.2% |
| 2024 | 24.7% | 24.5% | +0.2% |
| 2025 | 17.6% | 17.4% | +0.2% |
Source: iShares Core S&P 500 UCITS ETF (CSPX) factsheet, BlackRock, as at 13 Oct 2026.
Averaged across the full decade, that’s a tracking difference of +0.23 percentage points per year in CSPX’s favour — despite the fund charging a 0.07% TER. In other words, an investor holding CSPX didn’t just avoid losing 0.07% a year to fees; they came out roughly 0.23% a year ahead of the raw S&P 500 index return, net of all costs. This is the single most useful number on the entire factsheet, and it almost never appears in comparison articles that only quote the TER.
VWRA’s Tracking Error: Why Sampling Isn’t the Same as Replication
VWRA (Vanguard FTSE All-World UCITS ETF, ISIN IE00BK5BQT80) is structurally different from CSPX in one important way: it uses sampling, not full physical replication. The FTSE All-World Index contains roughly 4,263 constituents (as at 31 Aug 2026), but VWRA holds only about 3,784 stocks — a deliberate statistical sample chosen to closely mirror the index’s country, sector, and factor characteristics without the operational cost and complexity of holding every single micro-cap constituent across dozens of emerging markets.
Vanguard’s own factsheet discloses this clearly as an annualised tracking error rather than a calendar-year tracking difference table:
| Period | Annualised Tracking Error |
|---|---|
| 1-Year | 0.07% |
| 3-Year | 0.07% |
| 5-Year | 0.08% |
Source: Vanguard FTSE All-World UCITS ETF (USD Accumulating / VWRA) factsheet, as at 31 Aug 2026.
A tracking error this low (well under 0.1%) tells you the sampling strategy is working as intended — VWRA’s country and sector weights sit within fractions of a percent of the benchmark across almost every major market (for example, 61.68% US exposure in the fund vs 61.71% in the index as at 31 Aug 2026). Vanguard’s own factsheet does not publish a VWRA-specific calendar-year fund-vs-benchmark table in the way iShares does, which is why Singapore comparison articles usually quote VWRA’s TER (0.14%) as a proxy for cost and leave it there — but tracking error, not TER alone, is the number that confirms the sampling approach isn’t quietly drifting away from the index over time.
Why Some UCITS ETFs Beat Their Index: Securities Lending Explained
It seems counterintuitive that a fund charging a fee could outperform the very index it’s meant to copy, net of that fee. Three mechanics explain it, and they apply differently to CSPX and VWRA:
1. Securities Lending Income
Both iShares and Vanguard lend out a portion of the physical shares they hold to short-sellers and other institutional borrowers, who pay a lending fee. This income is returned to the fund (iShares funds retain 62.5% of lending income; BlackRock keeps 37.5% and covers the operational cost), partially offsetting the TER. On CSPX specifically, however, iShares discloses a securities lending return of 0.00% for the year to 30 June 2026 — meaning for this particular fund in this period, lending income was not the main driver of the outperformance. The gap is more likely explained by the next two factors.
2. Benchmark Construction and Dividend Timing
The “benchmark” a fund tracks (e.g. the S&P 500 Total Return Index) typically assumes dividends are reinvested instantly and without any tax drag — an idealised, theoretical calculation. A real fund has to actually receive dividends, pay any applicable withholding tax, and then physically reinvest the cash, which happens with a short lag and occasionally at slightly different prices than the index’s theoretical reinvestment point. Depending on market conditions in that window, this can work in the fund’s favour or against it.
3. Optimised Trading and Sampling
For sampling-based funds like VWRA, portfolio managers can sometimes achieve marginally better execution prices than a naive full-replication approach would, by trading in more liquid proxy stocks rather than illiquid micro-caps — though this cuts both ways and is reflected in the tracking error statistic rather than a clean outperformance number.
The practical takeaway: a consistently positive tracking difference (like CSPX’s) is a genuine, repeatable structural feature of a specific fund’s portfolio management — not a marketing claim — but it is specific to that fund and that period. Nothing here guarantees future outperformance will match the historical 0.2–0.3 percentage point range.
What This Means for a Singapore Investor’s Portfolio
For a Singapore investor holding CSPX through Syfe, IBKR, or another broker offering LSE access, the historical +0.23 percentage point average annual tracking difference is a real, measurable tailwind on top of the already-favourable 15% US dividend withholding tax treaty rate for Ireland-domiciled funds (versus 30% for US-domiciled equivalents like VOO). On a SGD 100,000 CSPX position, a sustained 0.2 percentage point annual edge works out to roughly SGD 200 a year in additional NAV growth beyond what the headline TER alone would suggest — small in any single year, but compounding meaningfully across a multi-decade retirement portfolio.
This data point is specific to CSPX’s actual portfolio management — it is not a general feature of all S&P 500 UCITS ETFs. A Singapore investor comparing CSPX against alternatives such as SPYL or VUAA should pull each fund’s own factsheet and check its calendar-year tracking record, not assume the same outperformance applies, since each issuer runs its own securities lending programme and reinvestment process.
VWRA’s very low 0.07–0.08% tracking error is reassuring for a different reason: it confirms Vanguard’s sampling methodology for a 3,784-stock portfolio tracking a 4,263-stock index is staying tightly aligned to the FTSE All-World benchmark’s country and sector weights, which matters more for a globally diversified core holding than chasing a small outperformance figure. Neither fund is “better” purely because of these numbers — they measure different things for ETFs with different roles (US large-cap core vs global all-world core).
What to Actually Check Before You Buy an ETF
Most Singapore ETF comparison content stops at the TER. Before buying any UCITS ETF on the LSE, Singapore investors should also pull up the issuer’s own factsheet and check:
- Calendar-year fund return vs benchmark return (if disclosed, as iShares does) — this is the actual tracking difference, the single most informative number.
- Annualised tracking error (1/3/5-year, as Vanguard discloses) — tells you how consistent the tracking has been, especially important for sampling-based funds.
- Replication method — full physical replication (like CSPX) vs optimised sampling (like VWRA) — neither is inherently superior, but it changes what you should expect to see.
- Securities lending return — disclosed by iShares as a specific percentage; a meaningful source of offsetting income for some funds, negligible for others (as with CSPX’s 0.00% in the year to 30 Jun 2026).
This data sits in the “Performance” and “Key Facts” tabs of the iShares and Vanguard product pages, updated regularly — it takes under five minutes to check and is far more informative than relying on a blog’s TER comparison table alone (including this one — always verify against the live factsheet before making a decision, since fund data changes over time).
For a structured starting point, Singapore investors building a core-satellite portfolio around CSPX and VWRA may also want to run the numbers through a Singapore retirement calculator to see how a sustained 0.1–0.2 percentage point annual difference compounds over a 20–30 year investing horizon, and review a broader CPF investment strategy if SRS or CPF-eligible platforms are part of the plan.
Not financial advice. Past tracking performance is not indicative of future tracking performance — the figures in this article reflect historical fund data as disclosed by iShares and Vanguard and should be re-verified against the current factsheet before any investment decision.
Frequently Asked Questions
What is tracking difference on an ETF like CSPX or VWRA?
Tracking difference is the actual annual gap between a fund’s net asset value (NAV) return and the return of the index it tracks. It reflects the TER plus other factors like securities lending income, dividend reinvestment timing, and withholding tax drag, all netted together. For CSPX, iShares’ own factsheet shows this difference has been positive — the fund beating the S&P 500 — in every calendar year from 2016 to 2025.
Is tracking difference the same as tracking error?
No. Tracking difference tells you whether a fund is ahead of or behind its benchmark, and by how much, in a given year. Tracking error is a statistical measure of how consistent or volatile that gap is over time, expressed as a standard deviation. VWRA’s Vanguard factsheet discloses a 1-year, 3-year and 5-year annualised tracking error of 0.07–0.08%, which shows the fund’s sampling strategy stays tightly aligned to the FTSE All-World Index, but it doesn’t by itself tell you whether VWRA is ahead of or behind the index in dollar terms.
Why does CSPX outperform the S&P 500 if it charges a 0.07% fee?
CSPX uses full physical replication, holding all 504 S&P 500 constituents directly. The small, consistent outperformance shown on the iShares factsheet (roughly +0.2 to +0.3 percentage points per year from 2016–2025) is most likely driven by how the fund’s actual dividend receipt and reinvestment process compares to the index’s theoretical, instantaneous reinvestment assumption — not primarily securities lending, since iShares discloses CSPX’s lending return as 0.00% for the year to 30 June 2026.
Does VWRA's sampling approach mean it tracks the index less accurately than a full-replication fund?
Not materially. VWRA holds around 3,784 of the roughly 4,263 stocks in the FTSE All-World Index, but Vanguard’s factsheet shows country and sector weights within a few basis points of the benchmark (for example, 61.68% US exposure in the fund vs 61.71% in the index), and an annualised tracking error of just 0.07–0.08%. Sampling is a deliberate, well-managed trade-off to avoid the cost of holding every illiquid micro-cap constituent, not a sign of poor tracking.
Where can Singapore investors check an ETF's tracking difference before buying?
Go directly to the issuer’s own product page — ishares.com for CSPX or vanguard.com (or a regional Vanguard site) for VWRA — and open the “Performance” or “Key Facts” tab. iShares publishes a calendar-year fund-vs-benchmark table; Vanguard publishes annualised tracking error. Both are updated regularly and are more reliable than third-party blog comparisons, including this one, which should always be checked against the live factsheet.
Can CPF or SRS funds be used to buy CSPX or VWRA?
CSPX and VWRA are listed on the London Stock Exchange and are not CPF-investable under the CPF Investment Scheme, which restricts CPF Ordinary Account funds to a narrower approved list. SRS funds can be used to buy both, provided your brokerage supports SRS-funded LSE trades — check with your broker directly, as not all platforms offer this.
Ready to Build Your Core ETF Portfolio?
Open a brokerage account and buy CSPX or VWRA today. Use our referral links for exclusive sign-up bonuses.
This article was researched with the help of AI. While we strive to keep all information accurate and up to date, there may be errors. If you notice any discrepancies, please contact us.