Mapletree Industrial Trust Dividend History 2014–2026: Complete DPU Track Record & Yield Analysis
SGX: ME8U | Updated October 2026
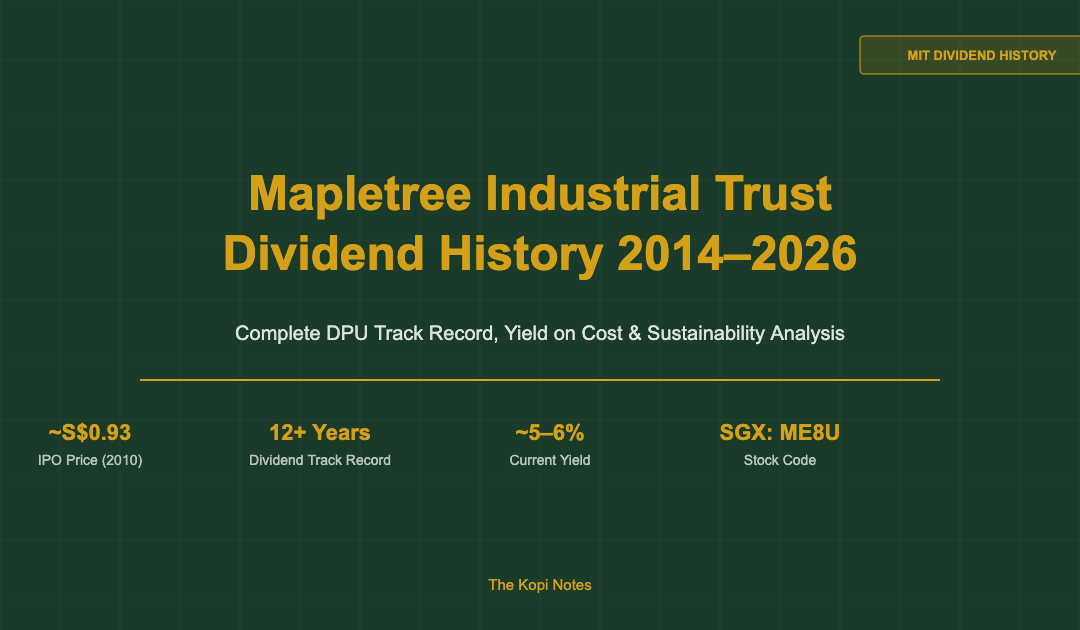
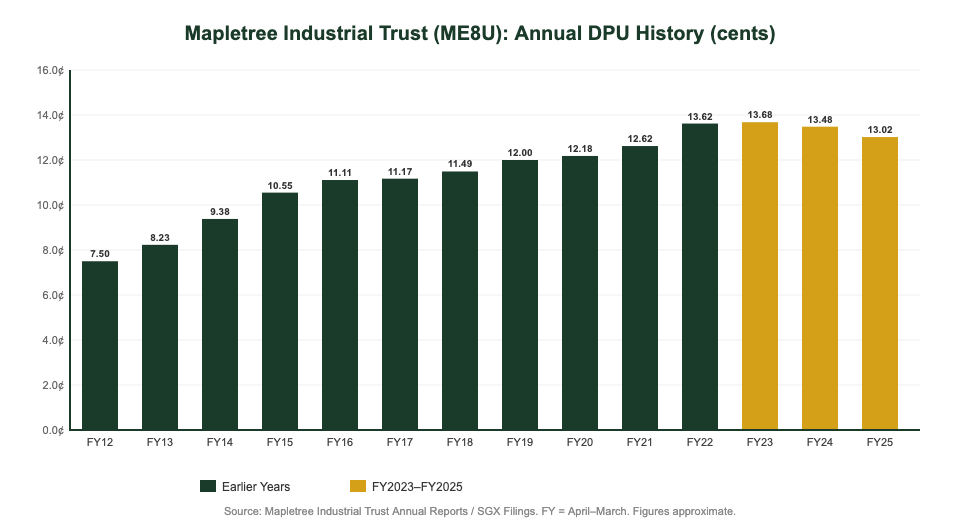
Mapletree Industrial Trust (SGX: ME8U) has paid uninterrupted dividends for over 12 years since its 2010 IPO at S$0.93. Its DPU grew from 7.50 cents in FY2012 to a peak of 13.68 cents in FY2023, representing 82% DPU growth. Long-term investors who bought at IPO now enjoy a yield on cost above 14%, making MIT one of Singapore’s most rewarding industrial REITs for patient dividend investors.
Not financial advice. All figures are for educational reference only. DPU data sourced from Mapletree Industrial Trust Annual Reports and SGX filings. Figures approximate — verify with official reports before investing. Data as at October 2026 unless noted.
MIT at a Glance: Key Facts
Before diving into the DPU history, here’s a quick-reference snapshot of Mapletree Industrial Trust as at October 2026:
| Metric | Detail |
|---|---|
| SGX Ticker | ME8U |
| REIT Manager | Mapletree Industrial Trust Management Ltd |
| Sponsor | Mapletree Investments Pte Ltd (Temasek-linked) |
| IPO Date | 21 October 2010 at S$0.93/unit |
| Portfolio | 140+ properties (Singapore, USA, Japan, Australia) |
| Asset Focus | Data centres, flatted factories, hi-specs industrial |
| Dividend Frequency | Quarterly (paid ~2 months after quarter-end) |
| Current Yield (est.) | ~5.5% at current price |
| Gearing (FY2025) | ~36.7% (below 45% MAS limit) |
Source: Mapletree Industrial Trust, SGX filings, October 2026. Figures approximate.
MIT has evolved significantly from a pure Singapore industrial landlord into a diversified portfolio with a strong data centre component — particularly in the United States. This transformation has been the primary engine of its DPU growth story.
MIT DPU History Year by Year (FY2012–FY2025)
MIT’s financial year runs from 1 April to 31 March. The table below captures 14 years of DPU data — one of the longest unbroken dividend track records among Singapore industrial REITs.
| Financial Year | Annual DPU (cents) | YoY Change | Key Event |
|---|---|---|---|
| FY2011/12 | 7.50¢ | — | First full-year DPU post-IPO |
| FY2012/13 | 8.23¢ | +9.7% | Phase 8 development completed |
| FY2013/14 | 9.38¢ | +14.0% | Hi-tech building acquisitions |
| FY2014/15 | 10.55¢ | +12.5% | Mapletree Sunview 1 & 2 added |
| FY2015/16 | 11.11¢ | +5.3% | Industrial space demand softens |
| FY2016/17 | 11.17¢ | +0.5% | Flatted factory supply headwind |
| FY2017/18 | 11.49¢ | +2.9% | 18 Tai Seng development |
| FY2018/19 | 12.00¢ | +4.4% | US data centres (14 properties) |
| FY2019/20 | 12.18¢ | +1.5% | Pre-COVID stability |
| FY2020/21 | 12.62¢ | +3.6% | Data centres resilient during COVID |
| FY2021/22 | 13.62¢ | +7.9% | Largest DPU jump — US DC expansion |
| FY2022/23 | 13.68¢ | +0.4% | Peak DPU; rising US interest rate pressure begins |
| FY2023/24 | 13.48¢ | -1.5% | Higher US borrowing costs, USD hedging |
| FY2024/25 | 13.02¢ | -3.4% | US rate headwind persists; Fed cuts begin late 2025 |
Source: Mapletree Industrial Trust Annual Reports, SGX filings. FY = April to March. All DPU figures are approximate and may differ slightly from official reports. Always verify with the official MIT investor relations page before making investment decisions.
Key takeaway: MIT’s DPU grew for 12 consecutive years from FY2012 to FY2023 — an exceptional track record. The slight DPU decline in FY2024 and FY2025 reflects the impact of elevated US interest rates on its US data centre debt (originally variable-rate borrowings). As the US Federal Reserve continues its rate-cutting cycle, MIT’s DPU is expected to stabilise and potentially recover.
Yield on Cost: Why Long-Term Holders Benefit Most
One of the most powerful arguments for holding S-REITs like MIT for the long term is the concept of yield on cost. Because MIT has grown its DPU significantly since IPO, investors who bought early now earn a much higher effective yield on their original investment — regardless of what the current market price is.
At FY2025’s DPU of approximately 13.02 cents, here’s how yield on cost stacks up depending on when you entered:
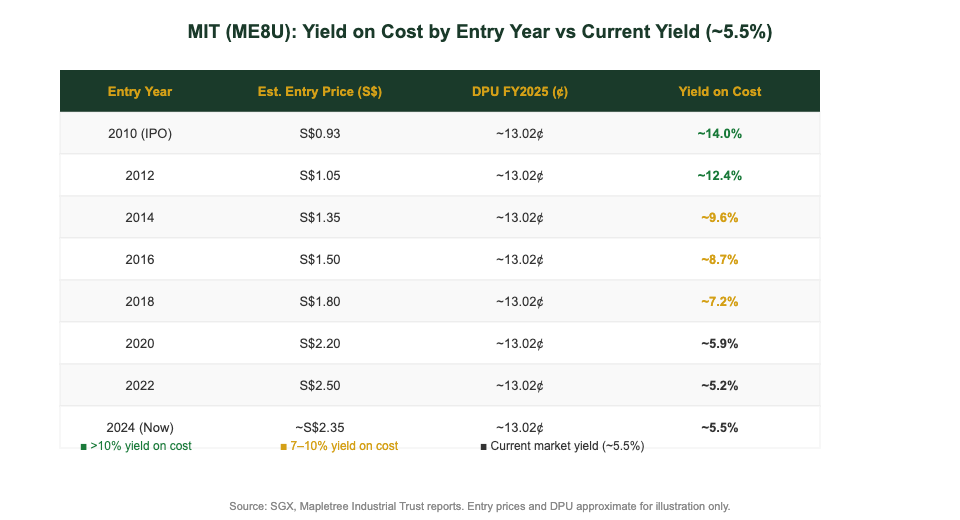
The table shows a compelling case for patient investing in quality S-REITs. An investor who purchased MIT at its IPO price of S$0.93 in 2010 and held through today receives a yield on cost of approximately 14% — nearly three times the current market yield of ~5.5%.
This is why many Singapore dividend investors use Endowus (referral code 2V343) or Syfe (code SRPRFFFCD) for their core S-REIT holdings — the ability to reinvest dividends and dollar-cost average over time compounds the yield on cost benefit significantly. For a Singapore investor holding S$50,000 of MIT units purchased at an average cost of S$1.80 (FY2018 entry), the FY2025 DPU of 13.02 cents would generate approximately S$3,617 in annual dividend income — a real-money illustration of why DPU growth matters more than entry yield alone.
What Drives MIT’s DPU Growth
MIT’s DPU history doesn’t happen by accident. Four structural drivers have powered its dividend growth over 14 years:
1. Data Centre Transformation
When MIT IPO’d in 2010, it was primarily a Singapore flatted factory and light industrial landlord. Beginning in FY2018/19, MIT made a transformational entry into the US data centre market, acquiring 14 data centre assets across the USA. By 2026, data centres represent over 50% of MIT’s asset value and generate significantly higher NPI margins (70%+ vs ~60% for traditional industrial) — directly boosting DPU.
2. Asset Recycling & AEI
MIT regularly undertakes asset enhancement initiatives (AEI) and divests older, lower-yielding assets to redeploy capital into higher-yielding developments. Examples include the redevelopment of Kolam Ayer 2 Cluster (now a hi-spec multi-tenanted building) and the Mapletree Hi-Tech Park at Kallang Way. These active portfolio management moves have improved NPI yields across the portfolio.
3. Rental Reversions in Singapore
MIT’s Singapore industrial portfolio has benefited from positive rent reversions — particularly in hi-specs industrial space and data halls. Occupancy has remained consistently above 93% in Singapore, providing a stable income base. Lease expiries are spread across multiple years, reducing concentration risk to any single renewal cycle.
4. Low Gearing & Sponsor Pipeline
With gearing of approximately 36.7% (well below the 45% MAS limit) and a strong Temasek-linked sponsor in Mapletree Investments, MIT has both the balance sheet headroom and the pipeline access to continue acquiring yield-accretive assets without dilutive equity fundraising. The sponsor holds a significant portfolio of industrial assets that could be injected into MIT over time — a structural long-term DPU growth lever. This was a key takeaway from our earlier MIT gearing analysis.
Is MIT’s DPU Sustainable in 2026?
After two years of mild DPU decline (FY2024 and FY2025), investors understandably ask whether MIT’s dividend is secure. Based on publicly available data, here is a balanced assessment:
Factors supporting DPU stability:
- Distributable income payout ratio: MIT typically pays out 95–100% of distributable income. As long as property income remains stable, DPU is supported.
- Interest rate tailwind: The US Federal Reserve began cutting rates in late 2025. MIT’s US data centre debt — which drove most of the FY2024/25 DPU compression — should benefit from lower refinancing costs in FY2026 and beyond.
- Occupancy buffer: MIT’s Singapore portfolio occupancy sits above 93%, providing a cushion against NPI decline.
- Data centre demand structural tailwind: AI workloads and cloud computing are driving sustained demand for data centre space globally. MIT’s US hyperscale-adjacent data centres are well-positioned to benefit from this megatrend.
Risks to DPU:
- Currency risk: MIT earns income in USD, JPY, and AUD. A weakening USD against SGD reduces SGD-denominated DPU distributions. MIT hedges a portion of its forex exposure, but not all.
- Singapore industrial oversupply: New JTC industrial space supply could pressure flatted factory rents if demand softens — though MIT has been proactively pivoting away from this lower-value segment.
- Refinancing risk: MIT will need to refinance a portion of its debt in FY2026–FY2027. Higher-for-longer rates globally could remain a headwind even if Fed rates ease.
Overall, MIT’s DPU appears sustainable at current levels (~13 cents per year) and has a reasonable path to recovery as US rate headwinds ease. For income investors, the current ~5.5% yield remains competitive relative to Singapore Savings Bonds (now offering sub-3% in the longer tranches) and comparable to retirement income planning benchmarks.
For broader context on Singapore’s fixed-income landscape, see our passive income Singapore 2026 guide.
MIT vs Industrial REIT Peers: Yield & DPU Comparison
How does MIT’s dividend track record stack up against its closest SGX industrial REIT peers? Here’s a snapshot as at October 2026:
| REIT | SGX Ticker | Est. DPU (¢) | Est. Yield | Gearing |
|---|---|---|---|---|
| Mapletree Industrial Trust | ME8U | ~13.02¢ | ~5.5% | ~36.7% |
| CapitaLand Ascendas REIT | A17U | ~16.3¢ | ~5.8% | ~38.3% |
| AIMS APAC REIT | O5RU | ~9.0¢ | ~7.2% | ~34.0% |
| Sabana REIT (Alpha Integrated) | M1GU | ~3.5¢ | ~8.2% | ~33.6% |
| Keppel DC REIT | AJBU | ~10.2¢ | ~4.8% | ~34.2% |
Source: SGX, company announcements, October 2026. All figures are approximate estimates. Always refer to official company announcements and SGX filings for precise figures before investing.
MIT occupies a middle ground: lower yield than smaller industrial REITs like AIMS APAC or Sabana, but offering a higher-quality portfolio with stronger sponsor backing and better portfolio diversification. Its ~5.5% yield compares favourably to Keppel DC REIT (~4.8%) given MIT’s broader sector exposure beyond pure data centres.
For investors seeking to build a diversified S-REIT income portfolio, resources like FSMOne (referral code P0544985) offer commission-free ETF and REIT trading, making it straightforward to accumulate MIT units regularly without excessive transaction costs.
Frequently Asked Questions: MIT Dividend History
What is Mapletree Industrial Trust's (MIT) DPU for FY2025?
When does MIT pay dividends?
What is the yield on cost for MIT IPO investors?
Has MIT ever cut its dividend?
How does MIT's dividend compare to fixed deposits and SSBs?
Which broker is best for buying MIT units in Singapore?
Start Building Your MIT Position Today
Use these platforms to invest in MIT and other top S-REITs with low costs:
Endowus (Code: 2V343)
Syfe (Code: SRPRFFFCD)
FSMOne (Code: P0544985)
This article is for educational purposes only. Not financial advice. Investment in REITs involves risk including possible loss of principal. Past DPU performance is not indicative of future distributions.
This article was researched with the help of AI. While we strive to keep all information accurate and up to date, there may be errors. If you notice any discrepancies, please contact us.