SGX ETF Inflows Hit Record S$20.5 Billion in 2026: What’s Driving the Rush
SGX’s FY2026 report shows ETF assets under management crossing S$20.5 billion, with net inflows up 240% year-on-year — here’s what’s behind the surge and how to invest.
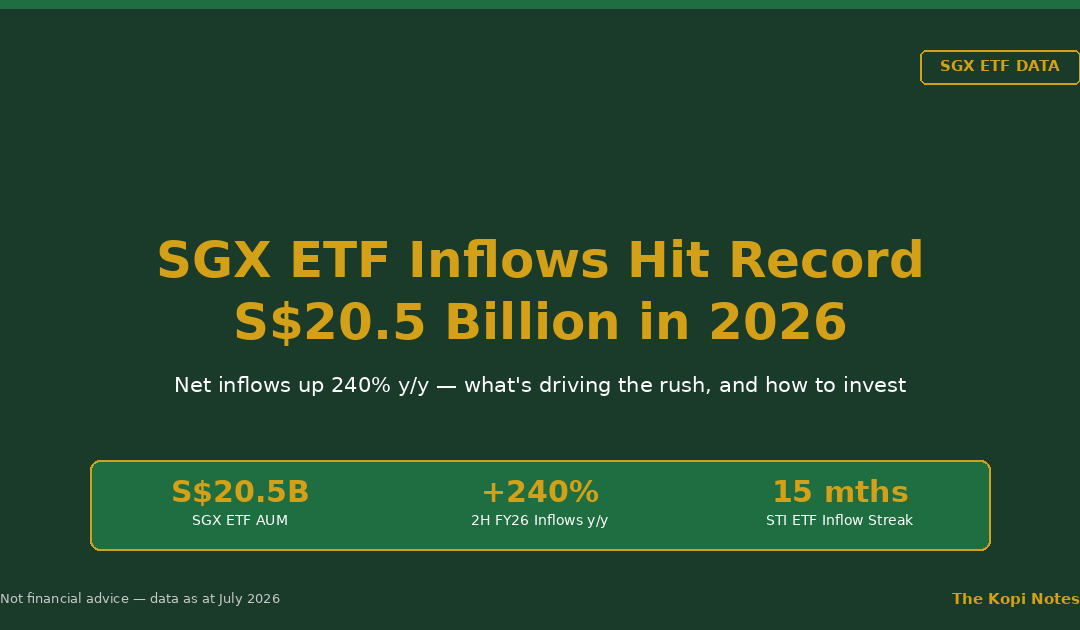
SGX-listed ETF assets under management crossed S$20.5 billion at the end of June 2026, with net inflows up 240% year-on-year in the second half of FY2026, according to SGX Group’s own FY2026 market statistics (published 14 July 2026). STI ETFs led the charge, extending a 15-month inflow streak. Here’s what’s driving the rush, and how you can put your own money to work.
Not financial advice. All figures are for educational reference only. Data as at July 2026 unless noted, sourced from SGX Group’s own FY2026 market statistics report (published 14 July 2026).
- SGX-listed ETF AUM hit S$20.5 billion at end-June 2026, with net inflows up 240% year-on-year in 2H FY2026 (S$2.4 billion)
- STI ETFs (SPDR STI ETF and Nikko AM STI ETF) now hold over S$5 billion combined, extending a 15-straight-month inflow streak
- The rush is being fuelled by the STI’s all-time high of 5,218.96 on 25 June 2026 — but don’t chase the rally blindly, see the risks section before you buy
Table of Contents
Contents — Click to expand
- What Just Happened: SGX’s Record 2026 ETF Numbers
- SGX ETF AUM Hits S$20.5 Billion — Where Is the Money Going?
- Why Are Investors Piling Into ETFs Right Now?
- STI ETFs: 15 Straight Months of Inflows
- Retail vs Institutional: Who’s Actually Buying?
- New Gold & Silver DLCs on ETF Underlyings
- Risks: Don’t Chase the Rally Blindly
- How to Buy SGX-Listed ETFs in Singapore
- Frequently Asked Questions
What Just Happened: SGX’s Record 2026 ETF Numbers
On 14 July 2026, SGX Group released its FY2026 market statistics (covering July 2025 to June 2026). The headline number for ETF investors: SGX-listed exchange-traded fund assets under management (AUM) closed the financial year above S$20.5 billion, with net inflows surging 240% year-on-year in the second half alone.
That is not a typo. AUM, this is basically the total pool of money sitting inside all SGX-listed ETFs, grew faster in the past six months than in the entire prior year combined. For context, SGX also reported record derivatives volume and an all-time high for the Straits Times Index (STI) in the same release. This was a broad-based rally, not a one-off spike in a single fund.
Trading activity followed the same trend. Securities daily average value (SDAV) for ETFs rose 120% year-on-year to about S$50 million during the second half of FY2026, according to the same SGX release.
SGX ETF AUM Hits S$20.5 Billion — Where Is the Money Going?
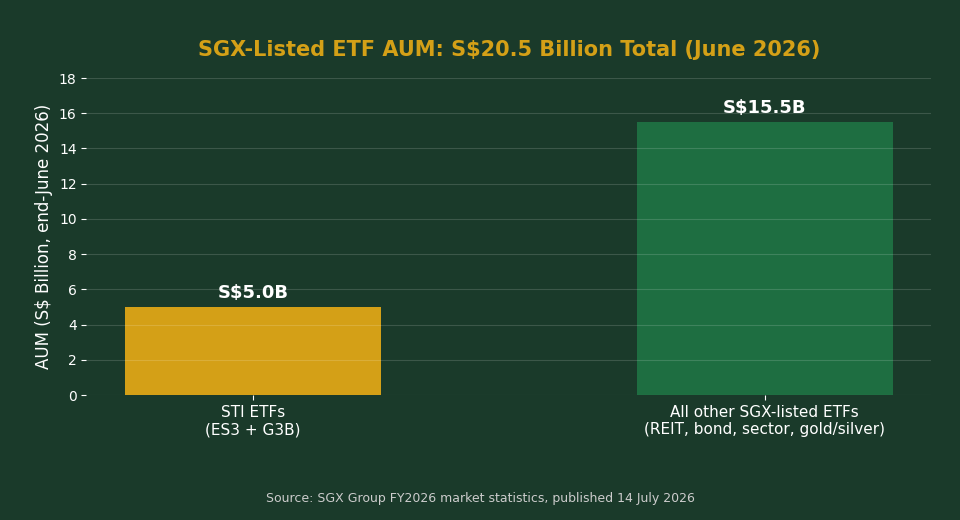
Here is how the S$20.5 billion breaks down. STI ETFs, that’s the SPDR STI ETF (SGX: ES3) and the Nikko AM STI ETF (SGX: G3B), together hold more than S$5 billion. The remaining roughly S$15.5 billion sits across REIT ETFs, bond ETFs, sector and thematic ETFs, and newer products like gold and silver-linked instruments.
| Metric | 2H FY2025 | 2H FY2026 | Change (y/y) |
|---|---|---|---|
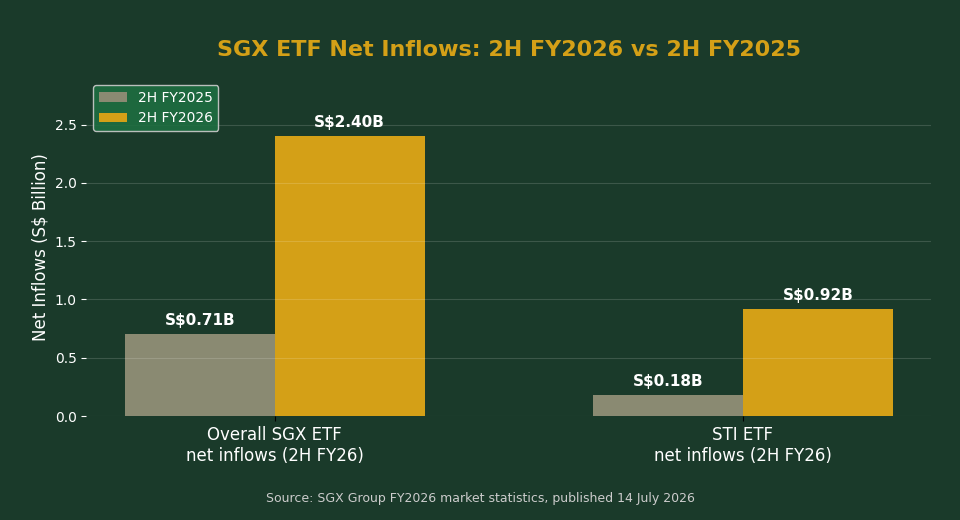
| Overall SGX ETF net inflows | ~S$0.71 billion | S$2.4 billion | +240% |
| STI ETF net inflows | ~S$0.18 billion | S$0.916 billion | ~+400% (5x) |
| ETF trading activity (SDAV) | ~S$23 million | ~S$50 million | +120% |
Source: SGX Group FY2026 market statistics, published 14 July 2026. 2H FY2025 figures are back-calculated from the reported year-on-year growth rates.
Why Are Investors Piling Into ETFs Right Now?
Three things lined up at once. First, the STI itself has been on a tear. It hit an all-time high of 5,218.96 on 25 June 2026, up 30.4% year-on-year to a month-end close of 5,170.65. Total returns over the past 12 months reached 36.4%. When the index is making headlines, retail investors tend to follow.
Second, retail participation across SGX has genuinely broadened. Retail SDAV surged 52% year-on-year in FY2026 to its highest level in 12 years, and retail investors stayed net buyers for five straight months through June. However, that is a whole-market retail inflow figure, not an ETF-only number, so treat it as context for the mood rather than a direct cause of the ETF inflow spike.
Third, ETFs are simply an easier way to buy into a rally than picking individual stocks. A single STI ETF purchase gives you all 30 STI constituents in one trade, including the three local banks that have been driving much of the index’s gains. That convenience matters more when a market is moving fast and you don’t want to miss the move while researching individual counters.
STI ETFs: 15 Straight Months of Inflows
The STI ETF story deserves its own spotlight. Combined AUM across the SPDR STI ETF and Nikko AM STI ETF exceeded S$5 billion in June 2026, extending a net inflow streak to 15 consecutive months. Over the second half of FY2026 alone, total STI ETF inflows were up roughly five times year-on-year at S$916 million.
Both STI ETFs are CPFIS-OA and SRS eligible, which matters if you’re contributing through your CPF Ordinary Account or want tax relief via your SRS account. The SPDR STI ETF (ES3) has the longer track record, listed since 2002, with a total expense ratio of 0.28% per year. The Nikko AM STI ETF (G3B), listed in 2009, charges a slightly higher expense ratio of 0.30% per year. Both track the same underlying index, so the practical difference between them is small.
Retail vs Institutional: Who’s Actually Buying?
SGX’s release breaks activity down by investor type, and the picture is broader than just retail FOMO. Institutional net buying in small- and mid-cap stocks nearly tripled to S$606 million in FY2026, up from S$200 million in FY2025. Financial Services led June’s net institutional inflow, with DBS, OCBC, UOB and SGX itself accounting for a significant share.
In plain terms, both retail and institutional money moved into Singapore-listed products this year. That two-sided demand is one reason the rally has held up rather than fizzling out after a single strong month.
New Gold & Silver DLCs on ETF Underlyings
On 23 June 2026, SGX expanded its range of daily leverage certificates (DLCs) to include gold and silver ETF underlyings. These new instruments recorded S$534,171 in turnover in their first week of trading.
A DLC is not the same thing as an ETF. A DLC gives you leveraged, short-term exposure (for example, 3x the daily move of the underlying gold ETF) and resets daily, which means it is built for active trading, not buy-and-hold investing. If you’re a long-term investor, a plain gold ETF or the STI ETF itself is a far simpler and lower-risk way to get exposure. DLCs are worth knowing about, but they are not a substitute for the core ETF allocation most Singapore investors should hold.
Risks: Don’t Chase the Rally Blindly
A 240% jump in inflows sounds exciting, but a few things are worth keeping in mind before you chase it.
- Concentration risk: the STI is heavily weighted toward the three local banks. If you already hold DBS, OCBC or UOB shares directly, an STI ETF adds less diversification than it looks like on paper.
- Rallies can reverse: a 36.4% 12-month total return is well above the STI’s long-run historical average. Buying purely because the index just hit a record high, without a plan for how long you intend to hold, is how investors end up buying near a short-term peak.
- Inflow data is a lagging signal: by the time a fund flow report is published, the money has already moved. It tells you what happened, not necessarily what happens next.
- DLCs are not ETFs: if you’re tempted by the new gold and silver DLCs because “ETF inflows are up,” remember these are leveraged, short-holding-period instruments with a different risk profile entirely.
None of this means SGX ETFs are a bad idea. It means the sensible approach is the boring one: decide your asset allocation first, then invest a fixed amount on a regular schedule regardless of whether the headlines say inflows are up or down.
How to Buy SGX-Listed ETFs in Singapore
You can buy SGX-listed ETFs like the SPDR STI ETF or Nikko AM STI ETF through any local brokerage, or through a robo-advisor platform if you’d rather not pick individual ETFs yourself.
- Through a brokerage using cash, CPF-OA, or SRS funds — you buy the ETF directly on the SGX, just like a stock
- Through a robo-advisor that builds a diversified portfolio for you, which may include SGX-listed ETFs alongside global holdings
- Via regular monthly investment plans offered by most brokerages, which let you dollar-cost average into an ETF automatically
If you want a hands-off approach, our Endowus referral code and Syfe referral code pages cover how those platforms handle CPF, SRS and cash investing. If you’d rather buy SGX ETFs directly yourself, FSMOne’s referral code is one of the lower-cost ways to do it. For the fuller STI story, including performance data and a step-by-step buying walkthrough, see our STI ETF guide. And if you’re mapping this into a broader retirement plan, our retirement calculator can help you see how a regular ETF contribution compounds over time.
Frequently Asked Questions
Why are SGX ETF inflows so high in 2026?
SGX Group’s FY2026 report attributes the surge to a broad-based rally: the STI hit an all-time high in June 2026, retail participation reached a 12-year high, and both retail and institutional investors were net buyers. ETF net inflows rose 240% year-on-year in the second half of FY2026 to S$2.4 billion.
What is SGX's total ETF AUM as of 2026?
SGX-listed ETF assets under management surpassed S$20.5 billion at the end of June 2026, according to SGX Group’s own FY2026 market statistics published on 14 July 2026.
Which ETFs are getting the most inflows?
STI ETFs, the SPDR STI ETF (ES3) and Nikko AM STI ETF (G3B), led the pack, with combined AUM exceeding S$5 billion and 15 straight months of net inflows. The remaining roughly S$15.5 billion in SGX ETF AUM is spread across REIT ETFs, bond ETFs, sector and thematic ETFs, and newer gold and silver-linked products.
Is the SPDR STI ETF (ES3) or Nikko AM STI ETF (G3B) better?
Both track the same Straits Times Index, so returns before fees are nearly identical. The SPDR STI ETF has a longer track record (listed 2002) and a total expense ratio of 0.28% a year. The Nikko AM STI ETF (listed 2009) charges a slightly higher expense ratio of 0.30% a year. The practical difference is small either way.
Can I buy SGX ETFs with my CPF or SRS funds?
Yes. Both the SPDR STI ETF and Nikko AM STI ETF are CPFIS-OA eligible, meaning you can invest your CPF Ordinary Account savings in them, and both can also be bought using SRS funds through most local brokerages.
Are SGX ETF inflows a signal to buy now?
Not on their own. Fund flow data is a lagging indicator, it tells you what already happened, not what happens next. The STI’s 12-month total return of 36.4% is well above its long-run average, so buying purely because inflows are up risks chasing a rally near a short-term high. A fixed regular investment plan is generally a steadier approach.
What are Gold and Silver DLCs, and are they the same as ETFs?
No. Daily leverage certificates (DLCs) launched by SGX on 23 June 2026 give leveraged, short-term exposure to gold and silver ETF underlyings and reset daily. They are built for active trading, not buy-and-hold investing, and carry a materially different risk profile from holding a plain ETF.
Is the STI ETF too concentrated in bank stocks?
The STI, and therefore STI ETFs, is heavily weighted toward DBS, OCBC and UOB. If you already hold these bank shares directly, an STI ETF gives you less additional diversification than it might appear to on paper. Combining an STI ETF with broader regional or global ETFs can reduce this concentration.
How do I start investing in SGX-listed ETFs?
You can buy SGX-listed ETFs directly through a local brokerage using cash, CPF-OA or SRS funds, set up a monthly regular investment plan to dollar-cost average automatically, or invest through a robo-advisor platform that includes SGX ETFs as part of a broader portfolio.
Ready to Put Your Own Money to Work?
Compare platforms and open an account with our referral partners below.
Primary source: SGX Group market statistics, FY2026 report published 14 July 2026, as reported by Markets Media.
This article was researched with the help of AI. While we strive to keep all information accurate and up to date, there may be errors. If you notice any discrepancies, please contact us.