Mapletree Industrial Trust Gearing Hits 37.5%: What the Falling Hedge Ratio Means for Your DPU (SGX: ME8U)
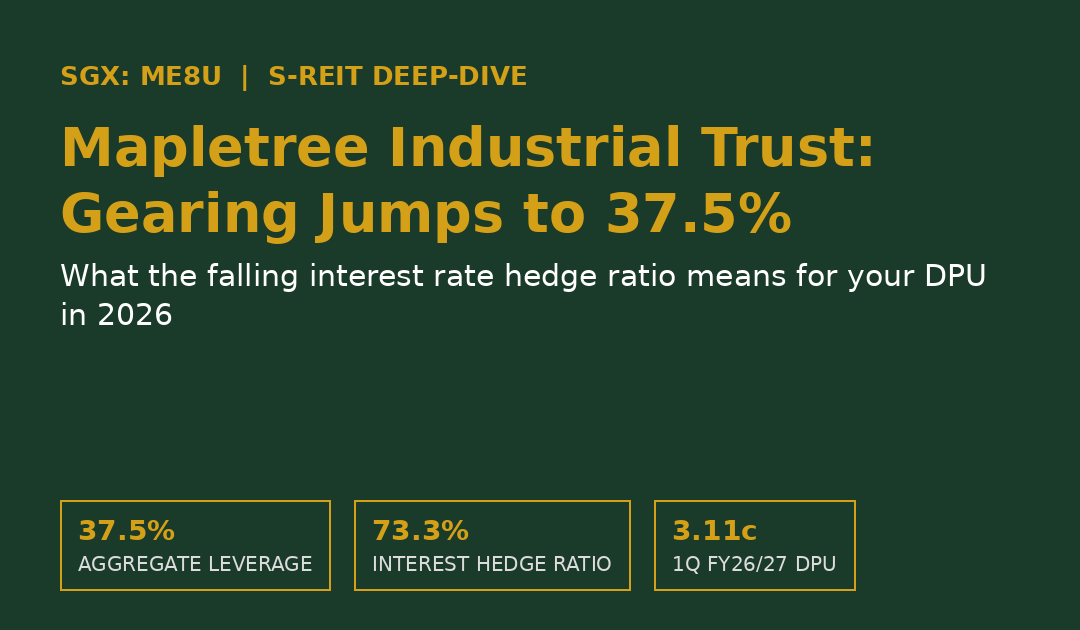
Aggregate leverage jumped from 34.0% to 37.5% and the interest rate hedge ratio fell to 73.3% in 1Q FY26/27 — here is what it actually means for your distributions.
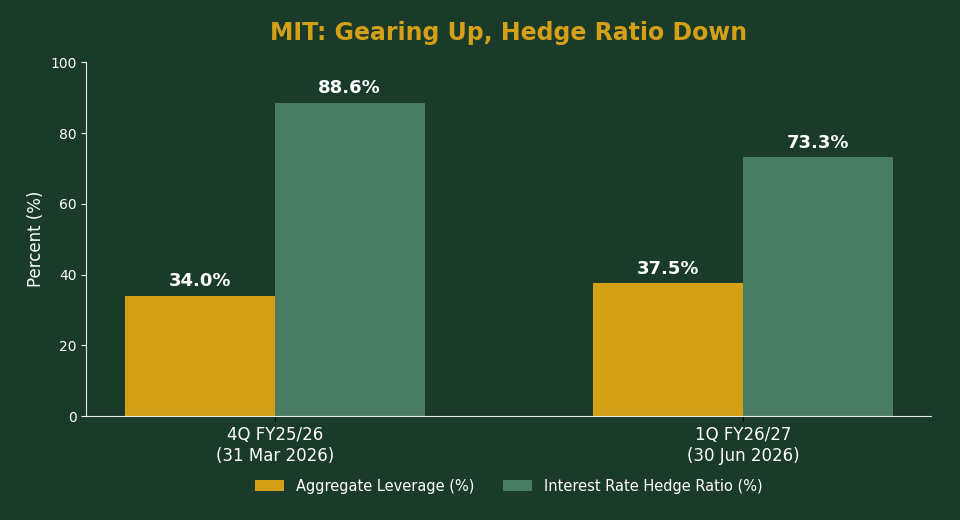
Mapletree Industrial Trust’s (SGX: ME8U) aggregate leverage rose to 37.5% in 1Q FY26/27, up from 34.0% the prior quarter, after it drew down debt to redeem S$300 million of perpetual securities. At the same time, its interest rate hedge ratio slid from 88.6% to 73.3%, leaving more debt exposed to floating rates just as SORA hovers near 1.12%.
Not financial advice. All figures are for educational reference only. Data as at August 2026 unless noted.
- MIT’s aggregate leverage rose from 34.0% (31 Mar 2026) to 37.5% (30 Jun 2026) after a debt-funded redemption of S$300 million in perpetual securities.
- Its interest rate hedge ratio fell from 88.6% to 73.3%, meaning roughly S$831 million of borrowings are now unhedged against rising SORA.
- Our own calculation shows a +50 basis point SORA move could shave about 0.15 cents off annualised DPU — small, but not zero.
- MIT still holds an “AA-” stable-outlook rating from JCR and R&I (16 Jan 2026), and 1Q FY26/27 DPU still came in at 3.11 cents, up 0.6% quarter-on-quarter.
Table of Contents
Contents — Click to expand
- What Happened in 1Q FY26/27
- Why Gearing Rose: The Perpetual Securities Story
- The Hedge Ratio Drop, Explained
- Our Calculation: What This Means for Your DPU
- The Credit Rating Counterbalance
- Portfolio Fundamentals Are Still Solid
- How MIT’s Gearing Compares to Peers
- What to Watch for the Rest of 2026
- Should You Buy MIT Units Now?
- FAQ
What Happened in 1Q FY26/27
Mapletree Industrial Trust released its 1Q FY26/27 results on 23 July 2026, covering the quarter ended 30 June 2026. Gross revenue came in at S$162.3 million, down 7.7% year-on-year. Net property income fell 8.5% to S$122.3 million.
Despite that, distributable income held up better. It dipped only 4.8% year-on-year to S$88.8 million. DPU landed at 3.11 cents, down 4.9% from a year ago but actually up 0.6% from the previous quarter’s 3.09 cents.
The headline you should focus on, though, sits in the balance sheet section. Aggregate leverage rose to 37.5%, up from 34.0% at the end of FY2025/26 (31 March 2026). At the same time, the trust’s interest rate hedge ratio fell from 88.6% to 73.3%. Two numbers moved in the wrong direction at once, and that combination deserves a closer look.
Why Gearing Rose: The Perpetual Securities Story
To understand the leverage jump, you need to rewind to March 2026. That month, MIT’s manager issued S$300 million of 3.25% perpetual securities. Perpetual securities are a hybrid instrument: they behave like equity on the balance sheet (no fixed maturity date) but pay a fixed distribution like a bond.
The plan was a “perpetual-for-perpetual” refinancing. MIT wanted to replace an older batch of perpetual securities that was due for redemption in May 2026. Because the new issuance briefly sat as cash before redemption, aggregate leverage actually dipped to 34.0% at the 31 March 2026 snapshot — a temporary, flattering number.
Then May arrived. MIT redeemed the old perpetual securities, but instead of using only the new issuance proceeds, it drew down additional bank loans to complete the redemption. That loan drawdown is what pushed aggregate leverage up to 37.5% by 30 June 2026. In other words, the 34.0% figure you might have seen in April was never the REIT’s real long-term leverage level. Management had flagged 37.5% as the expected “normalised” figure all along.
| Balance Sheet Metric | 4Q FY25/26 (31 Mar 2026) | 1Q FY26/27 (30 Jun 2026) |
|---|---|---|
| Aggregate Leverage | 34.0% | 37.5% |
| Interest Rate Hedge Ratio | 88.6% | 73.3% |
| Average Cost of Debt | ~3.1% | 3.1% |
| Interest Coverage Ratio | — | 4.0x |
| Weighted Avg Debt Tenor | — | 3.4 years |
| NAV per Unit | — | S$1.63 |
Source: Mapletree Industrial Trust 1Q FY2026/27 financial results and presentation, SGX filing, 23 July 2026.
The Hedge Ratio Drop, Explained
An interest rate hedge ratio tells you how much of a REIT’s debt is protected from rate swings, either through fixed-rate loans or interest rate swaps. A hedge ratio of 88.6% means only 11.4% of borrowings floated with the market. At 73.3%, that floating slice grows to 26.7%.
Why did it fall? Two reasons. First, the new debt drawn to redeem the perpetual securities in May 2026 came in unhedged, at least initially. Second, MIT has roughly S$600 million of existing interest rate hedges expiring within FY26/27. As old swaps mature and aren’t immediately replaced, the hedged proportion naturally declines until management locks in new ones.
This matters because SORA, the Singapore Overnight Rate Average that anchors most floating-rate SGD loans, sat around 1.12% in early August 2026. That’s low by recent standards, but analysts like UOB expect it to drift up toward 1.39% by year-end as rate-cut expectations get priced out. A REIT with more floating exposure feels that drift more directly in its interest expense.
Our Calculation: What This Means for Your DPU
Numbers like “26.7% floating exposure” are hard to feel in your wallet. So we ran our own back-of-envelope calculation, using MIT’s own disclosed figures.
MIT’s portfolio was valued at roughly S$8.3 billion as at 30 June 2026. At 37.5% aggregate leverage, that implies total borrowings of about S$3,112.5 million (S$8.3bn × 37.5%). With 26.7% of that floating, floating-rate debt works out to about S$831 million.
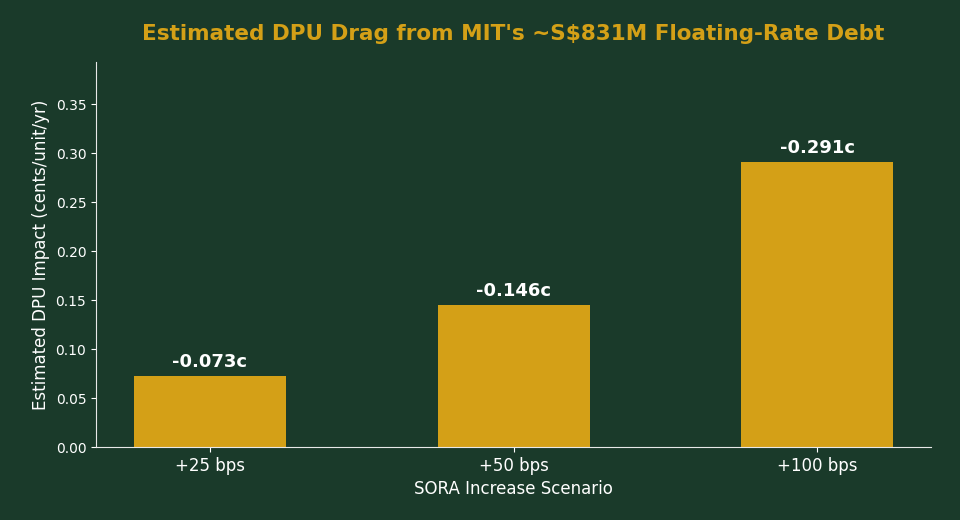
If SORA rises by 50 basis points (0.50%) from here, that adds roughly S$4.16 million a year in extra interest expense (S$831m × 0.5%). Spread across MIT’s 2,855 million units, that’s about 0.146 cents shaved off annualised DPU — a little over 1% of the trust’s naive annualised FY26/27 DPU run-rate of 12.44 cents.
Now isolate just the hedge ratio drop itself. Had MIT kept its prior 88.6% hedge ratio (11.4% floating), the same +50bps shock would only cost about 0.062 cents per unit. So the hedge ratio slide alone adds roughly 0.083 cents of extra DPU sensitivity for every 50bps SORA move — equal to about 0.66% of MIT’s FY25/26 full-year DPU of 12.71 cents. It’s a real number, but a modest one relative to the swings MIT already sees from occupancy and rental reversions each quarter.
| SORA Scenario | Extra Annual Interest Cost | Estimated DPU Impact |
|---|---|---|
| +25 bps | ~S$2.08 million | ~0.073 cents/unit |
| +50 bps | ~S$4.16 million | ~0.146 cents/unit |
| +100 bps | ~S$8.31 million | ~0.291 cents/unit |
Source: TKN calculation based on MIT 1Q FY2026/27 disclosures (37.5% leverage, 73.3% hedge ratio, S$8.3bn AUM, 2,855m units), 23 July 2026. Illustrative only, not a management forecast.
The Credit Rating Counterbalance
Rising leverage sounds alarming in isolation. But context matters, and MIT’s context is reassuring. On 16 January 2026, Japan Credit Rating Agency (JCR) and Rating and Investment Information (R&I) both assigned MIT an “AA-” long-term issuer rating with a stable outlook.
Both agencies cited MIT’s diversified, income-generating portfolio and conservative leverage management. They also flagged the backing of sponsor Mapletree Investments, which counts data centres as one of its four core sectors and continues to support MIT’s acquisition pipeline.
An “AA-” rating sits comfortably in investment-grade territory. It tells you that even after the leverage uptick to 37.5%, independent rating agencies still view MIT’s balance sheet as fundamentally sound. That’s a useful sanity check against reading too much into one quarter’s leverage jump.
Portfolio Fundamentals Are Still Solid
Away from the balance sheet, MIT’s operating numbers held up reasonably well in 1Q FY26/27. Overall portfolio occupancy came in at 90.7%. Singapore and Japan properties are running near full occupancy, and data centres now make up 57.2% of total assets under management.
The soft spot remains North America, where occupancy sits at 82.5% because of lease non-renewals. But even there, you can see progress. Weighted average lease expiry (WALE) for the North American portfolio improved from 6.3 years to 6.9 years after MIT backfilled vacant space, including a 10-year lease with an aerospace technology tenant.
Rental reversions stayed positive across the board: +2.2% in North America and +5.3% in Singapore, where tenant retention hit 87.9% for the quarter. Tenant concentration risk is also low. The top 10 tenants contribute less than 29% of rental income, and no single trade sector accounts for more than 15%.
How MIT’s Gearing Compares to Peers
At 37.5%, MIT’s aggregate leverage now sits above Keppel DC REIT’s 34.0% gearing level, which we covered in our detailed Mapletree Industrial Trust vs Keppel DC REIT comparison. Both trusts remain well within the regulatory leverage ceiling of 50% for Singapore REITs, but the gap is worth watching if you’re choosing between data-centre-heavy S-REITs.
It’s also worth remembering MIT’s leverage moved for a specific, one-off reason: the debt-funded redemption of its perpetual securities. That’s different from a REIT gearing up to fund a large, DPU-accretive acquisition. Once the post-redemption dust settles, you’d expect leverage to stabilise around this 37.5% mark rather than climb further, barring a major new deal.
Building a Diversified S-REIT Portfolio?
If you’d rather not pick single S-REIT names like MIT and want broad exposure with low fees, a robo-advisor or brokerage platform can help you build a diversified income portfolio.
What to Watch for the Rest of 2026
Three things should be on your radar. First, hedge renewals. With S$600 million of hedges expiring in FY26/27, watch upcoming quarterly results for confirmation that management has locked in new fixed rates or swaps, which would push the hedge ratio back up.
Second, the North American divestment pipeline. MIT has flagged plans to divest S$500 million to S$600 million of non-core North American assets, following on from the Philadelphia data centre sale completed in June 2026. Proceeds from further divestments could pay down floating-rate debt and pull leverage back toward 34%.
Third, SORA itself. If SORA holds near 1.1%-1.4% through year-end as most analysts expect, the DPU drag from MIT’s floating exposure stays manageable, in the range our calculation above lays out. A sharper, unexpected rate spike would be the scenario to reassess your position on.
Should You Buy MIT Units Now?
MIT trades around S$1.93, against a consensus analyst target price near S$2.04 and a trailing dividend yield of roughly 6.5%. Our Mapletree Industrial Trust price target coverage has more detail on individual analyst calls if you want the full spread of views.
If you already hold MIT units, the leverage and hedge ratio moves aren’t a reason to panic-sell. They’re a reason to read the next two quarterly reports carefully, specifically the hedge ratio and any hedge renewal announcements. The “AA-” rating and 4.0x interest coverage ratio suggest MIT has room to absorb higher borrowing costs without threatening its distribution.
If you’re considering a new position, MIT still offers exposure to a diversified mix of Singapore industrial space, North American data centres, and a growing Japan footprint, with income-generating assets across all three. Just size your position knowing that near-term DPU has a modest, quantifiable sensitivity to where SORA goes next, on top of the usual occupancy and leasing risks every industrial S-REIT carries.
For a broader view of how S-REITs stack up as an asset class, our Best S-REITs Singapore 2026 guide and Singapore REIT ETF guide are useful starting points if you’d rather diversify across the sector than pick single names.
Prefer to buy MIT units directly on SGX? Compare brokerage platforms below to find one with competitive fees for Singapore-listed REITs.
Frequently Asked Questions
What is Mapletree Industrial Trust's current gearing ratio?
Why did MIT's aggregate leverage rise from 34.0% to 37.5%?
What is an interest rate hedge ratio, and why did MIT's fall?
Is Mapletree Industrial Trust's balance sheet still safe at 37.5% gearing?
How much could rising interest rates cost MIT unitholders?
Is Mapletree Industrial Trust a buy in 2026 given the higher gearing?
This article was researched with the help of AI. While we strive to keep all information accurate and up to date, there may be errors. If you notice any discrepancies, please contact us.