Mapletree Industrial Trust Share Price vs Keppel DC REIT: Which Data Centre S-REIT Wins in 2026?
MIT has quietly become Singapore’s largest data centre landlord by AUM. Here’s how it stacks up against pure-play Keppel DC REIT on yield, DPU growth and gearing.
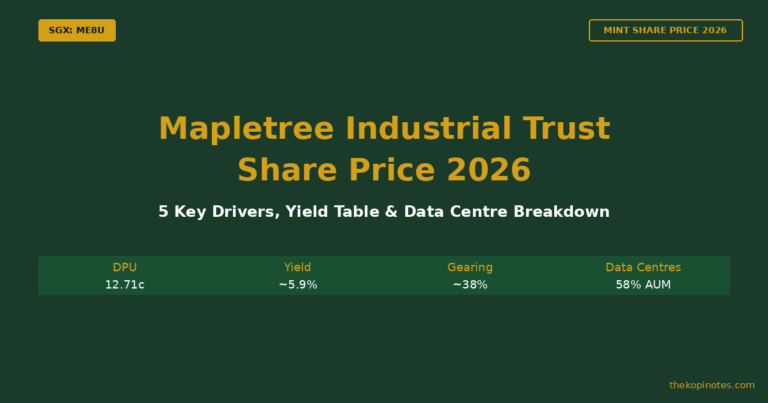
Mapletree Industrial Trust (SGX: ME8U) traded at S$1.92 as at 13 August 2026, offering a trailing yield of roughly 6.6% on its FY25/26 DPU of 12.71 cents. What many investors miss is that data centres now make up 57.3% of MIT’s S$8.3 billion AUM — making it larger by data centre asset value than Keppel DC REIT, Singapore’s best-known pure-play data centre trust. This article compares both REITs head-to-head on exposure, growth and balance sheet risk.
Not financial advice. All figures are for educational reference only and cited with source and date. Data as at August 2026 unless otherwise noted.
TL;DR
- MIT is technically a diversified industrial S-REIT, but data centres are now 57.3% of its S$8.3B AUM (31 Mar 2026) — bigger data centre exposure by dollar value than Keppel DC REIT’s entire S$6.3B portfolio.
- MIT offers the higher headline yield (~6.6%) but a shrinking DPU (-6.3% FY25/26, -4.9% in 1Q FY26/27). Keppel DC REIT yields less (~4.9-5.0%) but DPU grew 11.3% in 1H FY2026 on stronger occupancy and Asia-Pacific rental reversions.
- Gearing has diverged: MIT’s leverage rose to 37.5% after a perpetual securities refinancing in May 2026, while Keppel DC REIT sits at a more conservative 34.0% with roughly S$673 million of debt headroom.
Table of Contents
Contents — Click to expand
- Quick Answer
- Key Differences at a Glance
- Data Centre Exposure: MIT’s Hidden Scale vs Keppel DC REIT’s Pure Play
- DPU and Distribution Growth Compared
- Balance Sheet and Gearing: Who’s Taking More Risk?
- Tax Treatment and Investing Costs for Singapore Investors
- Who Should Buy MIT vs Keppel DC REIT?
- Frequently Asked Questions
Quick Answer
If you want the higher current income and are comfortable with a diversified industrial portfolio that happens to have grown into a data centre giant, Mapletree Industrial Trust’s ~6.6% yield is hard to beat today. If you want the cleaner, faster-growing data centre story with a more conservative balance sheet, Keppel DC REIT’s lower ~4.9% yield comes with 11.3% DPU growth in 1H FY2026 and less North American leasing risk. Neither is a clean “pure AI data centre” bet — MIT’s data centre segment sits inside a broader industrial trust, while Keppel DC REIT is genuinely a pure play, but weighted toward Singapore and Japan rather than the US hyperscale market.
Key Differences at a Glance
Both REITs are sponsored by well-capitalised Singapore groups (Mapletree Investments and Keppel Ltd/Keppel Capital respectively) and are S-REITs, meaning distributions are generally not taxed again in the hands of individual Singapore unitholders. Beyond that, the similarities largely end. MIT is Singapore’s largest industrial S-REIT by asset value across three property types — data centres, flatted factories/business parks, and hi-tech buildings — spread across Singapore, North America and Japan. Keppel DC REIT is a narrower, Asia-Pacific-weighted portfolio of 25 standalone data centre buildings.
| Feature | Mapletree Industrial Trust (ME8U) | Keppel DC REIT (AJBU) |
|---|---|---|
| Portfolio type | Diversified industrial + data centres | Pure-play data centres |
| Total AUM | ~S$8.3 billion (136 properties) | ~S$6.3 billion (25 data centres, 10 countries) |
| Data centre share of AUM | 57.3% (largest segment) | 100% |
| Geographic weighting | Singapore, North America, Japan (55 data centres in North America) | 84.7% Asia-Pacific (Singapore 62.7%, Japan 13.6%) |
| Latest DPU trend | FY25/26: 12.71c, down 6.3% YoY | 1H FY2026: 5.714c, up 11.3% YoY |
| Aggregate leverage | 37.5% (as at 31 Mar 2026) | 34.0% (as at 30 Jun 2026) |
| Unit price / yield | S$1.92, ~6.6% trailing yield | ~S$2.31, ~4.9% annualised yield |
| Sponsor | Mapletree Investments Pte Ltd | Keppel Ltd / Keppel Capital |
Source: Mapletree Industrial Trust Investor Relations, May 2026 presentation; Keppel DC REIT 1H FY2026 results, 22 July 2026; Beansprout portfolio comparison, 9 June 2026 — figures as at 31 March 2026 (MIT) and 30 June 2026 (Keppel DC REIT).
Data Centre Exposure: MIT’s Hidden Scale vs Keppel DC REIT’s Pure Play
Search interest in “mapletree industrial trust share price” usually assumes you’re buying an industrial landlord. That framing is now out of date. As at 31 March 2026, data centres accounted for 57.3% of MIT’s S$8.3 billion AUM — its single largest segment, ahead of flatted factories and hi-tech buildings combined. MIT holds this exposure through 55 data centre properties in North America (8.3 million sq ft of net lettable area), plus data centre assets in Singapore, giving it a genuinely large-scale AI-adjacent property book, even though the REIT is not marketed as a “data centre REIT.”
Keppel DC REIT, by contrast, is unambiguously a pure play: 100% of its S$6.3 billion AUM sits in 25 standalone data centre buildings across 10 countries. But its geography skews heavily toward Asia-Pacific — 84.7% of AUM, with Singapore alone at 62.7% and Japan at 13.6%. Keppel DC REIT has almost no exposure to the US hyperscale market that dominates global AI infrastructure headlines, while MIT’s North American data centres sit at the centre of that story — for better and for worse.
That “for worse” part matters. MIT’s North American data centre occupancy stood at 86.1% as at 31 March 2026, with a weighted average lease expiry (WALE) of 6.3 years — softer than Keppel DC REIT’s portfolio occupancy of 92.5% (as at 30 June 2026, following a lease expiry at its Cardiff data centre) and about 95% of power capacity contracted. Management has flagged that roughly 4.7% of MIT’s FY26/27 income is exposed to non-renewals as enterprise tenants migrate workloads to cloud providers faster than expected — a dynamic Keppel DC REIT has been less exposed to given its shorter, more cloud/hyperscale-tilted Asia-Pacific tenant base. If you want to see how Keppel DC REIT’s data centre positioning compares against another newer entrant, our Keppel DC REIT vs NTT DC REIT comparison breaks down the competitive landscape further.
MIT’s response has been active portfolio recycling: management is targeting S$500-600 million of selective North American divestments (it already sold its Philadelphia data centre in June 2026) to redeploy capital into higher-quality hyperscale and colocation assets in Asia-Pacific and Europe. This is a genuine structural shift worth watching, distinct from the DPU/price-target framing of most existing MIT coverage.
| Metric | MIT Data Centre Segment | Keppel DC REIT (Full Portfolio) |
|---|---|---|
| Number of data centres | 55 (North America) + Singapore assets | 25 across 10 countries |
| Occupancy | 86.1% (North America) | 92.5%; ~95% of power capacity contracted |
| WALE | 6.3 years | 6.5 years (1Q 2026) |
| Key strategy | Recycle S$500-600M out of North America into APAC/Europe hyperscale assets | Continue hyperscale acquisitions in Asia-Pacific (~S$1.1B completed/announced in FY2025) |
Source: Mapletree Industrial Investor Presentation, May 2026; MIT 1QFY26/27 results, 23 July 2026; Keppel DC REIT 1H FY2026 results, 22 July 2026.
DPU and Distribution Growth Compared
The two REITs are moving in opposite directions on distributions right now. MIT’s FY25/26 (year ended 31 March 2026) DPU came in at 12.71 cents, down 6.3% year-on-year, weighed down by the absence of income from divested Singapore properties, non-renewed North American leases, and foreign exchange headwinds on its USD-denominated data centre income. The slide continued into the new financial year: 1Q FY26/27 DPU fell a further 4.9% year-on-year to 3.11 cents, though it edged up 0.6% quarter-on-quarter, suggesting the pace of decline may be stabilising. For a full breakdown of analyst price targets on MIT’s current DPU trajectory, see our Mapletree Industrial Trust price target 2026 analysis.
Keppel DC REIT has the opposite story. 1H FY2026 DPU rose 11.3% year-on-year to 5.714 cents, with distributable income up 18.5% to S$150.67 million, driven by acquisitions completed in FY2025 (including Tokyo Data Centre 3 and the remaining interests in Keppel DC Singapore 3 and 4) and positive rental reversions of roughly 45-51% across recent quarters. That reversion rate — the uplift landlords capture when renewing expiring leases at current market rents — is a genuine sign of pricing power in Keppel DC REIT’s Asia-Pacific data centre niche that MIT’s North American book has not been able to replicate.
Worked example: Say you have S$50,000 to deploy. At MIT’s S$1.92 unit price, that buys roughly 26,041 units. Applying the FY25/26 DPU of 12.71 cents gives an estimated annual distribution of about S$3,310 — a 6.6% yield on cost. The same S$50,000 in Keppel DC REIT at S$2.31 per unit buys about 21,645 units; annualising the 1H FY2026 DPU of 5.714 cents (×2 = 11.428 cents) gives an estimated S$2,474 per year, a 4.95% yield on cost. MIT pays more today — but its DPU has been shrinking, while Keppel DC REIT’s has been growing, so the gap in actual dollars received could narrow or reverse over a multi-year holding period. This is an illustrative calculation based on the latest reported figures, not a forecast.
Balance Sheet and Gearing: Who’s Taking More Risk?
Gearing (also called aggregate leverage) measures a REIT’s total borrowings as a share of its total assets. MAS caps this at 50% for all S-REITs, though most well-run trusts keep leverage well below that, typically in the 30-40% range, to preserve balance sheet flexibility and avoid forced asset sales or dilutive equity raises during downturns.
MIT’s aggregate leverage stood at 37.5% as at 31 March 2026, up from 34.0% previously. The increase reflects a “perpetual-for-perpetual” refinancing: MIT redeemed S$300 million of 3.15% perpetual securities in May 2026 and replaced them with a fresh S$300 million tranche priced at 3.25%, drawing down additional debt in the process. That’s a manageable move — MIT remains well inside the MAS ceiling — but it does leave less headroom than before for further acquisitions without a unit price recovery or additional divestment proceeds.
Keppel DC REIT’s leverage was 34.0% as at 30 June 2026, with management citing roughly S$673 million of debt headroom before hitting the commonly used 40% soft threshold. Its average cost of debt of 2.6% and interest coverage ratio of 7.2 times (as at 1Q 2026) are both stronger than typical S-REIT sector averages, giving it more room to fund further hyperscale acquisitions without straining unitholders. For a broader view of how S-REIT gearing levels compare against alternative income assets, see our guide to the best S-REITs in Singapore for 2026.
Tax Treatment and Investing Costs for Singapore Investors
Both MIT and Keppel DC REIT are tax-transparent Singapore REITs, meaning individual Singapore-resident unitholders generally receive distributions free of further Singapore income tax, provided the REIT distributes at least 90% of its taxable income (both do). There’s no withholding tax differential between the two the way there is between, say, US- and Ireland-domiciled ETFs — this is a Singapore-vs-Singapore comparison, not a cross-border tax decision.
Where it does matter is account type. Both counters are SGX mainboard-listed and can be bought through a standard brokerage account, and both are also CPF Investment Scheme (CPFIS) and Supplementary Retirement Scheme (SRS) eligible through most brokers, which matters if you’re building a long-term retirement income sleeve. If you’re weighing how S-REITs like these fit alongside your CPF savings, our CPF investment strategy guide walks through the eligibility rules and trade-offs in more detail. Brokerage fees are typically 0.08-0.28% of trade value depending on your platform, so for either counter, comparing your broker’s commission structure matters more than any REIT-specific tax quirk.
Who Should Buy MIT vs Keppel DC REIT?
Mapletree Industrial Trust may suit you if: you want the higher current yield today, you’re comfortable holding a diversified industrial-plus-data-centre portfolio rather than a pure thematic bet, and you believe management’s North American portfolio recycling plan will stabilise occupancy and DPU over the next 12-24 months. You’re effectively buying a value/turnaround income story with genuine (if underappreciated) AI infrastructure exposure baked in.
Keppel DC REIT may suit you if: you want a cleaner, faster-growing data centre exposure with a more conservative balance sheet, you’re willing to accept a lower starting yield in exchange for DPU momentum, and you’re comfortable with a portfolio concentrated in Singapore and Japan rather than the US. You’re buying a growth-tilted income story rather than a deep-value one.
Neither approach is wrong — they answer different questions. Some investors choose to hold both for genuine diversification: MIT for income and US exposure, Keppel DC REIT for growth and Asia-Pacific quality. If you’d rather not pick a single REIT, our retirement planning calculator can help you model how a blended S-REIT income sleeve fits into your broader retirement numbers, and our guide to building passive income in Singapore covers how REITs like these typically fit alongside other income assets such as T-bills and dividend stocks.
Frequently Asked Questions
Is Mapletree Industrial Trust actually a data centre REIT?
Not officially — MIT is classified as a diversified industrial S-REIT, covering data centres, flatted factories, business parks and hi-tech buildings. But as at 31 March 2026, data centres made up 57.3% of its S$8.3 billion AUM, making it its largest single segment. In dollar terms, MIT’s data centre exposure is larger than Keppel DC REIT’s entire portfolio, even though MIT isn’t marketed as a pure-play data centre trust.
Which has a higher dividend yield, MIT or Keppel DC REIT?
Mapletree Industrial Trust offers the higher yield, at roughly 6.6% based on its S$1.92 unit price (13 August 2026) and FY25/26 DPU of 12.71 cents. Keppel DC REIT yields less, around 4.9-5.0%, based on its S$2.31 unit price and annualised 1H FY2026 DPU. The gap reflects MIT’s shrinking distributions versus Keppel DC REIT’s growing ones — a higher yield alone doesn’t tell you which is the better long-term holding.
Why has MIT's DPU been falling while Keppel DC REIT's has been rising?
MIT’s DPU fell 6.3% in FY25/26 and a further 4.9% in 1Q FY26/27, largely due to non-renewed leases in its North American data centre portfolio as tenants migrate to cloud providers faster than expected, plus the loss of income from divested Singapore properties and foreign exchange headwinds on USD income. Keppel DC REIT’s DPU rose 11.3% in 1H FY2026 on the back of FY2025 acquisitions (including Tokyo Data Centre 3) and strong rental reversions of roughly 45-51% in its more concentrated Asia-Pacific, cloud/hyperscale-tenanted portfolio.
Can I buy MIT or Keppel DC REIT with my CPF or SRS funds?
Yes. Both Mapletree Industrial Trust and Keppel DC REIT are SGX mainboard-listed S-REITs that are generally eligible for purchase through the CPF Investment Scheme (using CPF Ordinary Account funds) and the Supplementary Retirement Scheme, subject to your broker supporting CPFIS/SRS trading and standard eligibility limits. Check with your specific broker, as not all platforms support CPFIS trading for every counter.
Is MIT's rising gearing a red flag?
Not on its own. MIT’s aggregate leverage rose to 37.5% as at 31 March 2026 after refinancing S$300 million of perpetual securities, but this remains well within MAS’s 50% regulatory ceiling for S-REITs. It does mean MIT has less headroom than Keppel DC REIT (34.0% gearing, ~S$673 million debt headroom) for further debt-funded acquisitions without a unit price recovery, which is worth monitoring but isn’t an immediate solvency concern.
Should I buy both MIT and Keppel DC REIT for diversification?
It’s a reasonable approach if you want both income and growth exposure to Singapore’s data centre theme. MIT offers a higher current yield with US and Singapore exposure and turnaround potential; Keppel DC REIT offers faster DPU growth with a more conservative balance sheet and Asia-Pacific concentration. Holding both diversifies your geographic and growth-versus-yield exposure within the same sub-sector, rather than betting on one REIT’s specific execution.
Ready to Start Building Your S-REIT Income Portfolio?
Open a brokerage account and start investing in Singapore’s data centre and industrial S-REITs today.
This article was researched with the help of AI. While we strive to keep all information accurate and up to date, there may be errors. If you notice any discrepancies, please contact us.