VWRA vs Momentum ETF (IWMO): Should Singapore Investors Tilt Toward Momentum in 2026?
A data-driven comparison of VWRA (FTSE All-World) and IWMO (MSCI World Momentum) — tax treatment, costs, sector concentration and 2022-2026 performance for Singapore investors.
VWRA tracks the broad FTSE All-World Index at a 0.14% TER, while IWMO (iShares Edge MSCI World Momentum Factor UCITS ETF) tilts toward stocks with strong recent price trends at a 0.25% TER. Both are Ireland-domiciled, LSE-listed and taxed identically for Singapore investors. IWMO has outperformed in 3 of the last 4 years on the back of the AI-driven momentum rally, but it carries higher concentration risk and sharper drawdowns when trends reverse.
Not financial advice. All figures are for educational reference only. Data verified as at 10 October 2026 against official iShares and Vanguard fund pages unless otherwise noted.
Table of Contents
Contents — Click to expand
Quick Answer
For most Singapore investors, VWRA remains the better core holding — it owns 3,784 stocks across 47 countries at a rock-bottom 0.14% TER, so you capture the entire global market without betting on any single style factor staying in favour. IWMO is a satellite position, not a replacement: it has beaten VWRA in three of the last four calendar years (2023 being the exception) because AI-linked momentum names have led markets since 2023, but it fell roughly as hard as VWRA in the 2022 drawdown and concentrates 40% of the portfolio in a single sector. A Singapore investor holding SGD 50,000 who shifted 20% into IWMO on 1 January 2024 would have captured the stronger 2024 momentum return, but would also have taken on meaningfully more single-factor risk for the rest of the holding period.
What Is a Momentum Factor ETF?
A momentum factor ETF screens a broad index (in IWMO’s case, the MSCI World) for stocks that have shown an upward price trend over the trailing 6-12 months, then overweights them relative to the parent index. The underlying thesis — well documented in academic finance literature since the 1990s — is that stocks which have recently outperformed tend to keep outperforming for a period, before eventually mean-reverting. iShares launched IWMO (full name: iShares Edge MSCI World Momentum Factor UCITS ETF) on 3 October 2014. It tracks the MSCI World Momentum Index (Net), is physically replicated, rebalances quarterly, and held 349 constituent stocks as at 8 October 2026, with USD 6.42 billion in net assets. A near-identical alternative, the Xtrackers MSCI World Momentum UCITS ETF (ticker XDEM, ISIN IE00BL25JP72), tracks the same MSCI World Momentum Index at the same 0.25% TER but with a smaller asset base of roughly USD 2.0-2.2 billion — useful to know if IWMO’s liquidity or spread ever becomes a concern on your broker.
In 2026, momentum ETFs have been dominated by AI capital-expenditure beneficiaries. J.P. Morgan’s factor research noted that momentum was the only factor style to deliver positive returns across all global developed and emerging markets through the first half of 2026, though leadership has rotated from software names toward memory-chip makers and AI infrastructure suppliers over the course of the year.
Key Differences at a Glance
| Feature | VWRA | IWMO |
|---|---|---|
| Full Name | Vanguard FTSE All-World UCITS ETF (USD Acc) | iShares Edge MSCI World Momentum Factor UCITS ETF |
| Index Tracked | FTSE All-World Index | MSCI World Momentum Index (Net) |
| Domicile | Ireland | Ireland |
| Structure | Accumulating | Accumulating |
| TER | 0.14% p.a. | 0.25% p.a. |
| Net Assets | USD 87.3 billion (8 Oct 2026) | USD 6.42 billion (8 Oct 2026) |
| Number of Holdings | 3,784 | 349 |
| Inception Date | 23 Jul 2019 | 3 Oct 2014 |
| LSE Ticker (USD line) | VWRA | IWMO |
Source: Vanguard VWRA product page and iShares IWMO factsheet, both as at 8 October 2026.
Tax & Cost Comparison for Singapore Investors
Because both funds are Ireland-domiciled UCITS ETFs listed on the London Stock Exchange, their tax treatment for a Singapore investor is identical — this is the one dimension where the “momentum vs market” decision makes no difference. Both benefit from the Ireland-US tax treaty’s 15% withholding tax on US-sourced dividends (versus 30% for a US-domiciled ETF like VOO), and neither exposes a Singapore investor to US estate tax, which can apply to US-situs assets above USD 60,000 for non-resident aliens holding US-domiciled funds directly. Singapore does not levy capital gains tax, and as accumulating share classes, neither fund distributes income that would need to be manually reinvested.
The real cost difference is the TER: on a SGD 50,000 portfolio, VWRA’s 0.14% TER works out to roughly SGD 70 a year in fund-level fees, versus roughly SGD 125 a year for IWMO at 0.25% — a difference of about SGD 55 annually. That gap is immaterial next to the performance swings discussed below, but it compounds over decades, which is why VWRA remains the lower-cost default core holding.
| ETF Type | Domicile | US Dividend WHT | US Estate Tax Risk |
|---|---|---|---|
| VWRA / IWMO (LSE) | Ireland | 15% | None |
| US-domiciled equivalent (e.g. VOO, MTUM on NYSE) | USA | 30% | Yes (above USD 60k) |
Source: Ireland-US double tax treaty provisions as applied to UCITS ETFs; IRS estate tax rules for non-resident aliens.
Historical Performance Comparison (2022-2026)
| Year | VWRA / FTSE All-World (USD) | IWMO (USD) | Momentum Edge |
|---|---|---|---|
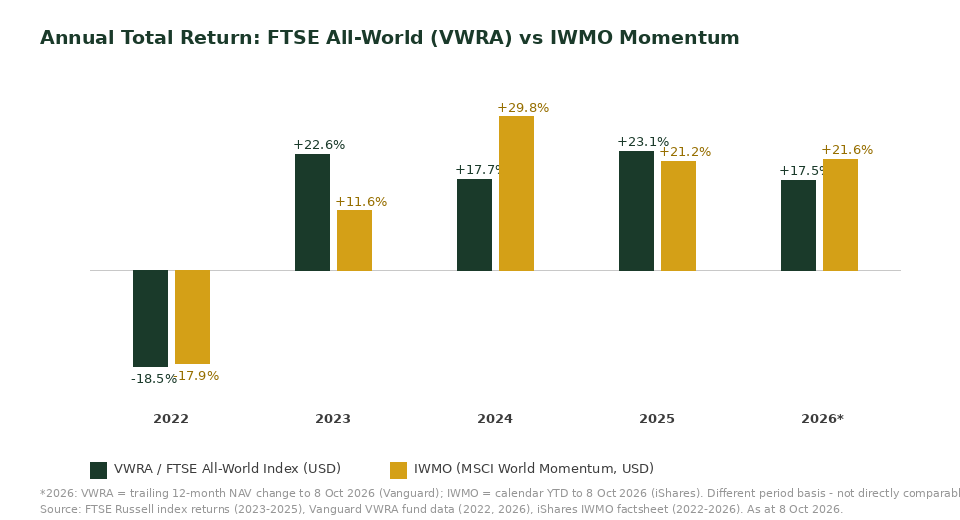
| 2022 | -18.5% | -17.9% | +0.6pp |
| 2023 | +22.6% | +11.6% | -11.0pp |
| 2024 | +17.7% | +29.8% | +12.1pp |
| 2025 | +23.1% | +21.2% | -1.9pp |
| 2026* | +17.5% | +21.6% | +4.1pp |
*2026 figures use different period bases: VWRA is the trailing 12-month NAV change to 8 Oct 2026 (Vanguard); IWMO is calendar-year-to-date to 8 Oct 2026 (iShares). Not a precise apples-to-apples comparison, but both are the latest official figures available. Source: FTSE Russell index annual reviews (2023-2025 index returns), Vanguard VWRA fund data (2022, 2026), iShares IWMO factsheet (2022-2026). All figures in USD, gross income reinvested.
The pattern is instructive: IWMO beat VWRA by a wide margin in 2024 (the strongest year of the AI capex cycle) but lagged meaningfully in 2023, and both funds fell by a similar amount in the 2022 rate-hike drawdown. Momentum has not been a reliable hedge against broad market declines — when the market falls, the stocks that were “winning” typically fall too, sometimes faster, as the May 2026 momentum unwind illustrated when AI and software trades reversed sharply in a single trading session. Goldman Sachs research cited in trade press at the time noted that momentum positioning had reached the 100th percentile relative to the past five years, a crowding signal that preceded the pullback.
Sector Concentration and Risk
The performance gap above is explained almost entirely by sector concentration. As at 8 October 2026, IWMO holds 39.9% of its portfolio in Information Technology, versus roughly 32.5% for VWRA under the same ICB classification (Vanguard factsheet, 31 March 2026). More notably, IWMO has also rotated meaningfully into Energy — 10.7% of the portfolio versus an estimated 4.0% for VWRA — reflecting the fund’s quarterly rebalance capturing a broader momentum trend beyond AI-linked technology names in 2026.
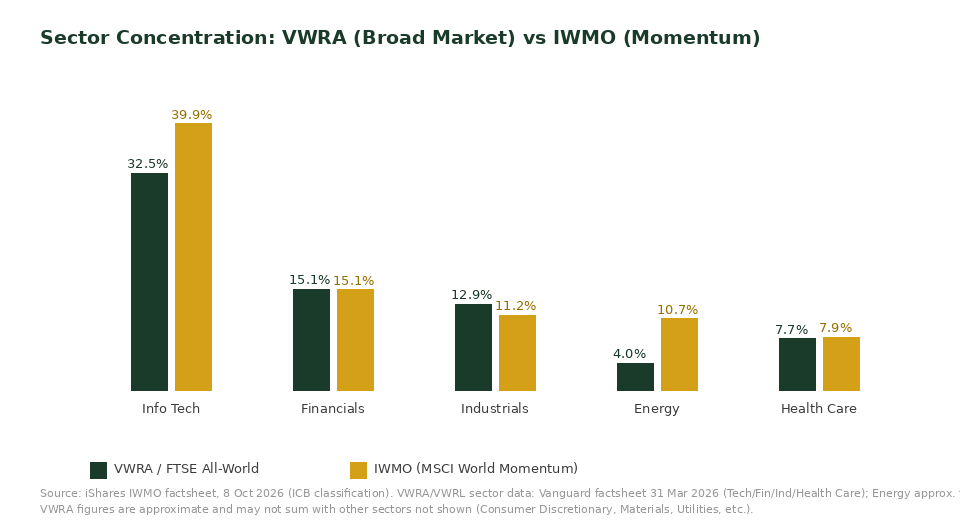
This matters for risk management: a 40% weighting in one GICS/ICB sector means IWMO’s fortunes are heavily tied to the continuation of the AI capex cycle. J.P. Morgan’s own factor research described momentum positioning crowding into memory-chip and AI-infrastructure names as a “fragility” risk worth monitoring, not a reason to avoid the factor altogether. iShares itself flags this in the fund’s own risk disclosures: “indices with a factor focus are less diversified than their parent index… investors should consider this fund as part of a broader investment strategy” — in other words, even the fund manager does not position IWMO as a core, standalone holding.
Who Should Pick Which?
VWRA is the right core holding if: you want one-fund global diversification across 3,784 stocks and 47 countries, you prioritise the lowest possible cost (0.14% TER), you are investing via monthly DCA for retirement and do not want to actively manage factor tilts, or you are using SRS funds for a long-horizon, low-maintenance allocation.
IWMO deserves a small satellite allocation (typically 10-20% of equities, not more) if: you already hold a diversified core like VWRA and want to express a tactical view that the 2026 momentum trend has further to run, you can tolerate higher single-sector concentration and the risk of a sharp reversal like May 2026’s momentum unwind, or you are comfortable monitoring quarterly rebalances and adjusting your allocation if momentum crowding signals (like Goldman’s percentile readings) flash a warning.
Neither VWRA nor IWMO is CPF-investable, since LSE-listed UCITS ETFs fall outside the CPF Investment Scheme’s approved list. Both are compatible with SRS accounts held at brokers that support LSE trading — see our SRS account ETF investing guide for the mechanics, or our broader factor investing ETF guide if you also want to compare IWMO against the quality (IWQU), value (IWVL) and low-volatility (MVOL) factor ETFs on the same LSE shelf.
How to Buy VWRA or IWMO in Singapore
Both tickers trade on the London Stock Exchange in USD, so the buying process is identical. Fund your brokerage account, search for the ticker (VWRA or IWMO), select the LSE listing specifically (not the Borsa Italiana, Xetra or SIX Swiss lines, which carry different tickers for the same fund), and place a market or limit order in USD.
Interactive Brokers (IBKR) remains the lowest-cost option for investors making larger or more frequent trades, with competitive FX conversion and no custody fee. Syfe Brokerage bundles USD wallet funding with a simpler mobile interface, making it a reasonable starting point for investors who want to begin DCA-ing into VWRA without juggling multiple apps — read our Syfe referral code and sign-up bonus page for current terms. FSMOne and Saxo Markets are also viable for Singapore investors who already hold SRS funds there; see our FSMOne referral code page for account-opening details. Whichever broker you use, confirm the LSE listing currency (USD vs GBP line) before placing your order, since the GBP-denominated line (VWRP for Vanguard, IWFM for iShares) will expose you to an additional GBP/USD conversion step.
Frequently Asked Questions
Is IWMO better than VWRA for Singapore investors?
Not as a replacement. IWMO has outperformed VWRA in three of the last four calendar years, driven by the AI-linked momentum rally, but it concentrates nearly 40% of its portfolio in one sector and offers no downside protection — both funds fell by a similar amount in the 2022 drawdown. Most Singapore investors should treat IWMO as a small satellite position alongside, not instead of, a core VWRA holding.
What is the difference between VWRA and IWMO?
VWRA tracks the FTSE All-World Index, holding 3,784 stocks across developed and emerging markets at a 0.14% TER with no style tilt. IWMO tracks the MSCI World Momentum Index, holding a narrower 349-stock subset of developed-market companies selected for strong recent price trends, at a 0.25% TER. Both are Ireland-domiciled, accumulating, LSE-listed UCITS ETFs.
Can I buy IWMO or VWRA using my CPF or SRS funds?
Neither is CPF-investable, since LSE-listed UCITS ETFs are not on the CPF Investment Scheme’s approved fund list. Both can be bought with SRS funds through brokers that support LSE trading from an SRS account, such as FSMOne or Saxo Markets — check with your specific broker, as SRS-eligible fund lists vary.
Is there a cheaper alternative to IWMO?
The Xtrackers MSCI World Momentum UCITS ETF (ticker XDEM, ISIN IE00BL25JP72) tracks the same MSCI World Momentum Index at the same 0.25% TER, so there is no cost advantage between the two — the main practical difference is that IWMO is roughly three times larger by assets (USD 6.42 billion vs approximately USD 2.0-2.2 billion for XDEM as at 2026), which can matter for bid-ask spreads on larger trades.
What happens to momentum ETFs when the trend reverses?
Momentum ETFs can fall sharply and quickly when crowded positioning unwinds, because the same mechanism that pushes winning stocks higher (increasing exposure to recent outperformers) works in reverse during a sell-off. On 8 May 2026, momentum-focused funds including MTUM fell over 1.5% in a single session as AI and software trades abruptly reversed, with Goldman Sachs noting momentum crowding had reached the 100th percentile of its five-year range beforehand.
How much of my portfolio should I allocate to a momentum ETF like IWMO?
There is no universal answer, but iShares’ own fund documentation cautions that factor ETFs are “less diversified than their parent index” and should be used “as part of a broader investment strategy” rather than as a standalone holding. Many factor-tilt strategies in professional portfolios limit any single factor sleeve to 10-20% of total equity exposure, with the remainder in a broad core holding like VWRA.
Ready to Build Your Core-and-Satellite ETF Portfolio?
Open a brokerage account and start with a low-cost core holding like VWRA. Use our referral links for exclusive sign-up bonuses.
This article was researched with the help of AI. While we strive to keep all information accurate and up to date, there may be errors. If you notice any discrepancies, please contact us.