VWRA Holdings Breakdown 2026: Full Country, Sector & Top Stock Allocation
What’s actually inside Vanguard’s “one fund for the whole world” ETF — verified against the official factsheet, with what it means for Singapore investors.
VWRA holds 3,784 individual stocks across 47 countries, but the top 10 positions — led by NVIDIA (4.8%) and Apple (4.2%) — make up roughly a quarter of the fund, and the United States alone accounts for 61.68% of assets. Verified against Vanguard’s official August 2026 factsheet, this means Singapore investors buying “one fund for the whole world” are really buying a US-tech-heavy portfolio with meaningful concentration risk.
Not financial advice. All figures are for educational reference only. Data verified as at 2 October 2026 against Vanguard’s official factsheet (data as at 31 August 2026) unless otherwise noted.
Table of Contents
Contents — Click to expand
- What Is VWRA, and What Does “Holdings” Mean Here?
- VWRA Key Facts at a Glance
- VWRA Top 10 Holdings (Verified)
- Country Allocation: Where Your Money Actually Goes
- Sector Allocation and Tech Concentration
- Is VWRA Too Concentrated? The Real Risk
- Who Should (and Shouldn’t) Rely on VWRA Alone
- Frequently Asked Questions
What Is VWRA, and What Does “Holdings” Mean Here?
VWRA is the London Stock Exchange ticker for the Vanguard FTSE All-World UCITS ETF (USD) Accumulating, an Ireland-domiciled fund (ISIN IE00BK5BQT80) that tracks the FTSE All-World Index. For a Singapore investor, buying one unit of VWRA means buying a proportional slice of every company the fund holds — currently 3,784 individual stocks spread across both developed and emerging markets. The fund is physically replicated, meaning Vanguard actually buys the underlying shares rather than using derivatives, which is one reason its tracking error has stayed as low as 0.07% per year over the past three years.
“Holdings” in this context refers to three things that matter for your actual risk exposure: which individual companies you own the most of, which countries your money is concentrated in, and which industries (sectors) dominate the portfolio. Most VWRA ETF Singapore guides cover the “what is it and how do I buy it” basics — this article focuses specifically on what’s inside the fund right now, using Vanguard’s own published factsheet data rather than approximations.
VWRA Key Facts at a Glance
| Metric | Detail |
|---|---|
| Full Name | Vanguard FTSE All-World UCITS ETF (USD) Accumulating |
| Ticker (LSE, USD) | VWRA |
| ISIN | IE00BK5BQT80 |
| Index Tracked | FTSE All-World Index |
| Domicile | Ireland |
| Structure | Accumulating (dividends reinvested automatically) |
| TER (Ongoing Charge) | 0.14% p.a. |
| Total Fund Assets | USD 85.32 billion (as at 31 Aug 2026) |
| Number of Holdings | 3,784 stocks (benchmark holds 4,263) |
| Inception Date | 23 July 2019 |
| Base Currency | USD |
Source: Vanguard FTSE All-World UCITS ETF factsheet, as at 31 August 2026.
VWRA Top 10 Holdings (Verified)
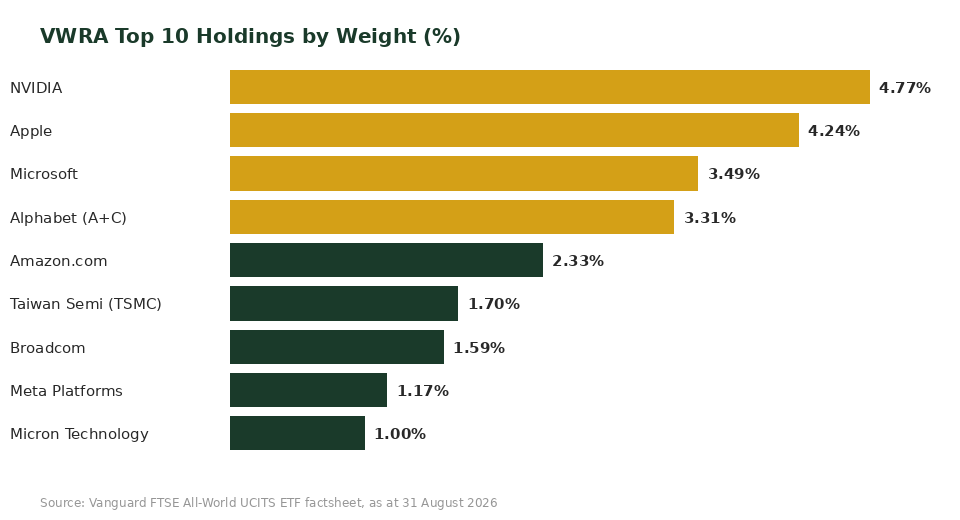
Because VWRA tracks a market-cap-weighted index, the biggest companies in the world automatically get the biggest weights — and in 2026, that still means US mega-cap technology. Below is the exact top 10 as published in Vanguard’s factsheet (Alphabet’s two share classes, GOOGL and GOOG, are combined into one line for clarity).
| Rank | Company | Sector | Weight |
|---|---|---|---|
| 1 | NVIDIA Corp | Technology | 4.77% |
| 2 | Apple Inc | Technology | 4.24% |
| 3 | Microsoft Corp | Technology | 3.49% |
| 4 | Alphabet Inc (GOOGL + GOOG) | Technology | 3.31% |
| 5 | Amazon.com Inc | Consumer Discretionary | 2.33% |
| 6 | Taiwan Semiconductor Mfg (TSMC) | Technology | 1.70% |
| 7 | Broadcom Inc | Technology | 1.59% |
| 8 | Meta Platforms Inc | Technology | 1.17% |
| 9 | Micron Technology Inc | Technology | 1.00% |
| 10 | — (Top 9 shown; remaining ~79% spread across 3,775 other stocks) | — | — |
Source: Vanguard FTSE All-World UCITS ETF holdings data, as at 31 August 2026.
Add it up: the top 9 individually-named positions alone account for roughly 23.6% of the entire fund. For a Singapore investor holding SGD 100,000 in VWRA, that means approximately SGD 23,600 is riding on just nine US technology-adjacent companies — a concentration level that’s easy to miss when the fund is marketed as “globally diversified.”
Country Allocation: Where Your Money Actually Goes
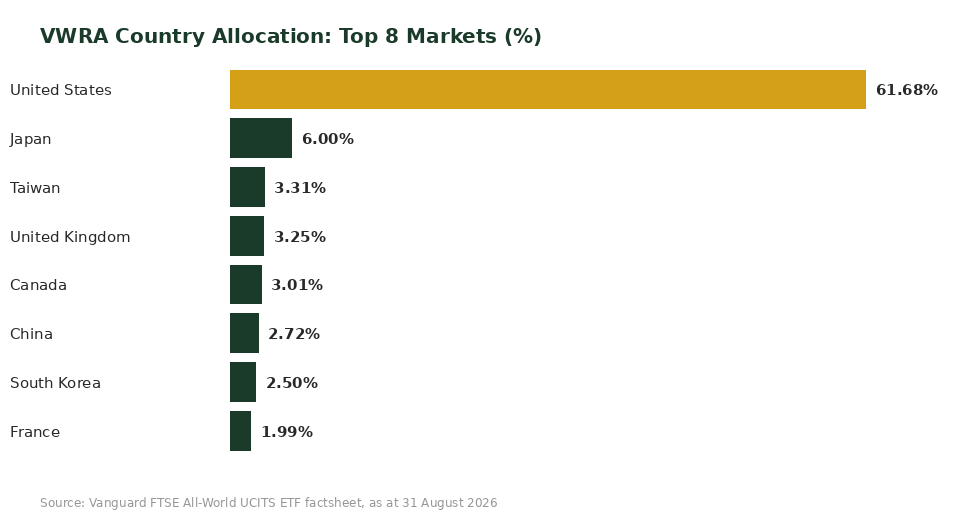
VWRA markets itself as exposure to “the world,” but the country breakdown shows that’s a generous description. The United States alone makes up more than six in every ten dollars invested — more concentrated than most Singapore investors assume when they first buy a “global” fund.
| Country | Region | Weight |
|---|---|---|
| United States | North America | 61.68% |
| Japan | Pacific | 6.00% |
| Taiwan | Emerging Markets | 3.31% |
| United Kingdom | Europe | 3.25% |
| Canada | North America | 3.01% |
| China | Emerging Markets | 2.72% |
| South Korea | Pacific | 2.50% |
| France | Europe | 1.99% |
| Switzerland | Europe | 1.97% |
| Germany | Europe | 1.89% |
| India | Emerging Markets | 1.59% |
| Singapore & all others | Various | ~9.9% combined |
Source: Vanguard FTSE All-World UCITS ETF factsheet, market allocation table, as at 31 August 2026.
Emerging markets collectively (Taiwan, China, South Korea, India and smaller markets) make up roughly 12% of the fund — meaningful, but a long way from the “equal exposure to developed and emerging markets” impression some investors carry into their first purchase. If you specifically want more emerging-market or Asia-ex-Japan weight than VWRA’s market-cap approach gives you, that’s a genuine gap worth knowing about before you commit your full portfolio to one fund.
Sector Allocation and Tech Concentration
Vanguard’s fund-level page does not publish a full sector breakdown table for VWRA directly, so the figures below are drawn from the FTSE All-World Index’s own published sector weights (the index VWRA tracks almost exactly, with an annualised tracking error of just 0.07%).
| Sector | Approx. Index Weight |
|---|---|
| Technology | ~34.1% |
| Financials | ~15.5% |
| Industrials | ~12.3% |
| Consumer Discretionary, Health Care, Communication Services, Consumer Staples, Energy, Materials, Real Estate & Utilities (combined) | ~38.1% combined |
Source: FTSE Russell / LSEG FTSE All-World Index factsheet, sector weights as at 31 August 2026. Vanguard does not publish an identical sector table for the ETF itself, so treat these as index-level approximations rather than fund-verified figures — the fund’s holdings-level data above is the verified figure.
Technology alone is now larger than the next two sectors combined, driven by the same handful of US mega-caps that dominate the top 10 holdings table. This is a structural feature of market-cap weighting, not a VWRA-specific design choice — but it means that a bad year for AI-chip and big-tech earnings will hit VWRA harder than its “globally diversified” label suggests to a first-time buyer.
Is VWRA Too Concentrated? The Real Risk
“Too concentrated” depends on what you’re comparing it to. Relative to buying a single Singapore stock, VWRA is extraordinarily diversified — 3,784 holdings across 47 countries is not a concentrated position by any normal definition. Relative to the marketing pitch of “one fund, instant global diversification,” the 61.68% US weight and ~34% technology weight are higher than most investors expect, and the two overlap heavily (most of the largest US names are also the largest technology names).
For a Singapore investor using VWRA as a core holding inside an CPF investment strategy or SRS portfolio, the practical implication is this: if you also separately hold individual US tech stocks, a US-heavy robo-advisor portfolio, or another global ETF like CSPX, your effective concentration in US mega-cap technology is higher than it looks across your accounts combined. Checking your total portfolio’s overlap — not just what each fund says on its own factsheet — is the step most investors skip.
Who Should (and Shouldn’t) Rely on VWRA Alone
VWRA is a reasonable single-fund core holding if you want market-cap-weighted global exposure, are comfortable that “global” means “roughly 62% US,” and don’t mind that technology earnings swings will move your portfolio more than a textbook “diversified” fund might suggest. It remains one of the lowest-cost, most liquid ways for a passive income Singapore strategy to get broad equity exposure without picking individual stocks.
Consider pairing it with — rather than relying on it alone — if you specifically want more emerging-market, Asia-ex-Japan, or value-tilted exposure than a market-cap index gives you, or if you already hold meaningful US tech exposure elsewhere in your portfolio. Comparing VWRA against a similar alternative, such as in our VWRA vs IWDA comparison, is a reasonable next step before committing new capital.
Not financial advice. All figures are for educational reference only and are correct as at the dates stated above; ETF holdings, country and sector weights change over time as Vanguard rebalances the fund.
Frequently Asked Questions
What does VWRA actually hold?
As at 31 August 2026, VWRA (the Vanguard FTSE All-World UCITS ETF) holds 3,784 individual stocks across 47 countries, tracking the FTSE All-World Index. Its top holding is NVIDIA at 4.77%, followed by Apple, Microsoft and Alphabet, with the United States making up 61.68% of total assets. The fund is physically replicated, meaning Vanguard holds the actual underlying shares rather than synthetic derivatives.
Is VWRA too concentrated in US technology stocks?
VWRA is more US- and tech-heavy than many investors expect from a “global” fund, but it is not concentrated in the traditional sense — it still holds 3,784 individual companies. The top 9 named positions account for roughly 23.6% of the fund, and technology makes up an estimated ~34% of the underlying FTSE All-World Index, both driven by the same handful of US mega-cap names.
What percentage of VWRA is in emerging markets?
Emerging markets — primarily Taiwan (3.31%), China (2.72%), South Korea (2.50%) and India (1.59%) — collectively make up roughly 12% of VWRA as at August 2026. This is lower than many investors assume, since developed markets (led by the US, Japan and the UK) dominate the fund’s market-cap weighting.
How often does VWRA's holdings data change?
Vanguard updates VWRA’s published holdings, country and characteristics data monthly, and the fund rebalances in line with FTSE Russell’s quarterly index review schedule. The figures in this guide are sourced directly from Vanguard’s factsheet as at 31 August 2026 — always check Vanguard’s official product page for the latest month’s data before making decisions.
Can I buy VWRA using my CPF or SRS funds?
VWRA is not CPFIS-approved, so you cannot buy it with CPF Ordinary Account or Special Account funds directly. It can be bought with SRS funds if your brokerage (such as IBKR, Saxo, moomoo or Syfe Brokerage) supports SRS-funded overseas trades — check with your broker, as support varies.
Is VWRA or CSPX better for diversification?
VWRA is more diversified than CSPX by design — CSPX tracks only the S&P 500 (500 US large-cap stocks), while VWRA holds 3,784 stocks across 47 countries including developed and emerging markets outside the US. However, because US mega-caps dominate both funds’ largest positions, the practical difference in top-10-holdings concentration is smaller than the headline “500 stocks vs 3,784 stocks” comparison suggests.
Ready to Build Your Global Portfolio?
Open a brokerage account and buy VWRA today, or check how it fits your retirement numbers first.
This article was researched with the help of AI. While we strive to keep all information accurate and up to date, there may be errors. If you notice any discrepancies, please contact us.