Starhill Global REIT Overseas Portfolio: Australia, Malaysia & Japan Assets Explained (2026)
A complete breakdown of Starhill Global REIT (SGX: P40U) international assets — geographic income split, currency exposure, and what overseas diversification means for your yield.
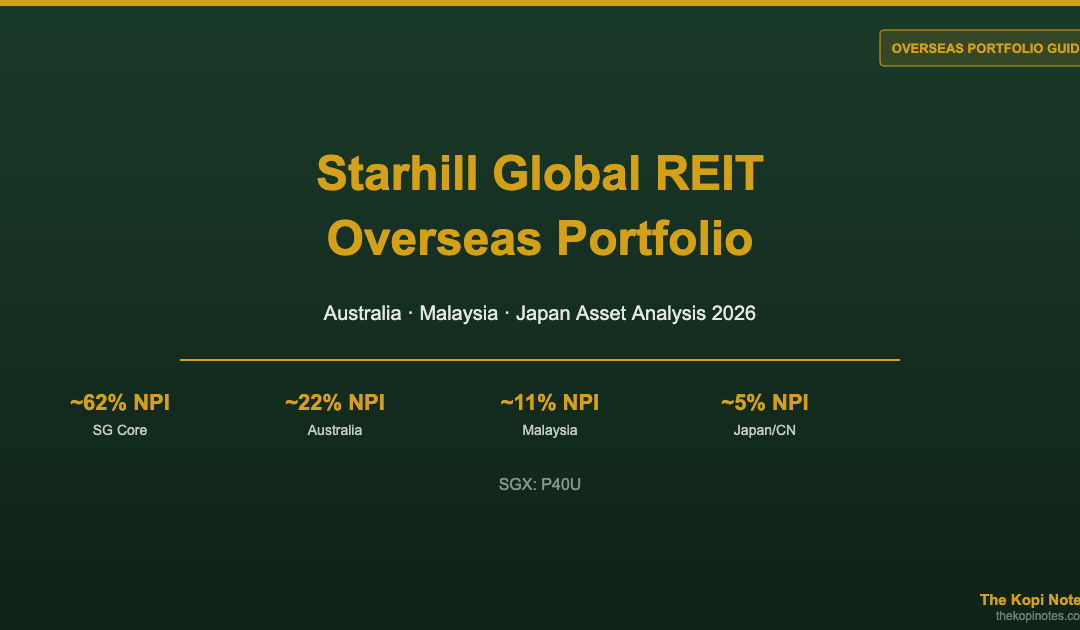
Starhill Global REIT (SGX: P40U) is Singapore’s most geographically diverse pure-retail REIT, holding shopping malls and hotel assets across Singapore, Australia, Malaysia, Japan, and China. Its Singapore flagship — Wisma Atria and the Ngee Ann City retail podium on Orchard Road — accounts for approximately 62% of net property income (NPI). Overseas assets in Australia and Malaysia contribute roughly 33%, adding AUD and MYR currency exposure alongside the Singapore core.
Not financial advice. All figures are for educational reference only. Data as at Q4 2025 / H1 2026 unless noted.
Table of Contents
Contents — Click to expand
- Starhill Global REIT Overseas Portfolio Overview
- Geographic NPI Split at a Glance
- Australia Assets: AUD Exposure & Master Lease Structure
- Malaysia Assets: Lot 10 & Starhill Gallery KL
- Japan & China: Small but Stable
- Currency Exposure & Hedging Strategy
- How Overseas Assets Affect Yield & DPU
- Comparison with Pure-Play Singapore REITs
- Should Overseas Diversification Worry Investors?
- Frequently Asked Questions
Starhill Global REIT Overseas Portfolio Overview
Most Singapore investors know Starhill Global REIT (P40U) for its marquee Orchard Road assets — Wisma Atria and the retail podium of Ngee Ann City. What many overlook is that the REIT holds a substantial portfolio of international properties that collectively contribute approximately 35–40% of total net property income.
The overseas portfolio spans three regions: Australia (the largest international market), Malaysia (second largest), and a small presence in Japan and China. This geographic spread was part of the REIT’s original mandate when it listed on SGX in 2005 under sponsor YTL Corporation Berhad — a Malaysian conglomerate with hospitality, retail, and infrastructure assets across Asia and Australasia.
As at FY2026, Starhill Global REIT’s portfolio comprises approximately 10 properties across five countries. The international assets are predominantly on long-term master leases — a structure that provides income stability but limits upside from leasing market recoveries. Understanding the overseas portfolio is essential for any investor evaluating P40U’s income sustainability and currency risk profile.
Geographic NPI Split at a Glance
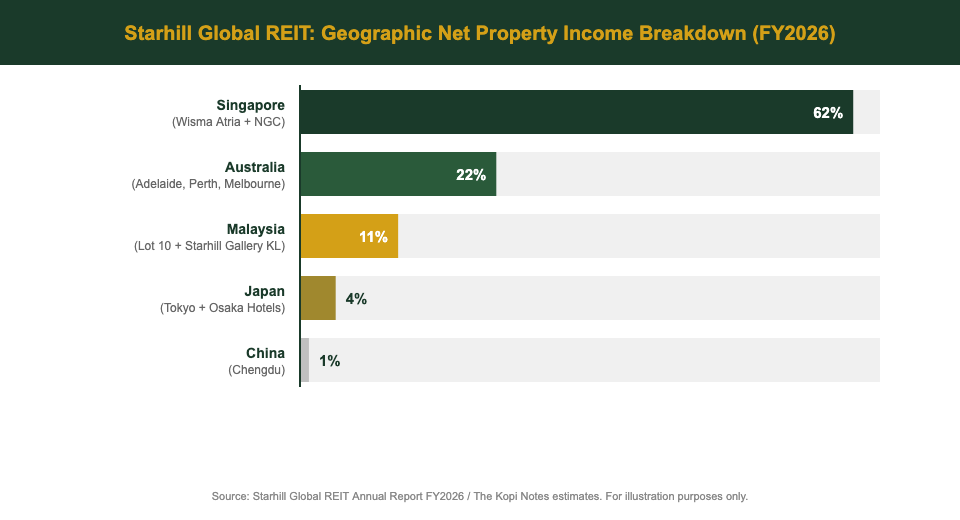
The table below summarises Starhill Global REIT’s estimated net property income breakdown by geography, based on the REIT’s most recent annual report and investor presentations for FY2026 (financial year ending 30 June 2026).
| Geography | Est. NPI Contribution | Key Currency | Key Assets |
|---|---|---|---|
| Singapore | ~62% | SGD | Wisma Atria, Ngee Ann City retail podium |
| Australia | ~22% | AUD | Myer Centre Adelaide, David Jones Perth, 206 Bourke St Melbourne |
| Malaysia | ~11% | MYR | Lot 10 KL, Starhill Gallery KL |
| Japan | ~4% | JPY | Daikanyama / Ebisu Fort (Tokyo), Osaka hotel |
| China | ~1% | CNY | Renhe Spring Zongbei, Chengdu |
Source: Starhill Global REIT Annual Report FY2026, investor presentations. NPI contributions are estimates based on reported segment data.
Australia Assets: AUD Exposure & Master Lease Structure
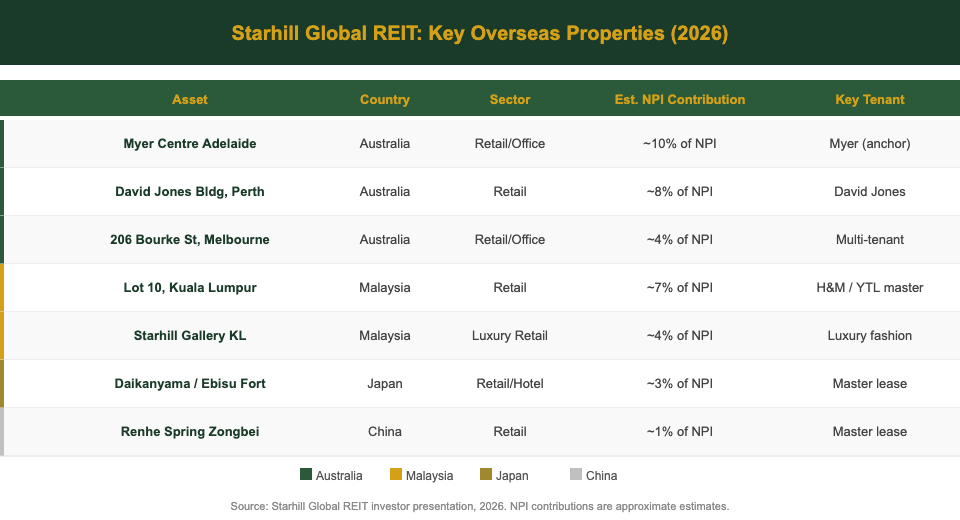
Australia is Starhill Global REIT’s largest overseas market, contributing approximately 22% of group NPI. The Australian portfolio comprises three properties located in Adelaide, Perth, and Melbourne — all in the mid-to-large retail and mixed-use segment.
Myer Centre Adelaide
The flagship Australian asset is Myer Centre Adelaide, a large-format retail and commercial complex in the Adelaide CBD. The property is anchored by Myer, one of Australia’s major department store chains, and features a mix of specialty retail, food & beverage, and office space. As at 2026, the asset maintains occupancy above 90% driven by the Myer anchor and long-term specialty tenants. The South Australian economy has benefited from defence industry investment and infrastructure spending, underpinning retail foot traffic.
David Jones Building, Perth
Located in Perth’s CBD, the David Jones Building provides retail and commercial space. David Jones, owned by South African retail group Woolworths Holdings, occupies a significant portion of the net lettable area on a long-term lease. Perth’s economy — closely tied to the resources sector — has remained resilient in 2025–2026 on the back of continued iron ore demand and elevated commodity prices.
206 Bourke Street, Melbourne
The Melbourne asset at 206 Bourke Street provides retail and office space in Melbourne’s prime retail corridor. Melbourne is Australia’s most populated city and has seen strong post-COVID retail recovery, particularly in its CBD retail strip. The property benefits from high foot traffic in one of Australia’s busiest shopping precincts.
Currency note: Australian dollar income is converted to SGD at prevailing exchange rates. The AUD/SGD exchange rate has ranged between 0.90 and 1.05 over the past decade. When the AUD weakens against SGD (as it did notably in 2018–2020), Australian NPI in SGD terms falls even if local rental income is stable. For income investors monitoring DPU, the AUD/SGD cross-rate is worth watching.
Malaysia Assets: Lot 10 & Starhill Gallery KL
Malaysia contributes approximately 11% of Starhill Global REIT’s NPI through two Kuala Lumpur properties — both located in the Golden Triangle, Kuala Lumpur’s prime retail and commercial district.
Lot 10, Kuala Lumpur
Lot 10 is a well-established mid-market fashion and lifestyle mall in Kuala Lumpur. The property is on a master lease to entities linked to the YTL Group, Starhill’s majority sponsor. This master lease structure — common across Starhill’s Malaysian assets — provides predictable rental income but insulates the REIT from capturing full upside when retail conditions are strong. As at 2026, Lot 10 has a prominent H&M as an anchor tenant following its repositioning several years ago.
Starhill Gallery, Kuala Lumpur
Starhill Gallery is a luxury retail and dining destination on Bukit Bintang. The mall focuses on high-end fashion brands and fine dining — a positioning that has faced pressures from regional luxury tourism patterns, particularly the shift in Chinese luxury spending post-2019. Despite challenges, the asset benefits from its master lease structure, which provides income floor protection for the REIT even during periods of softer retail performance.
Currency note: MYR income is received and partially hedged into SGD. The MYR has historically been weaker against SGD over the long term, meaning MYR-denominated income, when converted, can represent a headwind to SGD DPU over time. The MYR/SGD rate is a secondary but material risk factor for Starhill investors.
Japan & China: Small but Stable
Japan contributes approximately 4% of NPI through retail/hospitality assets in Tokyo (Daikanyama and Ebisu Fort) and an Osaka hotel. These assets are predominantly on master leases and are relatively small in scale. Post-COVID, Japan’s inbound tourism recovery has been strong, benefiting hospitality assets. JPY weakness against SGD in 2023–2024 did reduce the SGD value of Japanese income, though the small relative weighting limited overall portfolio impact.
China’s contribution — via Renhe Spring Zongbei in Chengdu — is minimal at approximately 1% of NPI. The asset is on a master lease to the Renhe Group. With China’s property market headwinds and consumer spending softness, this asset has had limited growth contribution, though the master lease structure insulates distribution income. Starhill management has signalled a strategic focus on its core SG, Australia, and Malaysia assets going forward.
Currency Exposure & Hedging Strategy
Approximately 38% of Starhill Global REIT’s gross revenue is denominated in foreign currencies. This creates meaningful foreign exchange risk for Singapore-dollar-denominated DPU distributions. The REIT’s currency exposure profile is as follows:
| Currency | Est. Revenue Exposure | 5-Yr AUD/MYR vs SGD Trend | Hedging Status |
|---|---|---|---|
| SGD | ~62% | — | No hedge needed |
| AUD | ~22% | Broadly stable / slight weakness | Partially hedged (rolling forward contracts) |
| MYR | ~11% | Gradual weakening vs SGD | Partial hedging |
| JPY | ~4% | Significant weakening 2023–2024 | Partially hedged |
| CNY | ~1% | Broadly stable | Minimal hedging (small exposure) |
Source: Starhill Global REIT investor presentations and financial statements. Hedging details based on disclosed treasury policies as at FY2026.
Starhill employs rolling foreign currency forward contracts to hedge a portion of its AUD, MYR, and JPY income. The hedge ratios vary year to year based on management’s treasury strategy. Investors should note that hedging reduces but does not eliminate currency translation risk — and hedging costs represent a small drag on translated income.
How Overseas Assets Affect Yield & DPU
For a Singapore investor, the question is straightforward: does the overseas portfolio help or hurt DPU (distribution per unit) in SGD terms?
The honest answer is mixed. On the positive side, overseas diversification provides income resilience — if Singapore retail experiences a downturn (as happened in 2020), overseas income can partially offset the decline. The Australian assets have generally delivered stable NPI on the back of long-term leases and an economically resilient market.
On the negative side, currency translation has historically been a headwind. The MYR has depreciated against the SGD over the long run, and the JPY saw significant weakness in 2023–2024. For every 10% depreciation in the AUD against SGD, Starhill’s total NPI in SGD terms falls by approximately 2.2% (22% × 10%), all else being equal. A similar shock in MYR would reduce NPI by roughly 1.1%.
As at FY2026, Starhill Global REIT’s key financial metrics:
- DPU (FY2026): 3.68 cents per unit (semi-annual distributions)
- Share price (approximate, Nov 2026): S$0.47–S$0.48
- Distribution yield: approximately 7.7%
- NAV per unit: approximately S$0.73
- Price-to-NAV: approximately 0.65x (35% discount)
- Portfolio gearing: approximately 36%
For income investors, the 7%+ yield is attractive relative to Singapore savings rates. Those considering passive income in Singapore would note Starhill’s high yield, but should factor in the structural headwinds: a depressed unit price, currency drag from overseas assets, and a DPU that remains well below its pre-COVID peak of approximately 5–5.5 cents.
Comparison with Pure-Play Singapore REITs
To understand Starhill’s overseas exposure in context, it helps to compare with Singapore-focused peers in the retail REIT segment.
| REIT | SG Exposure | Key Markets | Approx. Yield (2026) | P/NAV |
|---|---|---|---|---|
| Starhill Global REIT (P40U) | ~62% | SG, AU, MY, JP, CN | ~7.7% | ~0.65x |
| Frasers Centrepoint Trust (J69U) | 100% | Singapore (suburban) | ~5.5% | ~0.95x |
| Mapletree Pan Asia Comm. Trust (N2IU) | ~45% | SG, HK, JP, CN, KR | ~6.5% | ~0.70x |
| Lendlease Global Comm. REIT (JYEU) | ~75% | SG, Italy | ~7–8% | ~0.65x |
Source: SGX company filings, analyst reports, estimated figures as at Q3–Q4 2026. Yields based on trailing distributions and approximate unit prices.
The table shows that REITs with higher Singapore concentration (like Frasers Centrepoint Trust, the best S-REIT for suburban retail exposure) tend to trade at smaller NAV discounts and lower yields — reflecting investor preference for SGD-denominated income clarity. Starhill’s overseas exposure appears to contribute to its higher yield and larger NAV discount relative to pure-play Singapore retail REITs.
Investors seeking broader S-REIT exposure alongside a Singapore REIT ETF guide approach would note that an ETF investment in S-REITs provides built-in diversification without the concentrated currency risk that Starhill’s overseas portfolio introduces.
Should Overseas Diversification Worry Investors?
For long-term income investors evaluating Starhill Global REIT, the overseas portfolio is a secondary rather than primary concern — provided they understand the risks involved. The Singapore core (Wisma Atria, Ngee Ann City podium) remains a high-quality, irreplaceable Orchard Road asset with strong occupancy and consistent income. No amount of overseas diversification changes the fact that Starhill’s Singapore assets are its crown jewels.
The overseas assets, while adding geographic diversity, have historically represented more of an income stabiliser than a growth driver. The master lease structure used in Malaysia and Japan in particular limits rental upside. Australia remains the most commercially active overseas market — with open-market leasing exposure to anchor tenant dynamics and CBD retail trends.
For income investors, the key takeaway is this: Starhill’s overseas exposure introduces AUD and MYR currency risk equivalent to approximately 33% of portfolio income. If you are comfortable with that exposure in exchange for a ~7.7% yield and an Orchard Road core, Starhill can play a role in a diversified income portfolio. Using a Singapore retirement calculator to model DPU scenarios can help frame the income sustainability question in personal portfolio terms.
Investors who prefer pure-play Singapore income exposure with less currency noise should consider Frasers Centrepoint Trust or use a Syfe referral code to access diversified S-REIT portfolios through a managed platform, which may better suit investors who want broad exposure without individual REIT concentration risk. Those who prefer DIY investing can access Starhill through platforms like FSMOne — using an FSMOne referral code to begin — or directly through SGX via a brokerage account.
Frequently Asked Questions
What overseas assets does Starhill Global REIT own?
Starhill Global REIT (SGX: P40U) owns retail and hotel assets across Australia (Myer Centre Adelaide, David Jones Building Perth, 206 Bourke Street Melbourne), Malaysia (Lot 10 and Starhill Gallery in Kuala Lumpur’s Golden Triangle), Japan (retail/hotel assets in Tokyo and Osaka), and China (Renhe Spring Zongbei in Chengdu). Together these overseas assets contribute approximately 35–40% of the REIT’s total net property income, with Australia being the largest overseas market.
How does currency risk affect Starhill Global REIT's DPU in SGD?
Approximately 38% of Starhill Global REIT’s revenue is denominated in foreign currencies — mainly AUD (22%), MYR (11%), JPY (4%), and CNY (1%). When these currencies weaken against the SGD, the translated income falls even if local rental income is stable. The REIT employs partial hedging through rolling forward contracts for AUD, MYR, and JPY income, which reduces but does not eliminate currency risk. A 10% depreciation in AUD against SGD would reduce total NPI (in SGD terms) by approximately 2.2%, all else equal.
Are Starhill Global REIT's Malaysia and Japan assets on master leases?
Yes. Starhill Global REIT’s Malaysia assets (Lot 10 and Starhill Gallery KL) are predominantly structured under master leases to entities connected to the YTL Group, Starhill’s majority sponsor. Similarly, the Japan assets are on master lease arrangements. Master leases provide income stability and predictable distributions — the REIT receives a fixed lease payment regardless of the underlying retail occupancy. The trade-off is that upside from a strong retail environment is capped, as the master lessee captures the benefit of outperformance.
Does geographic diversification help or hurt Starhill Global REIT unitholders?
The answer is nuanced. Diversification across Australia, Malaysia, and Japan provides income resilience during Singapore-specific downturns (such as the COVID-19 impact on Orchard Road retail in 2020). However, it also introduces AUD and MYR currency translation risk, master lease structures that cap rental growth, and exposure to multiple regulatory and economic environments. Historically, the currency headwind from MYR depreciation has been a mild ongoing drag on SGD DPU. For most investors, the Singapore core (Wisma Atria, Ngee Ann City) remains the primary investment thesis — the overseas assets are a secondary diversifier rather than a growth engine.
How does Starhill Global REIT compare to other Singapore retail REITs?
Compared to pure-play Singapore retail REITs like Frasers Centrepoint Trust (J69U, 100% Singapore suburban malls), Starhill offers a higher yield (~7.7% vs ~5.5% for FCT) but trades at a steeper NAV discount (~0.65x vs ~0.95x for FCT). The yield premium partly reflects the overseas currency risk and the Orchard Road retail positioning (which carries more tourist-dependent revenue) versus suburban necessity retail (which FCT focuses on). For investors comfortable with Orchard Road and international exposure, Starhill’s yield premium can be attractive. For those wanting simpler, all-Singapore income, FCT or a diversified S-REIT ETF may be more appropriate.
Can I buy Starhill Global REIT using CPF or SRS funds?
Starhill Global REIT (P40U) is listed on the Singapore Exchange (SGX) and is eligible for purchase using CPF Investment Scheme (CPFIS) funds — both Ordinary Account (OA) and Special Account (SA), subject to CPF Board limits and your Investible Savings. It is also SRS (Supplementary Retirement Scheme) eligible. If you are considering including Starhill in a tax-advantaged retirement portfolio, it is worth checking your CPF investment limits and speaking with a financial adviser, as REITs with overseas income exposure can have specific tax nuances. You can also use a Singapore retirement calculator to model how Starhill’s projected DPU might contribute to retirement income scenarios.
Build Your S-REIT Income Portfolio
Whether you pick individual S-REITs like Starhill or prefer a managed portfolio — start building passive income today.
This article was researched with the help of AI. While we strive to keep all information accurate and up to date, there may be errors. If you notice any discrepancies, please contact us.