Keppel DC REIT 1H2026 Results: DPU Up 11.3% to 5.714 Cents
Actual results beat the pre-results scenario planning — full breakdown of revenue, occupancy and what analysts are saying now
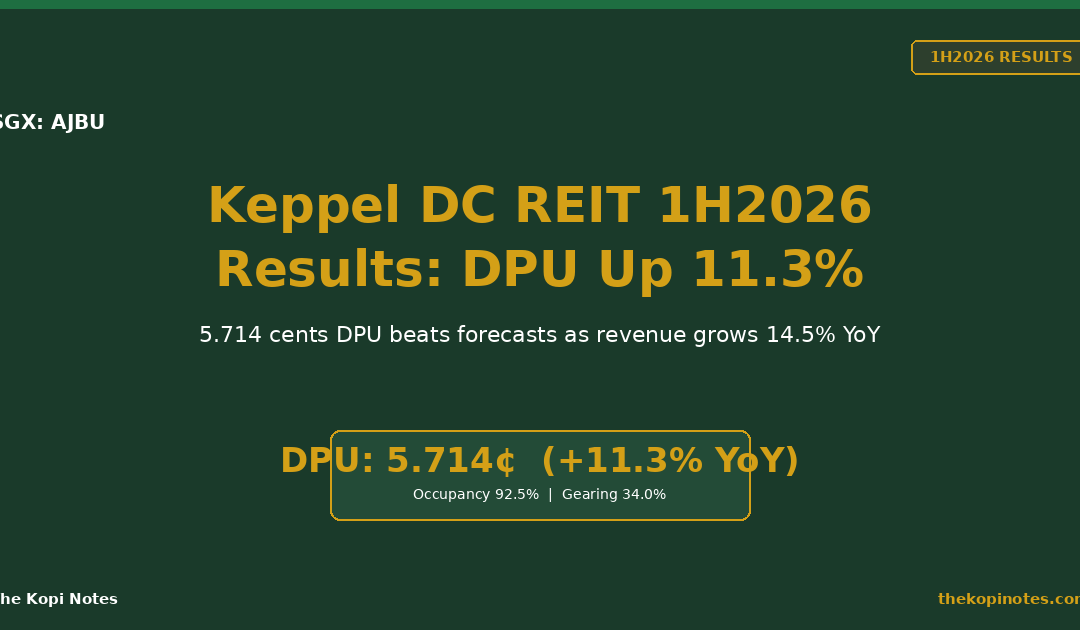
Keppel DC REIT reported its 1H2026 results on 23 July 2026: distribution per unit (DPU) rose 11.3% year-on-year to 5.714 cents. Gross revenue grew 14.5% to $242.0 million and net property income rose 15.1% to $210.4 million, even as portfolio occupancy dipped to 92.5% because one UK tenant vacated Cardiff Data Centre.
Not financial advice. All figures are for educational reference only. Data as at 23 July 2026 unless otherwise noted.
- DPU came in at 5.714 cents, up 11.3% year-on-year — about 53% of the full-year forecast, which OCBC Research called “ahead of expectations.”
- Occupancy fell to 92.5% from 95.6% in Q1, but that’s almost entirely one tenant leaving Cardiff Data Centre. Strip that out and occupancy is 95.3%.
- OCBC raised its target price to $2.86 (from $2.78) and kept its Buy call — about 22% above the $2.34 last close.
What Keppel DC REIT Just Reported
Keppel DC REIT (SGX: AJBU) released its 1H2026 unaudited financial results after trading hours on 23 July 2026, covering the six months to 30 June 2026. This follows our 19 July results preview and the 22 July results-day preview, which laid out three scenarios for how the numbers could land.
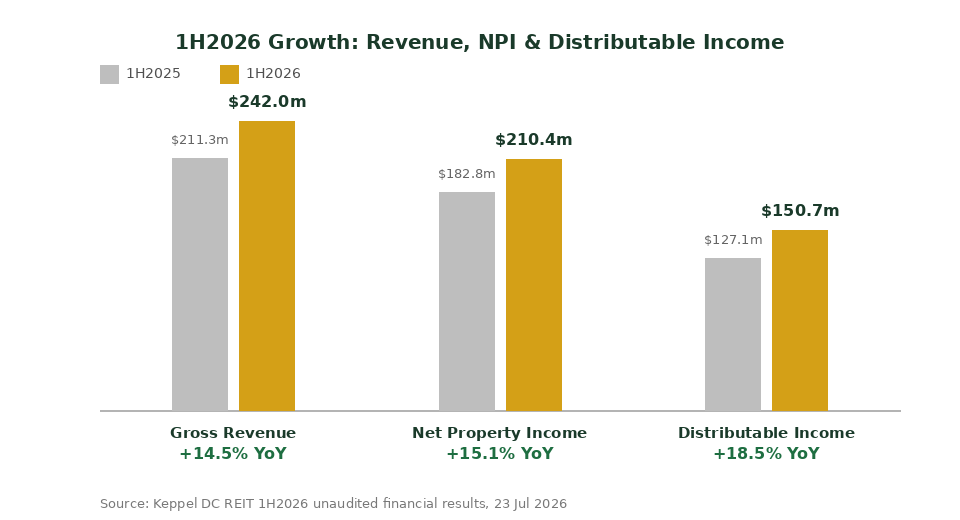
The headline: distributable income grew 18.5% to $150.7 million, and that translated into a DPU of 5.714 cents. Here’s how the full set of numbers stacks up against 1H2025.
| Metric | 1H2025 | 1H2026 | YoY |
|---|---|---|---|
| Gross Revenue | $211.3m | $242.0m | +14.5% |
| Net Property Income (NPI) | $182.8m | $210.4m | +15.1% |
| Distributable Income | $127.1m | $150.7m | +18.5% |
| DPU | 5.133¢ | 5.714¢ | +11.3% |
| Portfolio Occupancy | 95.8% (FY25) | 92.5% | −3.3 pts |
Source: Keppel DC REIT 1H2026 unaudited financial results announcement, 23 July 2026.
Unitholders on the register by the ex-distribution date of 30 July 2026 will receive this payout on 18 September 2026. If you’re not already holding units before then, you’ll miss this particular payout — but you’d still be buying into the growth story below.
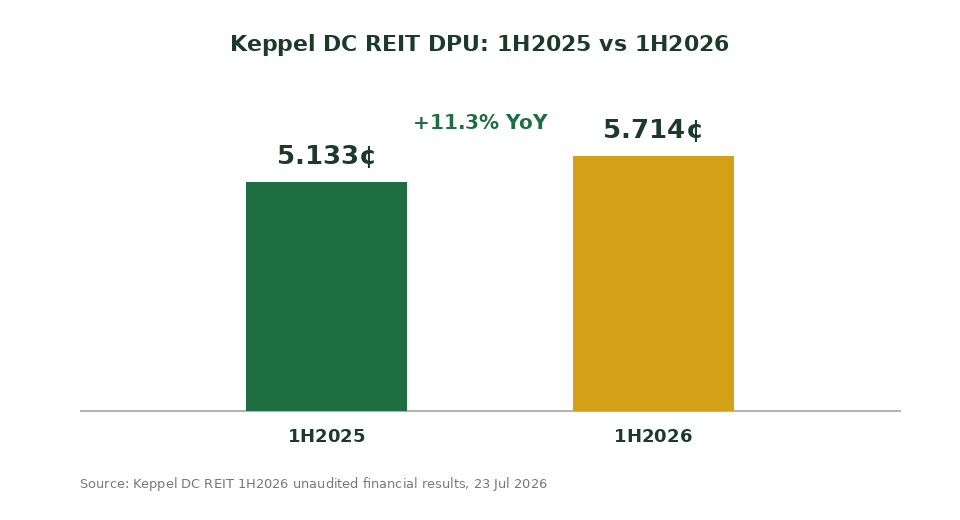
DPU Breakdown: Why It Beat Estimates
Distribution Per Unit (DPU) is basically how much cash each Keppel DC REIT unit pays you, per unit, for the half-year. It’s the single number most unitholders check first, because it drives your actual cash yield.
Our 22 July preview built expectations around the pace set in the 1Q2026 operational update, where DPU-equivalent growth ran at +13.2% year-on-year. The actual 1H2026 DPU growth of +11.3% is a touch slower than that Q1 run-rate. That’s not a red flag on its own — distributable income actually grew faster, at +18.5%, than DPU did. The gap between those two growth rates usually comes down to unit count from any capital raising during the period, which dilutes DPU even as the underlying dollar payout rises.
Here’s a rough way to check the quarterly split, even though Keppel DC REIT doesn’t publish a formal 2Q figure on its own: 1Q2026’s DPU-equivalent was 2.833 cents. Subtract that from the 5.714-cent 1H total and you get an implied 2Q2026 DPU of roughly 2.881 cents — a modest sequential improvement. We’re deriving this ourselves from the two disclosed figures, so treat it as an estimate, not an official number.
However you slice it, growth accelerated versus Keppel DC REIT’s own multi-year trend, and it came in solidly ahead of a “flat DPU” bear case that some investors had priced in after the Q1 occupancy softness. That’s the sense in which this is a beat.
The Occupancy Dip, Explained
Portfolio occupancy fell to 92.5% as at 30 June 2026, down from 95.6% just one quarter earlier. On a portfolio this size, a 3.1 percentage point drop in a single quarter looks alarming at first glance.
It isn’t broad-based. Keppel DC REIT itself flagged that occupancy would be 95.3% if you exclude Cardiff Data Centre in the UK, which lost a tenant and is now facing a notable vacancy. In other words, this is a single-asset story, not a sign that data centre demand across the 25-asset, 10-country portfolio is weakening.
Weighted Average Lease Expiry (WALE) — basically how many years of contracted rent the portfolio has locked in, on average — stood at 6.7 years by lettable area. Only 2.6% of lettable area is due to expire within 2026, with the bulk of remaining expiries staggered out past 2029. That gives management time to backfill Cardiff without a cliff-edge income hit.
The tenant base itself remains concentrated in resilient categories: internet/hyperscale enterprises make up 70.4% of rental income, IT services 13.9%, and telecoms 12.5%. Singapore alone is 62.8% of AUM, with Asia Pacific overall at 84.6% — a market where data centre demand has stayed structurally tight on land and power constraints.
Balance Sheet & Capital Management
Aggregate leverage — basically how much of the portfolio is funded by debt versus unitholders’ equity — improved to 34.0%, down about 110 basis points from the prior quarter. That leaves roughly $673 million of debt headroom before Keppel DC REIT would hit its own internal comfort ceiling.
Worth being precise here: that internal comfort level is not the same as the actual regulatory limit. MAS caps aggregate leverage for S-REITs at 50%, rising to 60% if the interest coverage ratio stays above 2.5x. Keppel DC REIT’s own ICR is 6.9x, so it has roughly $2.1 billion of headroom against the real regulatory ceiling — the 34%-to-40% figures you’ll see quoted are management’s own conservative internal target, not a hard MAS rule.
| Balance Sheet Metric | 1H2026 |
|---|---|
| Aggregate Leverage | 34.0% |
| Debt Headroom (to internal ceiling) | ~$673m |
| Headroom to MAS Regulatory Limit | ~$2.1bn |
| Average Cost of Debt | 2.6% |
| % Debt on Fixed Rates | 87% |
| Interest Coverage Ratio (ICR) | 6.9x |
Source: Keppel DC REIT 1H2026 unaudited financial results announcement, 23 July 2026.
With 87% of debt on fixed rates and an average tenor of 3.1 years, near-term earnings are largely insulated from further rate moves. That combination of low leverage, long WALE and fixed-rate debt is why the balance sheet reads as conservative even after a busy year of acquisitions.
Analyst Reaction: OCBC Raises Target to $2.86
OCBC Group Research issued a same-day note on 23 July 2026, maintaining its Buy call and raising the fair value target from $2.78 to $2.86. Against the last close of $2.34, that implies roughly 22% upside.
OCBC also flagged that the 5.714-cent 1H26 DPU represents about 53% of its full-year 2026 forecast — “ahead of expectations” in the broker’s own words — and raised its FY2026 and FY2027 DPU forecasts by 4.7% and 3.0% respectively on the back of the results.
You can back into a rough forward yield from that 53% disclosure: if 5.714 cents is 53% of the full-year number, the implied FY2026 DPU works out to about 10.78 cents. At the $2.34 last close, that’s an estimated forward yield of roughly 4.6%. This is our own calculation from OCBC’s disclosed ratio, not a figure Keppel DC REIT or OCBC published directly — treat it as indicative rather than exact.
OCBC’s key thesis: Keppel DC REIT is a leading proxy for data centre demand tied to digitalisation and cloud/AI adoption, with a long WALE, manageable leverage and recent acquisitions of AI-ready hyperscale assets in Singapore that reduce reliance on China-linked exposure.
Growth Catalysts Ahead
A few things underpin the outlook beyond this one set of results:
Portfolio reshaping. Keppel DC REIT completed the acquisition of Tokyo Data Centre 3 during 1H2026 and increased its effective stake in Keppel DC Singapore 3 & 4. It also divested Kelsterbach Data Centre in Germany, with part of the proceeds redeployed into the Tokyo acquisition — a classic recycle-into-higher-growth-markets move.
Positive rental reversions. New and renewal leases in Singapore and Australia — notably at Gore Hill Data Centre — came in at roughly 10% higher rents than the expiring leases in 1H2026, which is what’s driving organic income growth on top of acquisitions.
Sector tailwinds. Management points to global data centre capacity demand growing at a 25% CAGR through 2030, with Asia Pacific expected to account for roughly a third of that demand. Power availability, not land, is increasingly the binding constraint — which favours REITs like Keppel DC REIT that already hold power-secured, energy-resilient sites in Tier 1 markets.
ESG progress. Keppel DC REIT is targeting a 50% cut in Scope 1 and 2 emissions by 2035 versus a 2025 baseline, and at least 50% renewable energy usage in fully-fitted assets by 2030. It has secured roughly $608 million in green financing and holds green certification on eight assets so far.
What This Means For You
This isn’t a stock tip — just a framework for how to read the results depending on where you’re starting from.
| If you… | What today’s results tell you |
|---|---|
| Already hold Keppel DC REIT | DPU growth beat the recent run-rate, leverage improved, and the occupancy dip is a single-tenant issue with a long WALE cushioning it. The core thesis is intact. |
| Are considering buying in | You’re paying $2.34 for a REIT with an estimated ~4.6% forward yield and a Street target implying ~22% further upside. Weigh that against a still-narrow physical occupancy issue at one UK asset and general S-REIT rate-sensitivity before sizing a position. |
For broader context on how the S-REIT sector as a whole is trading through this recovery, see our S-REIT Recovery 2026 breakdown, and for a wider shortlist beyond Keppel DC REIT, our best S-REITs in Singapore 2026 guide compares yields across the sector. If you’re weighing Keppel DC REIT against your broader retirement income plan, our Singapore retirement calculator can help you model how S-REIT income fits into that.
Keppel DC REIT is CPFIS-OA and SRS eligible, so this can sit inside CPF Ordinary Account funds or an SRS account as well as a cash brokerage account. For the full company background, portfolio history and past dividend track record, see our Keppel DC REIT overview.
Frequently Asked Questions
When did Keppel DC REIT release its 1H2026 results?
Keppel DC REIT released its unaudited 1H2026 financial results after SGX trading hours on 23 July 2026, covering the six months ended 30 June 2026.
What was Keppel DC REIT's DPU for 1H2026?
Distribution Per Unit (DPU) for 1H2026 was 5.714 cents, up 11.3% from 5.133 cents in 1H2025. The ex-distribution date is 30 July 2026, with payment on 18 September 2026.
Why did Keppel DC REIT's occupancy fall in 1H2026?
Portfolio occupancy fell to 92.5% from 95.6% in Q1 2026, almost entirely because one tenant vacated Cardiff Data Centre in the UK. Excluding Cardiff, occupancy would be 95.3%.
What is Keppel DC REIT's target price after the 1H2026 results?
OCBC Group Research raised its target price to $2.86 from $2.78 on 23 July 2026, maintaining a Buy call. Against the $2.34 last close, that implies roughly 22% upside. Other brokers may have different targets, so check multiple sources before deciding.
Is Keppel DC REIT's gearing within MAS limits?
Yes. Aggregate leverage was 34.0% as at 30 June 2026, well within the MAS regulatory cap of 50% (up to 60% for REITs with an interest coverage ratio above 2.5x, which Keppel DC REIT easily clears at 6.9x). The REIT’s own internal comfort ceiling is more conservative than the MAS rule.
How much of Keppel DC REIT's debt is on fixed rates?
87% of Keppel DC REIT’s debt was on fixed rates as at 30 June 2026, with an average cost of debt of 2.6% and an average tenor of 3.1 years, which limits near-term exposure to further interest rate moves.
Is Keppel DC REIT eligible for CPFIS-OA and SRS?
Yes, Keppel DC REIT is eligible for investment using CPF Ordinary Account (CPFIS-OA) funds and Supplementary Retirement Scheme (SRS) funds, in addition to a regular cash brokerage account.
Ready to Start Investing in S-REITs?
Compare brokers and platforms before you buy your first (or next) Keppel DC REIT unit.
This article was researched with the help of AI. While we strive to keep all information accurate and up to date, there may be errors. If you notice any discrepancies, please contact us.