Frasers Logistics & Commercial Trust 3QFY26 Update: S$441.5 Million European Deal Lifts DPU as Leverage Hits 35.4% (SGX: BUOU)
A plain-English breakdown of FLCT’s 3QFY26 business update — the Germany/Netherlands acquisition, the leverage jump, and what it means for your distributions.
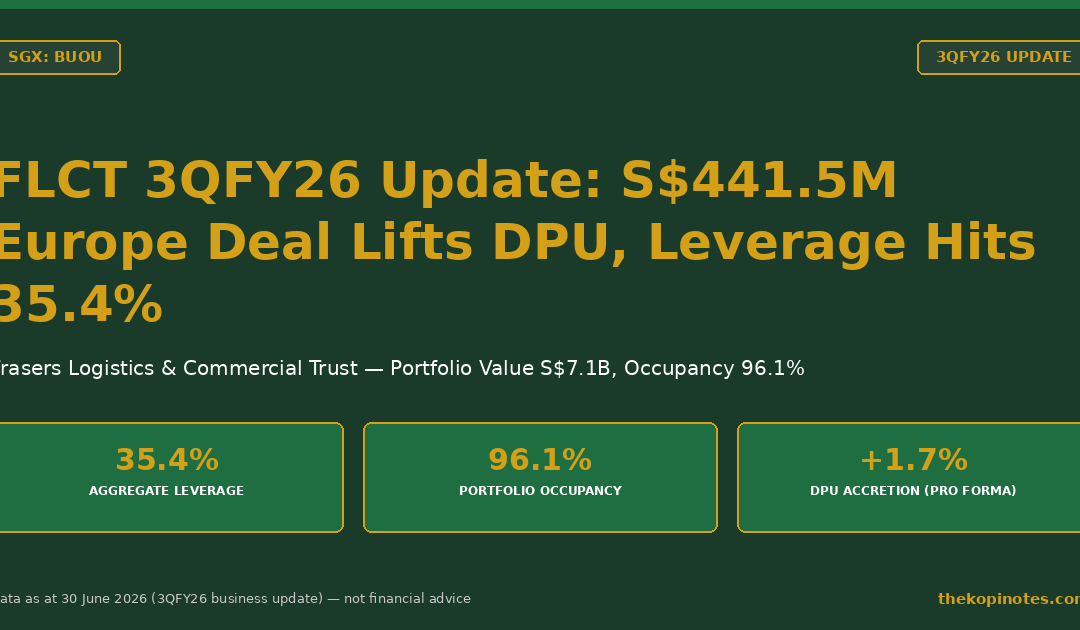
Frasers Logistics & Commercial Trust (SGX: BUOU) released its 3QFY26 business update on 30 July 2026 for the quarter ended 30 June 2026. Aggregate leverage rose to 35.4% after FLCT funded a S$441.5 million European logistics acquisition entirely with debt. The deal is +1.7% DPU-accretive on a pro forma basis, and overall portfolio occupancy held firm at 96.1%.
Not financial advice. All figures are for educational reference only. Data as at 30 June 2026 (3QFY26 business update, released 30 July 2026) unless otherwise noted.
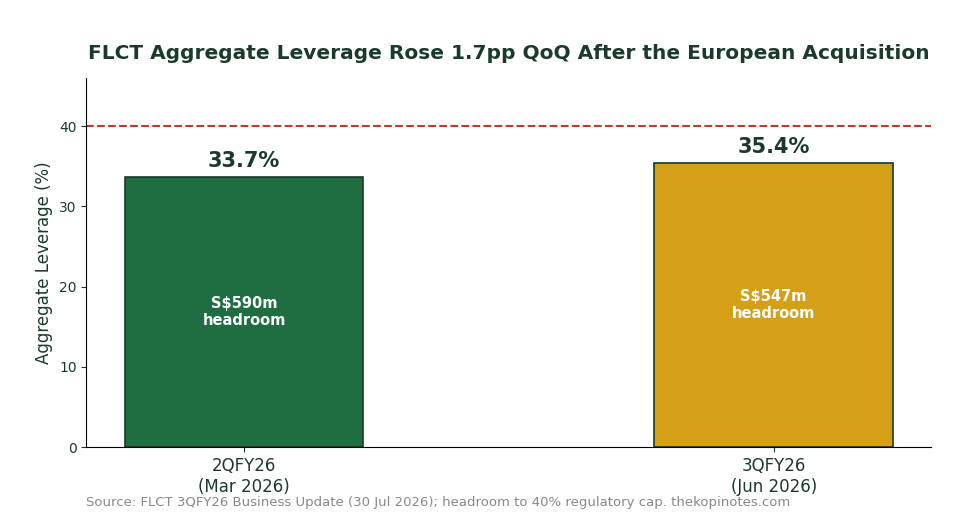
- FLCT bought 4 freehold logistics properties in Germany and the Netherlands for S$441.5m, 100% funded by debt — this pushed leverage from 33.7% to 35.4%, still S$547m below the 40% regulatory cap.
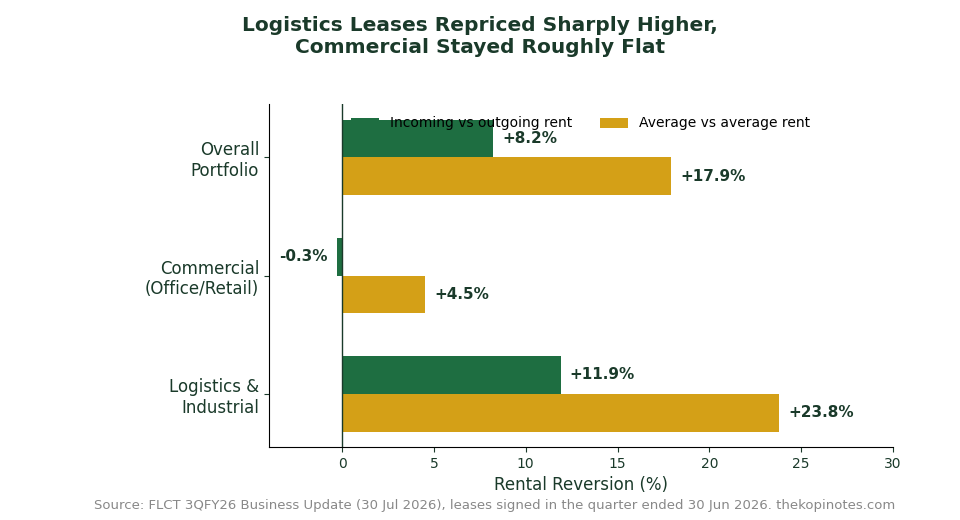
- The acquisition alone should add about +1.7% to DPU once it’s reflected in a full distribution period. Logistics leases also repriced up to 23.8% higher on renewal, while commercial (office/retail) leases stayed roughly flat.
- FLCT also sold a vacant UK office building at a 37.5% premium to valuation — a small but clean piece of capital recycling that supports NAV.
Table of Contents
Contents — Click to expand
- 3QFY26 at a Glance: The Key Numbers
- The S$441.5 Million European Acquisition Explained
- Leverage Climbs to 35.4% — Should You Worry?
- Rental Reversions: Logistics Strong, Commercial Flat
- Portfolio Breakdown: Where FLCT’s S$7.1B Sits
- The UK Divestment: Small Deal, Smart Move
- What This Means for Your DPU and Yield
- FLCT vs Other Industrial S-REITs
- Is FLCT a Buy After This Update?
- FAQ
3QFY26 at a Glance: The Key Numbers
FLCT owns 114 logistics, industrial and commercial properties worth S$7.1 billion across five countries: Australia, Germany, Singapore, the UK and the Netherlands. It’s one of the largest overseas-focused industrial S-REITs on the SGX.
This quarter’s update is a business update, not a full results release. FLCT only reports actual Distribution Per Unit (DPU) — how much cash you get per unit you own — twice a year, in its half-year results. So there’s no new DPU number this quarter. What we do get is a clear read on operations, leverage, and one significant capital move.
| Metric | 2QFY26 (Mar 2026) | 3QFY26 (Jun 2026) |
|---|---|---|
| Aggregate leverage | 33.7% | 35.4% |
| Portfolio occupancy | ~96% | 96.1% |
| WALE | ~5.0 years | 4.9 years |
| Cost of borrowing (TTM) | ~3.1% | 3.2% |
| Interest coverage ratio (ICR) | ~4.8x | 4.6x |
| Portfolio value | ~S$7.0bn | S$7.1bn |
Source: FLCT 3QFY26 Business Update, 30 July 2026. 2QFY26 figures approximated from prior-quarter disclosures.
The S$441.5 Million European Acquisition Explained
The headline event this quarter is FLCT’s purchase of four freehold logistics properties in Germany and the Netherlands for €294.9 million (about S$441.5 million). Unitholders approved the deal at an EGM on 15 July 2026, and it closed before quarter-end.
Here’s why it matters. The properties are fully occupied, on freehold land, with a Weighted Average Lease Expiry (WALE) of 5.7 years. Tenants include multinational logistics operators tied to e-commerce and “new economy” supply chains — the kind of tenant FLCT has been actively chasing across its portfolio.
FLCT paid slightly below appraised value — a small but meaningful signal that management isn’t overpaying to chase growth. The deal is 100% funded by external debt, which is exactly why leverage jumped this quarter. Management expects the acquisition to add roughly +1.7% to DPU on a pro forma basis, once a full period of income is captured.
This continues a pattern from FLCT: expand in Europe’s most resilient logistics corridors, keep assets freehold where possible, and lean on tenants in defensive sectors. Germany now makes up close to a quarter of the portfolio by value.
Leverage Climbs to 35.4% — Should You Worry?
A 1.7 percentage point jump in one quarter sounds like a lot. In practice, 35.4% still leaves FLCT with S$547 million of headroom before it hits the Monetary Authority of Singapore’s (MAS) 40% regulatory leverage cap for S-REITs. That’s a comfortable buffer, not a red flag.
Three details support that read. First, 69.3% of FLCT’s borrowings are on fixed rates, which limits how much a single rate move can hurt distributable income. Second, the interest coverage ratio (ICR) — how many times over FLCT’s operating income covers its interest expense — sits at 4.6 times. Anything above 2.5x is generally considered healthy for a REIT. Third, FLCT has S$526 million of undrawn committed credit facilities against just S$80 million of debt maturing in 4QFY2026, so there’s no refinancing cliff on the horizon.
That said, this is worth watching. If FLCT keeps funding acquisitions entirely with debt instead of mixing in equity or asset sales, leverage will keep climbing toward that 40% ceiling. One more debt-funded deal of similar size would meaningfully erode the buffer.
Rental Reversions: Logistics Strong, Commercial Flat
Rental reversion measures how much higher (or lower) a lease renews compared to the old rate. It’s one of the clearest signs of whether a REIT’s underlying rents are catching up to the market.
In 3QFY26, FLCT signed 30 leases covering 146,609 sqm. The Logistics & Industrial (L&I) segment led the way: leases renewed 11.9% higher than the expiring rate, and 23.8% higher on an average-to-average basis. That’s a strong result, driven by tight logistics supply in key markets like Australia and Germany.
The Commercial segment (office and retail) told a different story — reversions were roughly flat, at -0.3% on an incoming-vs-outgoing basis and +4.5% on average-vs-average. Office demand globally remains soft, and FLCT’s commercial exposure is a much smaller slice of the portfolio, so this isn’t a major drag, but it’s a clear divergence worth tracking each quarter.
Portfolio Breakdown: Where FLCT’s S$7.1B Sits
FLCT’s S$7.1 billion portfolio is spread across five countries and three property types. Here’s the full breakdown as at 30 June 2026.
| Geography | % of Portfolio Value |
|---|---|
| Australia | 46.8% |
| Germany | 24.9% |
| Singapore | 12.3% |
| United Kingdom | 9.8% |
| Netherlands | 6.2% |
By asset type, Logistics & Industrial dominates at 75.3% of the portfolio, with Business Parks at 20% and Office at just 4.7%. That skew toward logistics and industrial space is a big part of why FLCT’s rental reversions have held up so well — warehouse and logistics demand across Australia and Europe has stayed resilient even as global office demand cools.
Tenant concentration is low: the top 10 tenants together make up just 26.4% of gross rental income (GRI), and no single tenant contributes more than 5%. Around 89.4% of GRI comes from government-linked organisations or tenants in resilient sectors like logistics, manufacturing and new-economy businesses. On top of that, 85.6% of leases carry CPI-linked indexation or fixed annual escalations, which gives FLCT some built-in protection against inflation.
The UK Divestment: Small Deal, Smart Move
In June 2026, FLCT sold the Juniper building at Blythe Valley Business Park in the UK for £2.2 million (about S$3.7 million). That’s a 37.5% premium over its April 2026 valuation.
The building had sat empty since June 2024. Selling a vacant, non-income-producing asset at a large premium to book value is a clean win — it’s accretive to Net Asset Value (NAV) per unit, and it removes an asset that was contributing nothing to distributable income. It’s a small transaction in dollar terms, but it’s the kind of disciplined capital recycling that, done consistently, keeps a portfolio’s earning power concentrated in assets that actually pay rent.
What This Means for Your DPU and Yield
FLCT’s most recent declared DPU was 2.95 Singapore cents for 1HFY26 (six months to 31 March 2026). At a unit price of around S$0.96-0.97 (early July 2026, before this update), that 1H DPU annualises to roughly a 6.1% yield.
Here’s a worked example using FLCT’s own guidance. Management says the European acquisition should add about +1.7% to DPU on a pro forma basis. Apply that to the 2.95¢ base: 2.95 × 1.017 ≈ 3.00¢ per half-year, once the acquisition’s income is fully reflected in a distribution period.
On its own, S$5 on a 10,000-unit holding (about S$295 in distributions today) isn’t life-changing. But it compounds across FLCT’s entire 3.8 billion units outstanding, and it comes without diluting your ownership — the deal was funded by debt, not a rights issue or placement. That’s the real story here: FLCT is growing its income base without asking unitholders for more cash.
Keep in mind this is management’s own pro forma estimate, not a confirmed number. The actual 2HFY26 DPU (covering April to September 2026) won’t be confirmed until FLCT’s full-year results, expected around November 2026.
FLCT vs Other Industrial S-REITs
How does FLCT’s leverage and yield stack up against other industrial and logistics-focused S-REITs after this update? Here’s a snapshot.
| S-REIT | Aggregate Leverage | Approx. Yield | Occupancy |
|---|---|---|---|
| FLCT (SGX: BUOU) | 35.4% | ~6.1% | 96.1% |
| CapitaLand Ascendas REIT (SGX: A17U) | ~37-38% | ~5.8% | ~93-94% |
| Mapletree Logistics Trust (SGX: M44U) | ~40% | ~6.4% | ~95-96% |
Source: thekopinotes.com internal REIT comparison data and respective REITs’ most recent quarterly disclosures. CLAR and MLT figures approximate — refer to each REIT’s own report for exact figures, as at their most recent disclosure dates.
FLCT’s leverage sits comfortably in the middle of the pack, and its 96.1% occupancy is competitive with its industrial S-REIT peers. Where it stands out is tenant diversification across five developed markets, which reduces the risk of any single country’s downturn hitting distributions hard.
Is FLCT a Buy After This Update?
There’s plenty to like here. FLCT bought quality freehold assets at a discount to valuation, kept occupancy above 96%, and grew its income base without diluting unitholders. Logistics rents are repricing strongly higher, and the balance sheet still has meaningful headroom before hitting the regulatory leverage cap.
The risks are worth naming too. Leverage is trending up, not down, and another debt-funded deal would eat further into that S$547 million buffer. Commercial (office) rents remain soft globally, and FLCT still carries some exposure there. And with no new DPU confirmed this quarter, you’re relying on management’s pro forma accretion estimate until the 2HFY26 results land around November 2026.
According to 12 analysts tracked by StockAnalysis.com, the consensus rating on FLCT is “Buy,” with a 12-month price target of around S$1.07 — implying upside from the ~S$0.96-0.97 level seen in early July 2026, though prices move daily and you should check a live quote before acting.
For income-focused Singapore investors who already like the industrial S-REIT space, this update reinforces the thesis: modest, disciplined growth, backed by a diversified and largely inflation-protected income stream. It’s not a dramatic re-rating story — it’s a REIT quietly doing its job.
If you’re building a diversified S-REIT income portfolio, it’s worth reading how FLCT compares to our full Frasers Logistics & Commercial Trust investor guide, and checking your own leverage math with our free S-REIT Gearing Ratio & ICR Calculator. Many local investors also use brokers like Syfe (referral code SRPRFFFCD) to build a REIT-heavy dividend portfolio at low cost — note TKN may earn a referral fee if you sign up through this link. And if REITs are one leg of a broader retirement plan, our Singapore retirement calculator can help you see how distribution income fits into the bigger picture.
External sources: FLCT 3QFY26 Business Update summary, Minichart.com.sg (30 Jul 2026); FLCT Investor Relations — Publications; StockAnalysis.com — BUOU Overview.
Frequently Asked Questions
What did FLCT announce in its 3QFY26 business update?
FLCT (SGX: BUOU) released a business update for the quarter ended 30 June 2026 on 30 July 2026. The headline news was a S$441.5 million acquisition of four freehold logistics properties in Germany and the Netherlands, funded entirely by debt, which pushed aggregate leverage up to 35.4%.
Did FLCT declare a new DPU this quarter?
No. FLCT only declares Distribution Per Unit (DPU) twice a year, at its half-year and full-year results. This was a business update, not a results release, so no new DPU figure was announced. The most recent confirmed DPU was 2.95 Singapore cents for 1HFY26 (six months to 31 March 2026).
Is FLCT's leverage of 35.4% a concern?
Not on its own. 35.4% is still S$547 million below the MAS regulatory cap of 40% for S-REITs, and FLCT’s interest coverage ratio of 4.6 times is healthy. It’s a trend worth watching if FLCT keeps funding acquisitions purely with debt, but it isn’t a red flag at current levels.
How much will the European acquisition add to FLCT's DPU?
Management estimates the deal is about +1.7% DPU-accretive on a pro forma basis, once a full period of rental income from the new properties is reflected in a distribution. That’s roughly 0.05 Singapore cents on top of the 2.95¢ 1HFY26 base, or about S$5 extra per half-year for a unitholder with 10,000 units.
What is FLCT's dividend yield in 2026?
Based on the 1HFY26 DPU of 2.95 Singapore cents annualised, and a unit price of roughly S$0.96-0.97 (early July 2026), FLCT’s distribution yield works out to approximately 6.1% per annum. This will change as the unit price moves and once 2HFY26 DPU is confirmed.
What properties did FLCT sell this quarter?
FLCT divested the Juniper building at Blythe Valley Business Park in the UK for £2.2 million (about S$3.7 million) in June 2026 — a 37.5% premium to its April 2026 valuation. The building had been vacant since June 2024, so the sale is accretive to NAV and removes a non-income-producing asset.
When will FLCT report its next full results?
FLCT’s financial year ends 30 September. Its full-year FY2026 results, which will include the confirmed 2HFY26 DPU, are typically released around late October to November. Check FLCT’s investor relations page closer to the date for the exact announcement.
How does FLCT compare to Mapletree Logistics Trust or CapitaLand Ascendas REIT?
All three are diversified industrial/logistics S-REITs. FLCT’s 35.4% leverage sits below Mapletree Logistics Trust’s roughly 40% and is broadly in line with or below CapitaLand Ascendas REIT’s leverage. FLCT’s occupancy at 96.1% is competitive with both peers. Yield and leverage shift every quarter, so always check each REIT’s latest disclosure before comparing.
This article was researched with the help of AI. While we strive to keep all information accurate and up to date, there may be errors. If you notice any discrepancies, please contact us.