CICT 1H2026 Results: DPU Up 7.1% to 6.02 Cents as Paragon Completes and Leverage Falls to 37.4% (SGX: C38U)
CapitaLand Integrated Commercial Trust’s latest half-year results show resilient distribution growth even after April 2026’s enlarged unit base — here is the full breakdown for unitholders and prospective investors.
Not financial advice. This article is for general informational and educational purposes only and does not constitute investment advice, a recommendation, or an offer to buy or sell any security. Always do your own research or consult a licensed financial adviser before making investment decisions.
CapitaLand Integrated Commercial Trust (CICT, SGX: C38U) — Singapore’s largest diversified REIT by market capitalisation — released its 1H2026 financial results on 12 August 2026. Distribution per unit (DPU) rose 7.1% year-on-year to 6.02 Singapore cents, even as the trust absorbed a larger unit base following April 2026’s private placement that helped fund the S$3.9 billion Paragon acquisition.
Distributable income grew even faster, up 13.3% year-on-year to S$466.7 million, supported by the full consolidation of CapitaSpring and stronger operating performance across the portfolio. This article breaks down the key numbers, what drove the growth, and what to watch heading into 2H2026.
Table of Contents
Contents — Click to expand
- CICT 1H2026 Results at a Glance
- DPU Growth Despite Enlarged Unit Base
- Revenue & NPI: CapitaSpring and Gallileo Drive Growth
- Occupancy and Rental Reversions
- Balance Sheet: Leverage Eases to 37.4%
- Growth Pipeline: Paragon, Asia Square Tower 2, Hougang Central
- CICT Dividend Yield and Valuation
- How CICT Compares to Other S-REITs
- Risks to Watch
- How to Invest in CICT
- Frequently Asked Questions
CICT 1H2026 Results at a Glance
Here are the headline numbers from CICT’s 1H2026 (six months to 30 June 2026) results, released 12 August 2026:
| Metric | 1H2026 | YoY Change |
|---|---|---|
| Gross Revenue | S$846.8 million | +7.5% |
| Net Property Income (NPI) | S$630.5 million | +8.7% |
| Distributable Income | S$466.7 million | +13.3% |
| DPU | 6.02 cents | +7.1% |
| Portfolio Occupancy | 95.6% | — |
| Aggregate Leverage | 37.4% | -1.1 ppt QoQ |
| Average Cost of Debt | 2.9% | Stable |
| NAV per Unit | S$2.15 | +0.5% since end-2025 |
The 6.02-cent DPU comprises the 3.98-cent advanced distribution already paid on 8 June 2026, plus a further 2.04 cents payable on 25 September 2026 to unitholders on the register as at 20 August 2026.
DPU Growth Despite Enlarged Unit Base
The headline number that matters most to income investors is DPU, and CICT’s 7.1% year-on-year growth to 6.02 cents is notable given the context: units in issue rose 5.8% year-on-year to 7.73 billion following April 2026’s private placement, which helped fund the Paragon acquisition.
Dilution from a larger unit base typically drags on DPU growth unless the capital raised is deployed into income-accretive assets fast enough. In CICT’s case, distributable income grew a faster 13.3% year-on-year to S$466.7 million — comfortably outpacing the unit base expansion — which is why DPU still grew rather than shrank. This was supported by stronger operating performance across the portfolio and lower net interest expense.
Compare this to CapitaLand Ascendas REIT’s (CLAR) 1H2026 results, where distributable income also grew 8.6% year-on-year to S$359.4 million but DPU held flat at 7.482 cents due to a similarly enlarged unit base — a common theme across CapitaLand-managed REITs funding acquisitions via equity this year.
Revenue & NPI: CapitaSpring and Gallileo Drive Growth
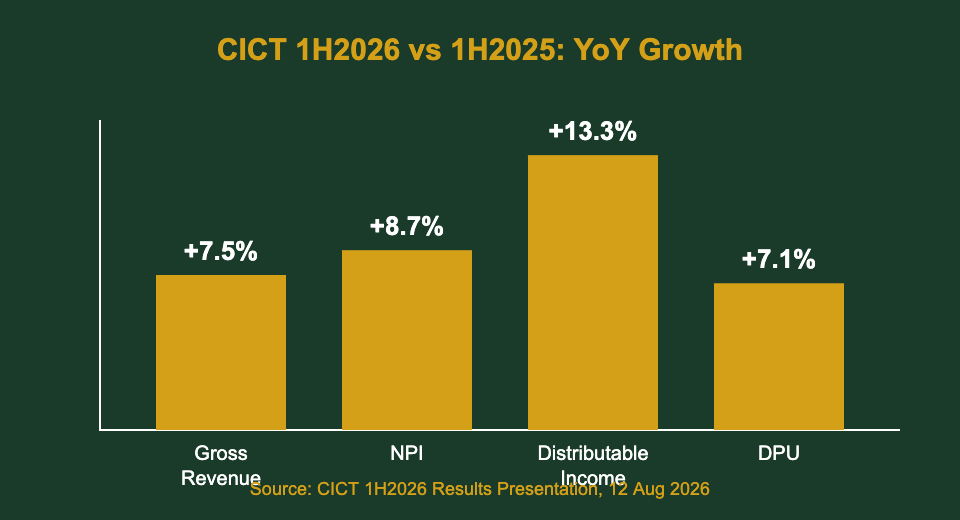
Gross revenue grew 7.5% year-on-year to S$846.8 million, while NPI rose at a faster 8.7% to S$630.5 million — meaning margins improved even as the portfolio expanded. The main drivers were the full consolidation of CapitaSpring, following CICT’s step-up to 100% ownership in August 2025, and progressive income contribution from Gallileo, an office asset in Frankfurt.
This was partly offset by the divestment of Bukit Panjang Plaza in February 2026. Breaking down NPI by segment:
- Office NPI: S$241.0 million, up from S$183.6 million a year earlier — the standout gainer, largely from CapitaSpring’s full consolidation
- Integrated Development NPI: S$178.9 million, broadly stable
- Retail NPI: S$210.6 million, down slightly from S$218.8 million, mainly due to the loss of income from the divested Bukit Panjang Plaza
Distribution income from joint ventures fell 19.5% year-on-year to S$16.7 million — this is a mechanical effect of CapitaSpring moving from joint-venture accounting to full consolidation, not a sign of weaker JV performance.
Occupancy and Rental Reversions
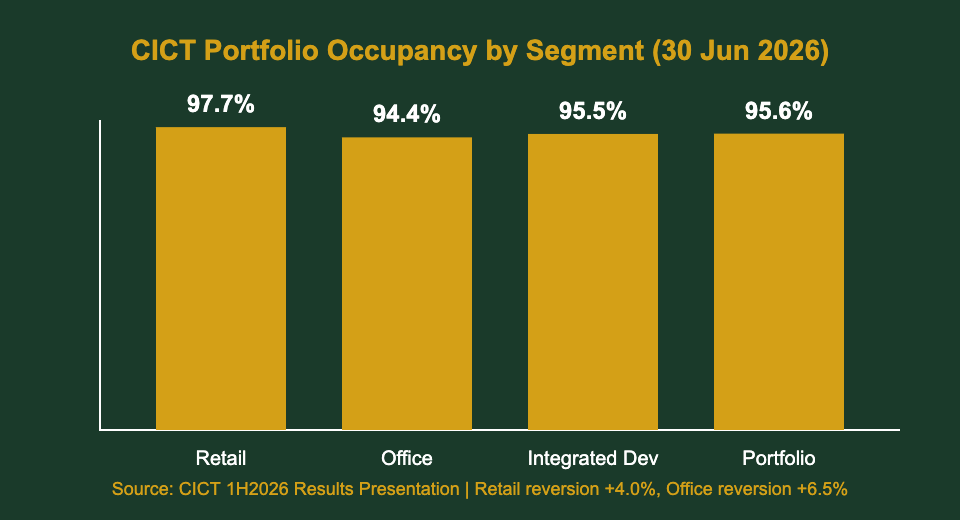
Portfolio occupancy remained healthy at 95.6% as at 30 June 2026. Retail occupancy led at 97.7% — comfortably ahead of URA’s islandwide retail occupancy rate of 93.5% — while office occupancy improved to 94.4% from 93.7% in the prior quarter. Integrated development occupancy eased slightly to 95.5%, mainly due to upcoming asset enhancement works at Plaza Singapura and The Atrium@Orchard.
Rental reversions stayed positive across the board: retail rental reversion came in at +4.0% and office rental reversion at +6.5% for 1H2026. Tenant retention held at 83.9% for retail and 70.8% for office. Portfolio weighted average lease expiry (WALE) stood at 3.0 years, and no single tenant contributed more than 5% of gross rental income — a sign of diversified, low-concentration tenant risk.
Balance Sheet: Leverage Eases to 37.4%
CICT’s balance sheet strengthened over the half. Aggregate leverage declined to 37.4% as at 30 June 2026, down from 38.5% at end-March 2026 — comfortably within MAS’s regulatory gearing limit of 50% for S-REITs, and with headroom to spare. The improvement partly reflects the temporary use of private placement proceeds to repay loans following the Paragon acquisition funding exercise.
Average cost of debt held stable at 2.9%, with about 78% of borrowings on fixed rates — a meaningful buffer against interest rate volatility. Average debt maturity stood at 4.1 years, and interest coverage improved slightly to 3.9 times from 3.8 times. NAV per unit rose 0.5% since end-2025 to S$2.15. CICT’s issuer ratings were maintained at A3 by Moody’s and A- by S&P, reflecting continued balance sheet discipline even through a major acquisition cycle.
Investors who want to track gearing trends across the S-REIT sector can use our S-REIT Gearing Ratio & ICR Calculator to model how leverage and interest coverage compare against MAS limits for any REIT.
Growth Pipeline: Paragon, Asia Square Tower 2, Hougang Central
CICT’s growth pipeline remains active on multiple fronts. The trust completed its acquisition of Paragon on 1 July 2026 at an agreed property value of S$3.9 billion, adding a prime Orchard Road retail and medical office asset to the portfolio — we covered the deal in depth in our CICT share price and Paragon acquisition guide.
To help fund and de-risk that acquisition, CICT expects to complete the divestment of Asia Square Tower 2 in 2H2026, with net sale proceeds of around S$2.45 billion. This capital recycling should support balance sheet flexibility and free up funds for higher-yielding redeployment.
CICT also has several asset enhancement initiatives (AEIs) underway or planned, including works at Tampines Mall, Lot One Shoppers’ Mall, Raffles City Tower, Capital Tower, Plaza Singapura, and The Atrium@Orchard. Longer term, CICT is part of a consortium developing the commercial component of a mixed-use project at Hougang Central, expected to complete in 2030 or 2031 — a reminder that CICT’s growth story extends well beyond this results cycle.
CICT Dividend Yield and Valuation
Based on an annualised 1H2026 DPU of 12.04 cents (6.02 cents x 2) and CICT’s unit price of S$2.51 as at 11 August 2026 — the trading day before results were announced — this implies a distribution yield of approximately 4.8%. That sits below CICT’s own longer-run historical average yield band and below some smaller-cap S-REITs, reflecting the market’s premium for CICT’s scale, liquidity, and blue-chip tenant base.
NAV per unit of S$2.15 versus a S$2.51 unit price implies the trust trades at roughly a 17% premium to book — a valuation that assumes continued execution on the Paragon integration and Asia Square Tower 2 divestment. For the full official results breakdown, see CapitaLand’s official 1H2026 results release.
How CICT Compares to Other S-REITs This Results Season
CICT’s 1H2026 results fit a broader pattern across large-cap S-REITs this earnings season: enlarged unit bases from 2026 equity fundraising, offset by stronger operating income. We’ve tracked this trend across our recent 1H2026 results coverage — see how CLAR’s 1H2026 results (linked earlier) stacked up, and revisit our earlier CICT 1Q2026 results investor guide and CICT share price target roundup for how analysts’ full-year forecasts have evolved since.
| REIT | 1H2026 DPU Growth | Aggregate Leverage |
|---|---|---|
| CICT (C38U) | +7.1% | 37.4% |
| CapitaLand Ascendas REIT (A17U) | Flat (7.482 cents) | ~37-38% |
The takeaway: distributable income growth alone doesn’t guarantee DPU growth once a REIT has issued new units — investors should check both metrics, not just headline income figures, before assuming a “good quarter” translates into a bigger payout per unit.
Risks to Watch
- Execution risk on Asia Square Tower 2 divestment: the planned S$2.45 billion sale in 2H2026 is not yet completed; delays or a lower final price would affect the deleveraging and capital recycling narrative.
- Office segment softness: while CICT’s office occupancy improved to 94.4%, the broader Singapore Grade A office market remains sensitive to hybrid-work trends and corporate cost-cutting.
- Interest rate and refinancing risk: although 78% of debt is fixed-rate, the remaining floating-rate exposure and future refinancing at prevailing rates could pressure distributable income if rates stay elevated longer than expected.
- Integration risk on Paragon: the S$3.9 billion acquisition needs to deliver on its occupancy and rental assumptions to justify its valuation and support DPU accretion in 2H2026 and beyond.
- Valuation premium: at roughly 17% above NAV per unit, CICT’s unit price already prices in a fair amount of execution success — a slower-than-expected ramp-up could compress the premium.
How to Invest in CICT
CICT trades on the SGX under the ticker C38U and can be bought through any Singapore brokerage with SGX market access, or via a robo-advisor / brokerage platform that supports SGX-listed REITs. If you’re setting up a brokerage or investment account for the first time, our referral partners offer sign-up promotions:
- Endowus (referral code 2V343) — access to SGX-listed REITs and cash management portfolios
- Syfe (referral code SRPRFFFCD) — brokerage and REIT+ portfolios
- FSMOne (referral code P0544985) — low-cost SGX brokerage access
Before committing capital, revisit the gearing calculator linked earlier in this article to sanity-check CICT’s balance sheet strength against your own risk tolerance and against other REITs you’re considering.
Frequently Asked Questions
What was CICT's DPU for 1H2026?
CICT reported a 1H2026 DPU of 6.02 Singapore cents, up 7.1% year-on-year. This consists of a 3.98-cent advanced distribution paid on 8 June 2026 and a further 2.04 cents payable on 25 September 2026 to unitholders on record as at 20 August 2026.
Why did CICT's distributable income grow faster than its DPU?
Distributable income grew 13.3% year-on-year to S$466.7 million, faster than the 7.1% DPU growth, because CICT’s unit base expanded 5.8% year-on-year after April 2026’s private placement used to help fund the Paragon acquisition. More units in issue means the same pool of distributable income is spread over a larger base, so per-unit growth lags total income growth.
What is CICT's current aggregate leverage and is it within MAS limits?
CICT’s aggregate leverage stood at 37.4% as at 30 June 2026, down from 38.5% in the prior quarter. This is comfortably within MAS’s regulatory limit of 50% for S-REITs, and reflects the temporary use of private placement proceeds to repay debt after the Paragon acquisition.
What is CICT's dividend yield after the 1H2026 results?
Based on an annualised 1H2026 DPU of 12.04 cents and a unit price of S$2.51 (as at 11 August 2026), CICT’s implied distribution yield is approximately 4.8%.
What is the Asia Square Tower 2 divestment and why does it matter?
CICT expects to complete the divestment of Asia Square Tower 2 in 2H2026 for net sale proceeds of around S$2.45 billion. This capital recycling exercise is intended to help fund the Paragon acquisition and support balance sheet flexibility, allowing CICT to redeploy capital into higher-yielding opportunities.
The Bottom Line
CICT’s 1H2026 results show a trust managing growth and dilution reasonably well: DPU still rose 7.1% despite a larger unit base, leverage improved, and the portfolio maintained high occupancy with positive rental reversions across retail and office. The bigger swing factors for 2H2026 are execution-dependent — completing the Asia Square Tower 2 divestment on schedule and ramping up Paragon’s income contribution. For income investors already holding CICT, the results support the thesis of a resilient, well-diversified blue-chip S-REIT; for prospective buyers, the ~4.8% yield and ~17% premium to NAV mean you’re paying up for that stability and scale.
This article was researched with the help of AI. While we strive to keep all information accurate and up to date, there may be errors. If you notice any discrepancies, please contact us.