CapitaLand Ascendas REIT vs CICT 2026: Which CapitaLand REIT Belongs in Your Portfolio?
A head-to-head comparison of Singapore’s largest industrial REIT and top commercial REIT — yield, gearing, portfolio mix, and rate-cut sensitivity.
Table of Contents
CLAR vs CICT: The Core Difference
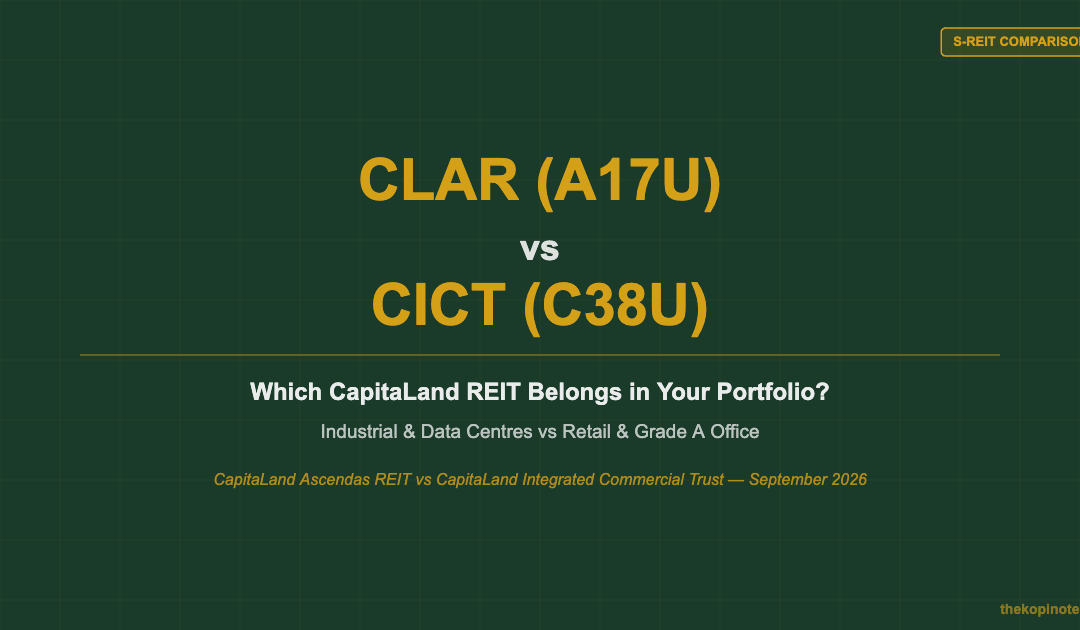
Both CapitaLand Ascendas REIT (SGX: A17U) and CapitaLand Integrated Commercial Trust (SGX: C38U) carry the CapitaLand name, but they are fundamentally different investments.
CLAR is Singapore’s largest industrial and logistics REIT — 228 properties spread across 10 countries, with a significant data centre and logistics component. Its tenant base includes multinationals, tech companies, and third-party logistics firms. It thrives when global trade flows and digital infrastructure demand are strong.
CICT is Singapore’s largest commercial REIT — a curated portfolio of retail malls and Grade-A offices concentrated in Singapore’s prime locations, including CapitaSpring, Raffles City, and Ion Orchard. It benefits when consumer spending and office occupancy in the CBD are healthy.
As we head into the final stretch of 2026 with the US Federal Reserve expected to cut rates at the 17–18 September FOMC meeting, both REITs stand to gain — but in different ways, to different degrees, and with different risk profiles. This guide breaks it all down.
See our deep-dive: CapitaLand Ascendas REIT Investor Guide 2026 and CICT 2026 Guide.
CapitaLand Ascendas REIT (CLAR) Overview
CLAR is the powerhouse of the CapitaLand REIT stable. Listed on the SGX since 2002, it has grown from a purely Singapore industrial REIT into a diversified global real estate platform.
1H2026 Highlights
- DPU: 7.482 cents (1H2026), supported by +8.6% growth in distributable income
- Gearing: 37.3% — well within the 50% MAS regulatory limit, with ample debt headroom
- Portfolio size: 228 properties across Singapore, Australia, the US, UK, and 6 other countries
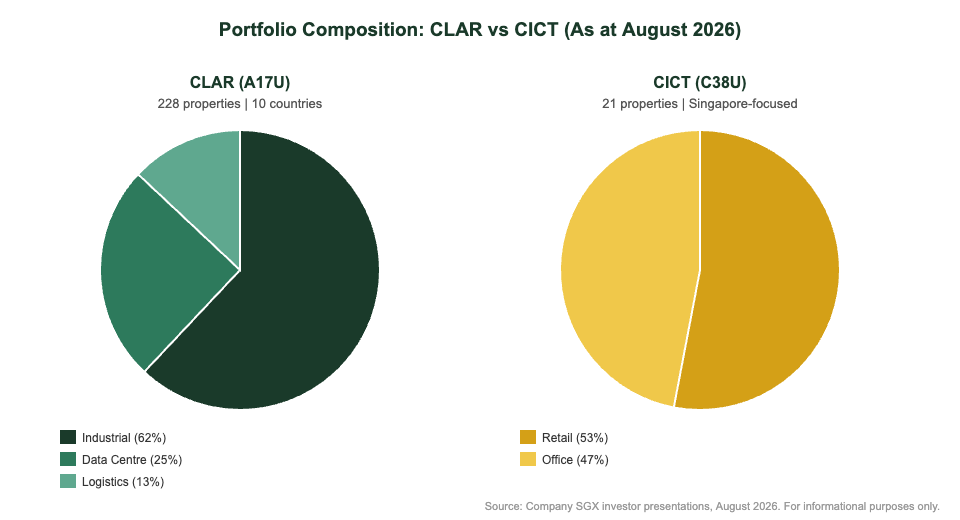
- Asset types: Industrial (~62%), Data Centres (~25%), Logistics/Integrated Development (~13%)
- Approximate yield: ~5.5% at current prices (August 2026)
- NAV per unit: ~S$3.13
What makes CLAR particularly interesting in 2026 is the data centre tailwind. The global surge in AI infrastructure investment is driving demand for colocation and hyperscale data centre space in Australia and Singapore, two of CLAR’s core markets. Meanwhile, logistics assets benefit from nearshoring trends and continued e-commerce growth.
For the full analysis, see our CLAR rate-cut catalyst deep-dive (2026).
CapitaLand Integrated Commercial Trust (CICT) Overview
CICT was formed in 2020 from the merger of CapitaLand Mall Trust and CapitaLand Commercial Trust, creating Singapore’s largest diversified commercial REIT by assets under management.
Key Metrics (August 2026)
- Portfolio: 21 properties — predominantly in Singapore, with select assets in Germany and Australia
- Asset mix: Retail malls (~53%), Grade-A offices (~47%)
- Gearing: ~39% — slightly higher than CLAR, but still prudently managed
- Approximate yield: ~5.7% at current prices
- Occupancy: Retail ~99%, Office ~95%+
- Key properties: Ion Orchard (50% stake), Raffles City Singapore, CapitaSpring, Funan, Plaza Singapura, Gallileo (Frankfurt)
CICT’s retail portfolio is its anchor. Singapore’s Orchard Road malls have demonstrated resilient shopper traffic and tenant sales post-pandemic, and the ION Orchard co-ownership with CapitaLand Investment gives CICT access to Singapore’s most premium retail address.
On the office side, Singapore Grade-A CBD occupancy has held up despite hybrid work trends, helped by limited new supply and strong demand from financial services and professional services firms.
Head-to-Head Metrics Comparison
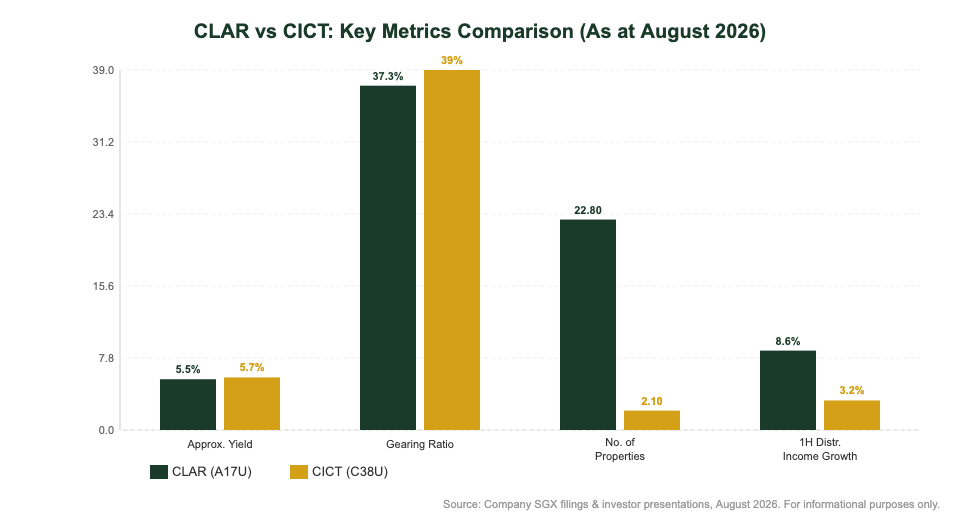
Here is how the two REITs compare on the metrics that matter most to Singapore dividend investors:
| Metric | CLAR (A17U) | CICT (C38U) |
|---|---|---|
| Sector | Industrial / Logistics / Data Centre | Retail / Grade-A Office |
| No. of Properties | 228 | 21 |
| Geographic Reach | 10 countries | 3 countries (SG-dominant) |
| 1H2026 DPU | 7.482 cents | ~5.3–5.5 cents (est.) |
| Approx. Yield | ~5.5% | ~5.7% |
| Gearing | 37.3% | ~39% |
| Distributable Income Growth (1H) | +8.6% | ~+3–4% (est.) |
| Rate-Cut Sensitivity | High (lower refi cost, USD assets) | High (lower borrowing cost) |
| CPF-investable | Yes (OA) | Yes (OA) |
Note: Yield figures are approximate and based on trailing/annualised DPU at August 2026 prices. Not financial advice. Verify against latest SGX filings before investing.
Portfolio Composition Deep-Dive
The biggest difference between CLAR and CICT is their underlying asset base — and this drives everything else: income stability, growth prospects, and rate-cut sensitivity.
CLAR: Industrial-First, Globally Diversified
CLAR’s 228-property portfolio spans Singapore, Australia, the United States, the United Kingdom, India, and five other markets. This geographic diversification means CLAR’s income is partly in USD and AUD, providing some natural hedge against SGD fluctuations — though it also introduces FX risk that pure-SG investors should factor in.
The data centre segment (~25% of portfolio) is the structural growth driver. With hyperscalers like Microsoft, Google, and AWS expanding their APAC infrastructure, demand for carrier-neutral colocation in Singapore and Sydney remains robust. CLAR’s DC assets command long weighted-average lease expiries (WALE) and CPI-linked rent escalations — an ideal income quality profile.
The industrial and logistics segment (~62%) serves a more cyclical tenant base but benefits from Singapore’s push as a regional supply chain hub, and nearshoring trends driving demand for high-specifications factories in developed markets.
CICT: Singapore Retail + CBD Office
CICT’s 21-property portfolio is concentrated and high-quality. Its retail assets — anchored by ION Orchard and Raffles City — sit in Singapore’s prime tourist and shopping corridors, delivering consistent footfall and tenant sales. Retailer demand in Singapore’s Orchard belt has remained tight with low vacancy, supporting positive rental reversions.
On the office side, CapitaSpring (a Green Mark Platinum office tower in Raffles Place) is CICT’s flagship — near-full occupancy and rents firmly in the Grade-A range. Singapore’s Grade-A CBD office market has been more resilient than global peers due to limited new supply through 2026.
Rate-Cut Sensitivity: Who Benefits More?
With the US Fed’s September 2026 FOMC meeting on the horizon, rate-cut sensitivity is top of mind for S-REIT investors. Both CLAR and CICT are net beneficiaries of a lower-rate environment, but the mechanics differ.
CLAR’s rate-cut upside comes from two channels: lower refinancing costs on its multi-currency debt stack (USD, AUD, SGD), and a valuation re-rating as global cap rates compress. CLAR’s 37.3% gearing leaves ample room for accretive acquisitions once the rate cycle turns — management has flagged a healthy pipeline in Australia and the US.
CICT’s rate-cut upside is more direct: lower SORA benchmarks mean cheaper floating-rate debt costs, translating more gross income into distributable income. CICT’s Singapore-centric portfolio also benefits from improved consumer confidence and potential retailer expansion when borrowing costs fall.
On balance, CLAR may see a larger re-rating catalyst given its diversified multi-currency debt and the global nature of its cap rate benchmark. But CICT’s higher gearing (relative to CLAR) means each basis-point cut has a slightly larger proportional cost-saving effect on its income statement.
Bottom line: both REITs are worth holding into September FOMC — but CLAR’s income growth momentum (+8.6% distributable income in 1H2026) gives it an edge on near-term DPU trajectory.
Which REIT Is Right for You?
There is no universal answer — the right choice depends on your investment objective, risk appetite, and existing portfolio composition.
| Investor Profile | Consider CLAR | Consider CICT |
|---|---|---|
| Want global diversification | ✅ | — |
| Want Singapore-centric exposure | — | ✅ |
| Want data centre growth exposure | ✅ | — |
| Prefer prime retail assets | — | ✅ |
| Priority: lower gearing | ✅ (37.3%) | — (~39%) |
| Priority: highest current yield | — | ✅ (~5.7%) |
| Priority: income growth momentum | ✅ (+8.6%) | — |
| Hold in CPF OA | ✅ | ✅ |
For many Singapore retail investors, holding both makes strategic sense. CLAR provides diversification into industrial, logistics, and data centres with a global footprint; CICT anchors the portfolio with high-quality Singapore commercial assets. Together, they cover different segments of the S-REIT spectrum without major overlap.
If you invest through Endowus, both CLAR and CICT appear in their S-REIT income-focused portfolios. Use referral code 2V343 via our Endowus referral page to get your first S$10,000 managed for free for 6 months. Alternatively, FSMOne (code P0544985) lets you invest in both REITs commission-free — see our FSMOne referral guide.
For a broader view of the S-REIT landscape, see our Best S-REITs 2026 Yield Comparison.
Frequently Asked Questions
What is the difference between CLAR and CICT?
Which has a higher dividend yield — CLAR or CICT?
Can I invest in CLAR and CICT using CPF OA funds?
Will CLAR or CICT benefit more from the September 2026 Fed rate cut?
Is CLAR or CICT a better long-term hold?
What is CLAR's gearing and how safe is it?
The Kopi Notes Verdict
CLAR and CICT are both first-tier S-REITs — blue-chip, CPF-investable, and backed by the CapitaLand ecosystem. But they serve different portfolio roles.
If you want a single CapitaLand REIT with stronger income growth momentum, global diversification, and data centre exposure, CLAR (A17U) is the pick for 2026. If you want the highest current yield with Singapore’s prime commercial real estate anchoring your income stream, CICT (C38U) earns its place.
For most long-term Singapore investors building a dividend portfolio, both deserve consideration — and a modest allocation to each gives you the best of both worlds: structural growth from CLAR’s industrial/DC platform, and retail/office income stability from CICT’s Singapore assets.
As always, do your own due diligence. This article is for informational purposes only and does not constitute financial advice. Past performance does not guarantee future results.
This article was researched with the help of AI. While we strive to keep all information accurate and up to date, there may be errors. If you notice any discrepancies, please contact us.