CapitaLand Ascendas REIT (A17U) — Quick Snapshot
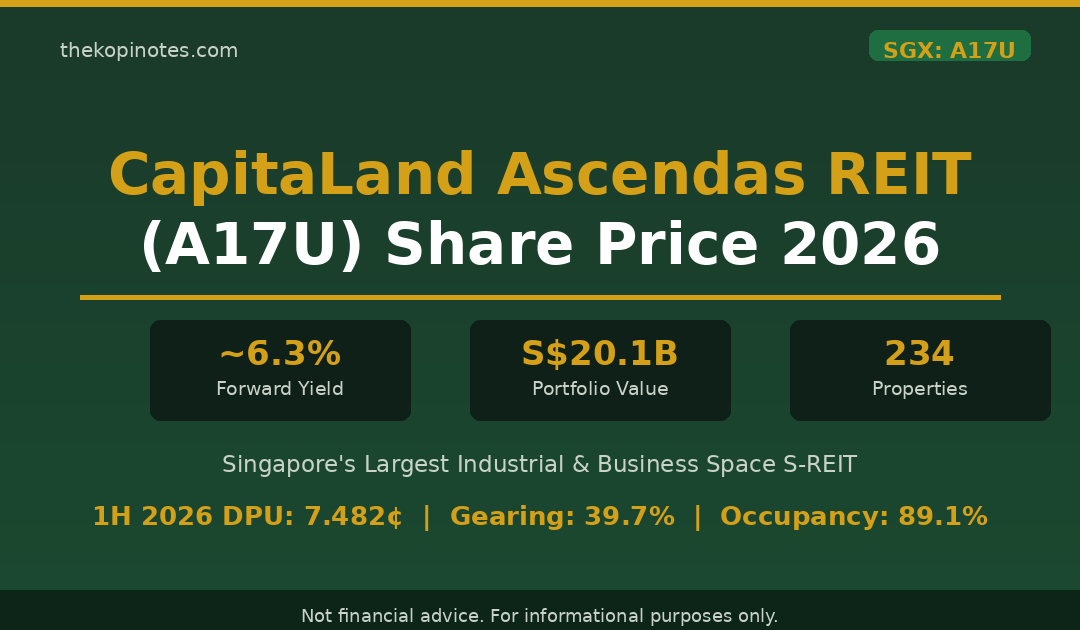
| Share Price (Sep 2026) | ~S$2.38 | SGX Ticker | A17U |
| Forward Yield (FY2025 DPU) | ~6.3% | FY2025 DPU | 15.005 Singapore cents |
| Portfolio Value | S$20.1 billion | Properties | 234 across 5 markets |
| Gearing (Jun 2026) | 39.7% | Portfolio Occupancy | 89.1% (90.3% ex new) |
| 1H 2026 Distributable Income | S$359.4M (+8.6% YoY) | 1H 2026 DPU | 7.482 cents |
Data as at September 2026. Not financial advice.
Table of Contents
1. What is CapitaLand Ascendas REIT?
2. A17U Share Price — Current Level and Historical Range
3. DPU History and Yield Analysis
4. 1H 2026 Financial Results
5. Valuation — NAV Discount Analysis
6. Portfolio Breakdown
7. Risks and Considerations
8. How to Invest in A17U
9. FAQ
1. What is CapitaLand Ascendas REIT?
CapitaLand Ascendas REIT (SGX: A17U) is Singapore’s largest industrial and business space real estate investment trust. Managed by CapitaLand Investment Limited, it holds a diversified portfolio valued at S$20.1 billion across 234 properties in five developed markets — Singapore, Australia, the United States, the United Kingdom, and continental Europe.
CLAR’s portfolio spans four key property segments: business space and life science properties, logistics and distribution centres, industrial and data centre facilities, and suburban retail-linked industrial parks. This diversification sets it apart from pure-play logistics or data centre REITs and positions it as a core holding for Singapore dividend investors seeking broad industrial exposure.
Singapore remains the largest geography by asset value, though international markets now account for over 40% of the portfolio — a deliberate strategy to access higher-growth logistics corridors in Australia and the United States.
For a comprehensive breakdown of portfolio sectors and the full investment thesis, see our CapitaLand Ascendas REIT Investor Guide 2026.
2. A17U Share Price — Current Level and Historical Range
As of early September 2026, CapitaLand Ascendas REIT’s share price trades at approximately S$2.38. This represents a significant discount to the REIT’s estimated book NAV of around S$2.90–S$3.00 per unit — implying a price-to-book ratio of roughly 0.79x, or a 20–25% NAV discount.
CLAR’s share price peaked above S$3.10 in 2022 before declining sharply as global interest rates rose. The Federal Reserve’s aggressive rate hike cycle from 2022 to 2024 increased borrowing costs across CLAR’s portfolio and compressed the yield spread that makes REITs attractive relative to bonds.
Since mid-2025, sentiment has shifted. As the Fed moved to cut rates and the Monetary Authority of Singapore (MAS) allowed the Singapore dollar to appreciate more gradually, CLAR’s share price has started recovering from its lows near S$2.20 in late 2024. The current level of S$2.38 reflects a market that is cautiously pricing in rate normalisation but has not yet fully re-rated the REIT toward NAV.
Share Price Context: What Drives A17U
Several factors influence CapitaLand Ascendas REIT’s share price on a day-to-day and quarterly basis.
Interest rate expectations are the dominant force. When US Treasury yields fall or when the market prices in more rate cuts, industrial REIT yields become more attractive relative to fixed income, drawing buyers. Conversely, a spike in yields pressures the share price.
Portfolio occupancy and rental reversions matter too. CLAR’s occupancy of 89.1% (90.3% excluding newly completed properties) as of mid-2026 shows broadly healthy tenant retention, though new-build drag is worth monitoring. Positive rental reversions — where renewed leases come in above expiring rents — signal demand strength in Singapore industrial space and in CLAR’s overseas markets.
Equity fundraising is a third factor. CLAR conducted S$900 million in equity fund raising in 1H 2026 to support acquisitions and reduce gearing. While this dilutes existing unitholders in the short term, the resulting gearing reduction from 42.0% to 39.7% provides meaningful balance sheet headroom for the S$1.8 billion acquisition pipeline management has identified.
3. DPU History and Yield Analysis
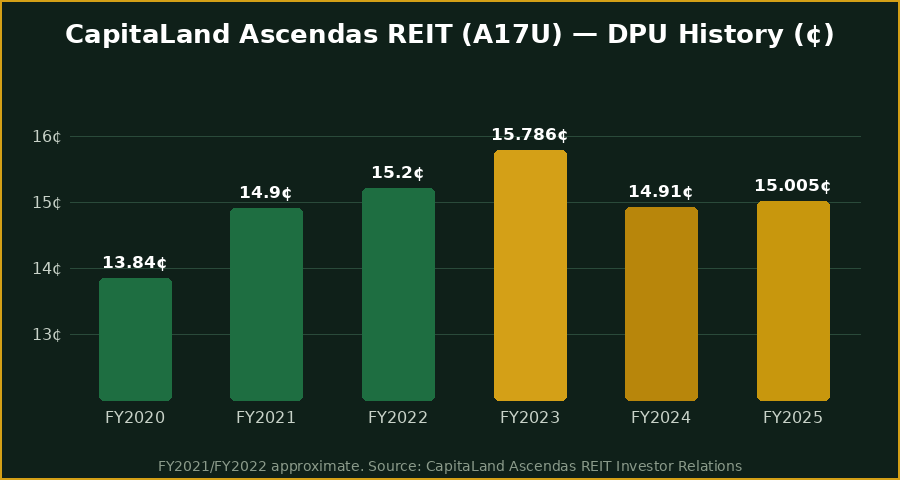
CapitaLand Ascendas REIT distributes semi-annually. The table below shows the distribution per unit (DPU) track record from FY2020 to FY2025, alongside the implied forward yield at the current share price of S$2.38.
| Financial Year | Annual DPU (cents) | Yield at S$2.38 | Notes |
|---|---|---|---|
| FY2020 | 13.84¢ | 5.8% | COVID impact, stable payout |
| FY2021 | ~14.90¢* | ~6.3% | Recovery; record acquisitions year |
| FY2022 | ~15.20¢* | ~6.4% | Rate hike cycle began |
| FY2023 | 15.786¢ | 6.6% | Peak DPU |
| FY2024 | 14.91¢ | 6.3% | Enlarged unit base; borrowing cost headwind |
| FY2025 | 15.005¢ | 6.3% | Stable; income recovery underway |
*FY2021 and FY2022 are approximate. Verify exact figures at CLAR Investor Relations. Not financial advice.
At the current share price of S$2.38 and FY2025 DPU of 15.005 cents, the forward yield stands at approximately 6.3%. With 1H 2026 DPU of 7.482 cents (annualised estimate ~14.96 cents), the FY2026 yield trajectory looks similar — slightly lower than FY2023’s peak but well above the 10-year Singapore government bond yield.
For a deeper look at the full distribution schedule and payout dates, see our CapitaLand Ascendas REIT Dividend History 2026 guide.
4. 1H 2026 Financial Results
CapitaLand Ascendas REIT reported solid 1H 2026 results in August 2026. Distributable income grew 8.6% year-on-year to S$359.4 million — the strongest half-year growth rate in several years, driven by acquisitions and organic rental growth.
Gross revenue rose 6.7% YoY to S$805.5 million while net property income (NPI) increased 6.2% YoY to S$556.1 million. The slightly lower NPI growth versus revenue reflects higher property operating expenses in some overseas markets.
Despite the strong income growth, 1H 2026 DPU came in at 7.482 cents — flat year-on-year. This reflects the enlarged unit base following the S$900 million equity fundraising conducted in 1H 2026 and a prior fundraising in 1H 2025. Management noted that the new units raised via equity fund raising will contribute a full year of income from their respective acquisition completions in 2H 2026.
Balance Sheet Improvement
Gearing declined from 42.0% at December 2025 to 39.7% at June 2026. This is a meaningful improvement for a REIT that had been running close to the MAS 45% leverage limit (up to 50% with a credit rating). The 39.7% gearing implies approximately S$4.3 billion of debt headroom before the MAS limit, giving CLAR significant capacity to execute its S$1.8 billion acquisition pipeline without further dilutive equity fundraising.
For details on how rate cuts could accelerate CLAR’s recovery, see our CapitaLand Ascendas REIT Rate Cut Analysis 2026.
5. Valuation — NAV Discount Analysis
As of September 2026, CapitaLand Ascendas REIT’s share price of ~S$2.38 represents an estimated 20–25% discount to its book net asset value (NAV). Book NAV is typically in the S$2.90–S$3.00 range based on the REIT’s reported asset valuations.
Historically, CLAR has traded at or near NAV during periods of low interest rates and strong industrial demand. The current discount reflects lingering risk-aversion from the rate hike cycle and uncertainty around the US economic outlook, which affects CLAR’s US industrial portfolio.
A P/NAV re-rating toward 0.90x (still a modest discount) would imply a share price of approximately S$2.61–S$2.70 — a potential total return of 20–30% from current levels when combined with the 6.3% annual yield. Investors approaching retirement or building a dividend portfolio may find this setup worth evaluating.
6. Portfolio Breakdown
CLAR’s S$20.1 billion portfolio spans five developed markets. Singapore remains the single largest geography (approximately 55% of asset value) with strong leasing demand from technology, pharmaceutical, and logistics tenants. Australian logistics assets (second largest weighting) benefit from structural e-commerce tailwinds. US industrial and life science properties offer higher rental growth potential but come with greater FX and economic cycle exposure.
Portfolio occupancy of 89.1% overall (90.3% excluding recently completed projects) reflects healthy underlying demand, with the modest drag from new completions expected to resolve as leasing progresses.
CLAR maintains a diversified tenant base with no single tenant exceeding 5% of gross revenue, reducing concentration risk. Major tenants include government agencies, multinational corporations, and data centre operators.
7. Risks and Considerations
Before investing in CapitaLand Ascendas REIT, consider the following risk factors.
Interest rate sensitivity is the most significant near-term risk. If the Fed pauses or reverses course on rate cuts, borrowing costs could remain elevated, compressing CLAR’s interest coverage ratio and limiting DPU growth. At 39.7% gearing, CLAR has room to absorb higher rates, but sustained high rates would slow the share price recovery.
FX exposure is a structural risk. With over 40% of assets overseas (denominated in AUD, USD, GBP, and EUR), CLAR’s SGD-reported DPU is sensitive to currency movements. A strong Singapore dollar depresses overseas income when translated back. Management partially hedges this exposure but cannot eliminate it.
Dilution risk remains elevated. CLAR has conducted multiple equity fundraisings in 2024–2026. While each fundraising is paired with earnings-accretive acquisitions, the enlarged unit base creates a DPU dilution headwind in the year of fundraising before the acquired assets contribute a full year of income.
Structural obsolescence of industrial assets is a longer-term concern — particularly older flatted factory and business park properties in Singapore’s mature industrial belt. CLAR actively manages this through asset enhancement initiatives (AEIs) and selective divestment.
Compare CLAR with peers like Keppel DC REIT and explore broader principles in our dividend investing guide for Singapore investors.
8. How to Invest in A17U in Singapore
CapitaLand Ascendas REIT (A17U) is listed on the Singapore Exchange and accessible through all major Singapore brokerage platforms. For investors building a passive income or dividend portfolio, robo-advisors and ETF-linked platforms also offer REIT exposure with lower transaction friction.
Referral codes may confer benefits to both parties. Not financial advice. All investments carry risk.
9. Frequently Asked Questions
What is the current CapitaLand Ascendas REIT share price?
What is the dividend yield for CapitaLand Ascendas REIT in 2026?
Why is CapitaLand Ascendas REIT trading at a discount to NAV?
How many properties does CapitaLand Ascendas REIT own?
How do I buy CapitaLand Ascendas REIT shares in Singapore?
What is the gearing ratio for CapitaLand Ascendas REIT?
Is CapitaLand Ascendas REIT eligible for CPF investment?
This article was researched with the help of AI. While we strive to keep all information accurate and up to date, there may be errors. If you notice any discrepancies, please contact us.