Mapletree Pan Asia Commercial Trust (MPACT) Review 2026: Buy, Hold or Sell?
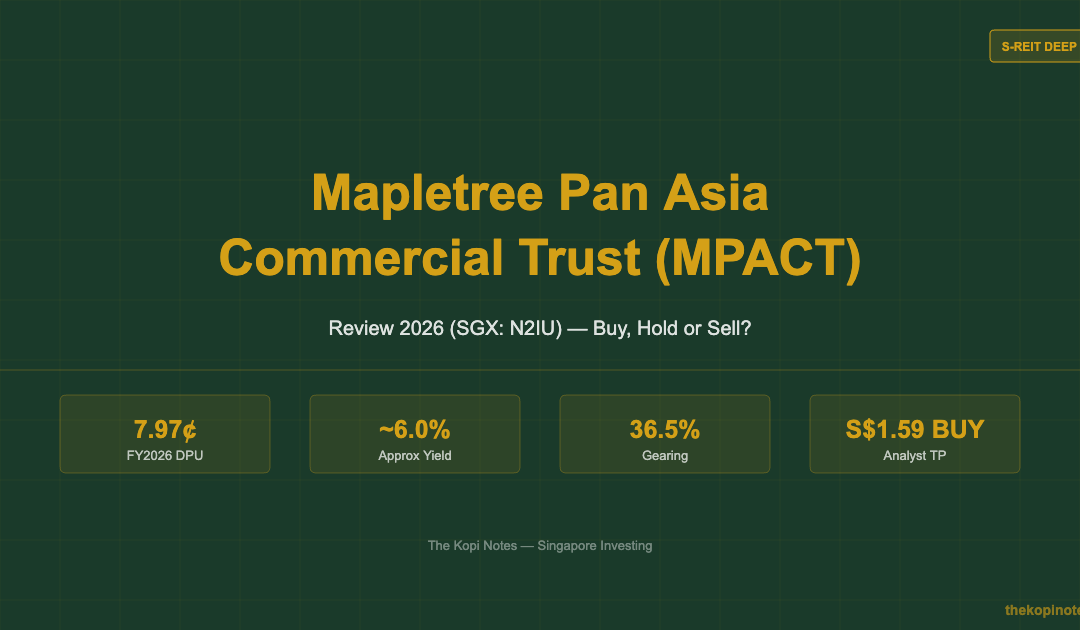
SGX: N2IU — FY2026 DPU 7.97¢ · ~6.0% Yield · P/NAV 0.77× · Analyst Consensus: BUY
Mapletree Pan Asia Commercial Trust (MPACT, SGX: N2IU) is Singapore’s largest diversified commercial REIT, owning 15 properties across five Asian gateway cities worth S$15.2 billion. In FY2025/26 it paid a full-year DPU of 7.97 Singapore cents — yielding roughly 6.0% at the current share price of S$1.33. The trust trades at a 23% discount to its NAV of S$1.73, which is unusually low for a Singapore-anchored blue-chip REIT. Most analysts rate it a BUY with a consensus target of S$1.59.
Not financial advice. All figures are for educational reference only. Data as at June 2026 unless noted.
- FY2026 DPU of 7.97¢ was slightly down due to a one-off tax charge — underlying DPU was actually 8.11¢, up 1.1% YoY.
- VivoCity is firing on all cylinders: NPI +7.6%, rental reversion +14.1%, shopper traffic hit 45.4 million.
- MPACT trades at a 23% discount to NAV (S$1.73) — rare for a blue-chip S-REIT — with analyst targets pointing to ~20% upside.
📋 Table of Contents
Jump to Section
- What Is Mapletree Pan Asia Commercial Trust?
- FY2026 Full-Year Results Breakdown
- VivoCity: The Crown Jewel
- Overseas Portfolio: Challenges and Opportunities
- Balance Sheet and Gearing
- DPU History and Yield Analysis
- Peer Comparison Table
- Analyst Price Targets and Verdict
- How to Buy MPACT in Singapore
- Buy, Hold or Sell? Our Verdict
- Frequently Asked Questions
What Is Mapletree Pan Asia Commercial Trust?
Mapletree Pan Asia Commercial Trust (MPACT) was formed in July 2022 when Mapletree Commercial Trust (MCT) merged with Mapletree North Asia Commercial Trust (MNACT). The result is Singapore’s largest diversified commercial REIT listed on the SGX.
MPACT owns 15 properties spread across five gateway cities in Asia: Singapore, Hong Kong, Japan, South Korea and China. Its sponsor is Mapletree Investments Pte Ltd, a wholly owned subsidiary of Temasek Holdings — giving it strong backing and a pipeline of potential acquisition targets.
| Key Metric | FY2025/26 Value |
|---|---|
| Total AUM | S$15.2 billion |
| Number of Properties | 15 across 5 markets |
| Singapore Weighting | 61% of AUM, 66% of NPI |
| Portfolio Occupancy | 89.4% committed |
| WALE (overall) | 2.4 years |
| Sponsor | Mapletree Investments (Temasek-backed) |
Source: MPACT FY25/26 Full-Year Results, April 2026
Key properties in the portfolio include VivoCity (Singapore’s largest suburban mall), Mapletree Business City (MBC) in Singapore, Festival Walk in Hong Kong, and several office and commercial assets in Japan and China.
FY2026 Full-Year Results Breakdown
MPACT reported its FY2025/26 full-year results on 28 April 2026. The headline DPU of 7.97 Singapore cents was slightly below the prior year’s 8.02 cents — a decline of just 0.6%. But here’s the key detail: this decline was entirely due to a one-off S$8.3 million tax charge related to the divestment of the Festival Walk office tower.
Strip that out, and the underlying DPU was 8.11 cents — an increase of 1.1% year-on-year. That’s a meaningful distinction for income investors. The core business actually grew.
| Financial Metric | FY24/25 | FY25/26 | Change |
|---|---|---|---|
| Full-Year DPU | 8.02¢ | 7.97¢ | -0.6% |
| Underlying DPU (ex one-off) | 8.02¢ | 8.11¢ | +1.1% |
| SG Gross Revenue (comparable) | – | +2.3% YoY | Growth |
| SG NPI (comparable) | – | +4.1% YoY | Growth |
| Aggregate Leverage | 37.7% | 36.5% | Improved |
| Weighted Avg Cost of Debt | 3.51% | 3.16% | -35 bps |
| Interest Coverage Ratio (ICR) | – | 3.2× | Healthy |
| NAV Per Unit | S$1.78 | S$1.73 | FX impact |
Source: MPACT FY25/26 Full-Year Results Presentation, April 2026
The 4Q FY2026 DPU of 1.90 cents was paid on 17 June 2026. MPACT pays quarterly distributions, which is attractive for income investors who want regular cash flow from their S-REIT portfolio.
VivoCity: The Crown Jewel
If you own MPACT, you really own VivoCity first. It’s the dominant asset in the trust and it had an outstanding FY2026.
VivoCity’s full-year NPI grew 7.6%, driven by the completion of its Basement 2 Asset Enhancement Initiative (AEI). This S$20 million-plus project added 14,000 square feet of new retail space and is generating a return on investment of over 10%. You don’t often see AEIs delivering those kinds of returns in Singapore retail.
| VivoCity Metric | FY2025/26 Result |
|---|---|
| NPI Growth | +7.6% YoY |
| Rental Reversion | +14.1% (full year) |
| Shopper Traffic | 45.4 million (+3.6% YoY) |
| Tenant Sales | S$1.1 billion (+3.7% YoY) |
| Committed Occupancy | ~99.7% (near-full) |
| B2 AEI ROI | >10% on cost |
Source: MPACT FY25/26 Full-Year Results, April 2026
A 14.1% rental reversion means that when tenants renew their leases, they’re paying 14.1% more than their previous rent. That’s a very strong signal of tenant demand and pricing power at VivoCity. The mall benefits from its location beside HarbourFront MRT station and the gateway to Sentosa — foot traffic here is structural, not cyclical.
Mapletree Business City (MBC) also delivered. Key top-10 tenant renewals were secured, including one in 4Q FY2026, which extends income visibility into FY2027 and beyond.
Overseas Portfolio: Challenges and Opportunities
The overseas portfolio is a mixed picture — and that’s the main risk you take on with MPACT compared to a Singapore-pure REIT like FCT.
MPACT completed three divestments in FY2026: the Festival Walk Tower (Hong Kong office component), TS Ikebukuro Building (Japan) and ABAS Shin-Yokohama Building (Japan). The proceeds reduced debt and strengthened the balance sheet — good capital allocation. But the absence of those contributions reduced income.
Festival Walk (Hong Kong): The retail mall maintained 100% committed occupancy. Full-year tenant sales dipped 0.8%, but the final quarter rebounded +6.0% on luxury spending. An 18,800 sq ft reconfiguration into an F&B and lifestyle cluster is underway, projecting a nearly 50% ROI on completion in 2Q FY26/27.
Japan portfolio: Fujitsu’s lease expiry at the Makuhari building created a vacancy headwind. The market is absorbing it gradually. Japan’s broader commercial real estate market is benefiting from the return of business tourism and corporate activity post-pandemic.
China: Softer market rents and cautious business sentiment weighed on the China assets. This reflects the broader economic environment in Greater China, where recovery has been uneven. MPACT’s China exposure is relatively modest as a proportion of NPI.
The FX factor: A stronger Singapore dollar caused a S$301.1 million negative FX impact on overseas asset valuations. Excluding FX, the portfolio was almost flat (-0.2%). This is accounting noise, not operational failure — but it does pressure NAV in the near term.
Balance Sheet and Gearing
MPACT’s balance sheet improved significantly in FY2026. The three divestments channelled proceeds directly into debt reduction, and the results are clear in every metric.
| Balance Sheet Metric | FY24/25 | FY25/26 |
|---|---|---|
| Aggregate Leverage | 37.7% | 36.5% |
| Weighted Avg Cost of Debt | 3.51% | 3.16% |
| Interest Coverage Ratio | – | 3.2× |
| Available Liquidity | – | S$0.9 billion |
| Fixed/Hedged Debt | – | 75.1% |
| Max Debt Maturing Any 1 Year | – | <23% |
Source: MPACT FY25/26 Full-Year Results, April 2026
A 36.5% gearing is comfortable — well below MAS’s 50% regulatory limit and within the conservative range. The ICR of 3.2× means MPACT earns S$3.20 of net property income for every S$1 of interest it pays. That’s a healthy buffer.
With 75.1% of debt fixed or hedged and no single year responsible for more than 23% of refinancing, MPACT is well-insulated from interest rate and refinancing risk. For investors looking for yield stability rather than growth fireworks, this balance sheet picture is reassuring. Compare this to the S-REIT yield vs bond spread to see how MPACT’s ~6% yield stacks up against current interest rates.
DPU History and Yield Analysis
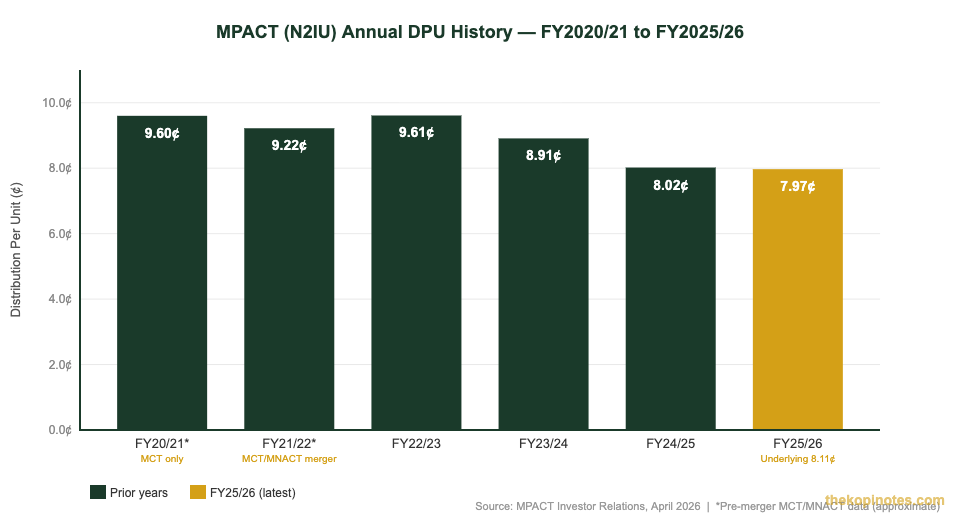
The Distribution Per Unit (DPU) — basically how much cash each MPACT unit pays you annually — has trended down since the post-merger high in FY2022/23. This reflects the headwinds from overseas markets and the impact of rising interest costs in prior years.
However, FY2026 marks a potential inflection point. With debt costs now falling (3.51% → 3.16%), divestments completed, and VivoCity delivering strong reversions, the underlying income trend has turned positive.
| Financial Year | Annual DPU (¢) | YoY Change | Approx Yield* |
|---|---|---|---|
| FY2022/23 | 9.61¢ | – | ~5.5% |
| FY2023/24 | 8.91¢ | -7.3% | ~5.8% |
| FY2024/25 | 8.02¢ | -10.0% | ~6.0% |
| FY2025/26 (latest) | 7.97¢ | -0.6% | ~6.0% |
| FY25/26 underlying (ex one-off) | 8.11¢ | +1.1% | ~6.1% |
*Yield calculated at approximate share price at time of distribution. Not a forecast of future distributions.
One thing to note: MPACT’s FY2026 yield of ~6.0% at S$1.33 compares very favourably to Singapore Savings Bonds (2.11% for SBJUL26) and T-bills (1.44% as of June 2026). For income-focused investors, the ~4.6 percentage point premium over risk-free rates compensates for the real estate and currency risk involved. You can run the numbers yourself using the S-REIT total return calculator.
Peer Comparison Table
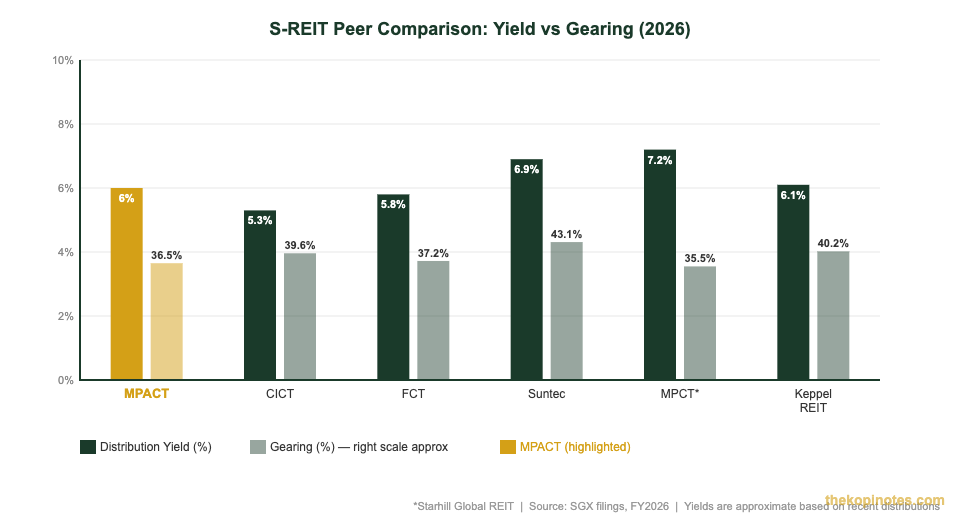
How does MPACT stack up against its closest Singapore commercial REIT peers? Here’s a snapshot as at June 2026:
| REIT | SGX Code | Approx Yield | Gearing | P/NAV | Focus |
|---|---|---|---|---|---|
| MPACT | N2IU | ~6.0% | 36.5% | 0.77× | Diversified Asia |
| CICT | C38U | ~5.3% | 39.6% | ~1.05× | SG commercial |
| Frasers Centrepoint Trust | J69U | ~5.8% | 37.2% | ~0.95× | SG suburban retail |
| Suntec REIT | T82U | ~6.9% | 43.1% | ~0.52× | SG/AU/UK office |
| Starhill Global REIT | P40U | ~6.8% | 35.5% | ~0.72× | Retail/office Asia |
| Keppel REIT | K71U | ~6.1% | 40.2% | ~0.85× | SG/AU/US office |
Source: SGX filings, analyst reports, June 2026. Yields and P/NAV are approximate and based on recent distributions and reported NAV. Not a recommendation to buy or sell.
MPACT stands out on P/NAV at 0.77× — meaning you’re buying S$1.73 worth of assets for S$1.33. That’s a significant discount. Among blue-chip Singapore-anchored REITs, that kind of discount is unusual and typically signals either genuine risk (in MPACT’s case: overseas headwinds + FX) or undervaluation. Analysts largely believe it’s the latter.
Analyst Price Targets and Consensus
Among the five analysts covering MPACT, four rate it a BUY and one rates it a HOLD. The average 12-month price target is S$1.59, with a range of S$1.45 to S$1.75. At the current price of ~S$1.33, that implies around 20% upside to the consensus target.
| Broker / Metric | Rating | Target Price |
|---|---|---|
| Consensus (5 analysts) | BUY (4/5) | S$1.59 avg |
| Highest target | BUY | S$1.75 |
| Lowest target | HOLD | S$1.45 |
| Current share price (Jun 2026) | – | ~S$1.33 |
| Upside to consensus TP | – | ~+19.5% |
| P/NAV at current price | – | 0.77× (discount) |
Source: MarketScreener / analyst consensus, June 2026. Price targets are not a guarantee of returns.
The bullish case rests on three pillars: (1) VivoCity’s structural strength as Singapore’s largest suburban mall; (2) the P/NAV discount closing as overseas headwinds fade; and (3) falling debt costs (3.16%) boosting distributable income as more debt matures and gets refinanced at lower rates.
The bear case: sustained FX weakness in JPY, HKD and CNY compresses NAV further; China macro stays soft; and Festival Walk’s refurbishment underwhelms. These are real risks — which is why the trust trades at a discount rather than a premium to NAV.
For a broader view of S-REIT investing, see our guide on passive income strategies in Singapore and how REITs fit into a dividend portfolio.
How to Buy MPACT in Singapore (CPF, SRS, Cash)
MPACT (N2IU) is listed on the SGX and can be bought through any Singapore brokerage. It is eligible for both CPF Investment Scheme (CPFIS-OA) and Supplementary Retirement Scheme (SRS) accounts, making it tax-efficient for long-term investors.
| Method | Platform | Notes |
|---|---|---|
| Cash (CDP) | FSMOne (P0544985) | 0.08% commission, CDP ownership |
| Cash (custodian) | Syfe (SRPRFFFCD) | Fractional shares, portfolio tools |
| CPF OA (CPFIS) | Endowus (2V343) | CPF investing with fee rebates |
| SRS | Endowus (2V343) | SRS investing, tax deferred growth |
| Cash (global) | IBKR (jianxiong368) | Low commissions, no CDP |
Using SRS to buy MPACT is particularly attractive — your SRS contributions receive a tax deduction at your marginal rate, and the dividends compound tax-deferred until withdrawal. At a 6% yield, MPACT inside an SRS account effectively earns more than 6% in after-tax terms for higher-income investors. The SRS tax savings calculator can show you exactly how much you’d save.
For CPF-OA investors: MPACT is CPFIS-OA eligible. Your CPF-OA earns 2.5% by default. If you believe MPACT can deliver 6%+ total return (yield + capital appreciation), there’s a case for using CPF-OA. But remember: CPF-OA is guaranteed, MPACT is not. Use the retirement calculator to model both scenarios.
Buy, Hold or Sell? Our Verdict
MPACT is a Temasek-backed commercial REIT with Singapore’s most visited mall, a Temasek balance sheet backstop, and a 6% yield — trading at a 23% discount to its book value. That’s not a combination you see often in the S-REIT market.
| Investor Profile | Verdict | Reason |
|---|---|---|
| Income investor, long horizon | BUY | 6% yield, 95% SGD-hedged, quarterly distributions |
| Value investor | BUY | P/NAV 0.77× — buying S$1.73 assets at S$1.33 |
| Growth investor | HOLD | DPU has declined 3 consecutive years; growth depends on overseas recovery |
| Conservative / CPF-OA investor | HOLD | Overseas risk and FX volatility; CPF-OA 2.5% is risk-free — compare carefully |
| Existing holder | HOLD / ADD | Balance sheet has improved, underlying DPU is recovering — patience rewarded |
Our view: MPACT is not a high-growth REIT. It’s an income and value play. The structural argument for owning it is: VivoCity is Singapore’s largest suburban mall and there’s no realistic competitor to that position in HarbourFront. As the overseas drag fades — through divestments, falling debt costs, and gradual Festival Walk recovery — the gap between the S$1.33 price and the S$1.73 NAV should narrow.
The risk is that it doesn’t narrow as fast as you’d like. Greater China and Japan are structural headwinds, not short-term blips. If you can accept that uncertainty for a 6% yield and Temasek backing, MPACT is a reasonable position in a diversified S-REIT portfolio.
Always do your own research before investing. This is not financial advice.
Frequently Asked Questions
What is the DPU of Mapletree Pan Asia Commercial Trust in 2026?
What is the current yield of MPACT (N2IU)?
Is MPACT a buy or sell in 2026?
What are the main properties in MPACT's portfolio?
Can I buy MPACT using CPF or SRS?
What is MPACT's gearing ratio in 2026?
What happened with MPACT's divestments in FY2026?
Why is MPACT trading below its NAV?
How does VivoCity contribute to MPACT?
What is MPACT's distribution payment schedule?
This article was researched with the help of AI. While we strive to keep all information accurate and up to date, there may be errors. If you notice any discrepancies, please contact us.