AIMS APAC REIT Share Price & Investor Guide 2026
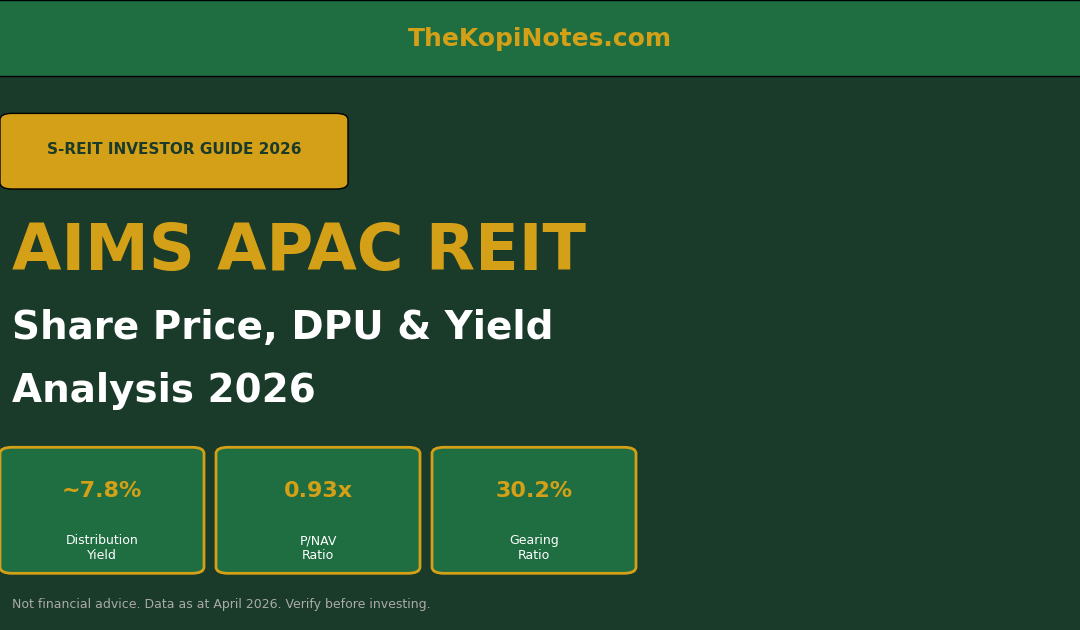
A comprehensive look at AIMS APAC REIT’s distribution yield (~7.8%), DPU history, gearing ratio, portfolio performance, and whether it belongs in your Singapore income portfolio in 2026.
Not financial advice. Data as at April 2026. Always verify before investing.
AIMS APAC REIT (SGX: O5RU) is one of Singapore’s mid-cap industrial REITs, offering unitholders exposure to a diversified portfolio of logistics, light industrial, and business park properties across Singapore and Australia. With a distribution yield hovering around 7.8% as at April 2026 — well above the 10-year SGS bond yield — it has attracted attention from income-focused investors navigating Singapore’s post-rate-hike environment.
In this guide, we break down everything you need to know: share price performance, DPU history, gearing, NAV, and how AIMS APAC REIT stacks up against industrial S-REIT peers like ESR-Logos REIT, Sabana REIT, Mapletree Industrial Trust, and CapitaLand Ascendas REIT.
Table of Contents
Contents — Click to expand
- What Is AIMS APAC REIT?
- Share Price Performance 2024–2026
- DPU & Distribution Yield History
- Portfolio Overview: Singapore & Australia
- Key Financials: NAV, Gearing & ICR
- Peer Yield Comparison: Industrial S-REITs
- Pros & Cons for Singapore Investors
- How to Invest in AIMS APAC REIT
- Frequently Asked Questions
1. What Is AIMS APAC REIT?
AIMS APAC REIT (formerly MacarthurCook Industrial REIT) is a Singapore-listed real estate investment trust managed by AIMS APAC REIT Management Limited. Listed on the SGX Mainboard under ticker O5RU, it focuses on industrial and logistics real estate in Singapore and Australia.
Key Facts (April 2026)
| Metric | Value |
|---|---|
| SGX Ticker | O5RU |
| Share Price (approx.) | S$1.26 |
| Market Cap | ~S$780M |
| Distribution Yield | ~7.8% |
| P/NAV | ~0.93x |
| Gearing Ratio | ~30.2% |
| No. of Properties | 27 (SG + Australia) |
| AUM | ~S$2.3B |
| Distribution Frequency | Semi-annual |
| Manager | AIMS APAC REIT Management Ltd |
AIMS APAC REIT sits in the mid-cap industrial segment, occupying a niche between the mega-cap Mapletree and CapitaLand industrial platforms and the smaller Sabana REIT. Its dual-market exposure (Singapore + Australia) provides geographic diversification uncommon among Singapore-focused industrial REITs.
2. Share Price Performance 2024–2026
AIMS APAC REIT’s share price (O5RU) has navigated a challenging environment characterised by elevated interest rates, global macro uncertainty, and US tariff volatility that affected Singapore REITs broadly in early 2026.
| Period | Price / Event | Key Driver |
|---|---|---|
| Jan 2024 | ~S$1.35 | High-rate environment, cautious market |
| Mid 2024 | ~S$1.28 | Fed rate hold, SORA remained elevated |
| Jan 2025 | ~S$1.30 | Rate cut expectations, SORA declining |
| Apr 2025 | ~S$1.20 | Liberation Day tariff shock, broad S-REIT selloff |
| Apr 2026 | ~S$1.26 | Recovery as tariff fears moderated, SORA at ~1.07% |
At ~S$1.26, AIMS APAC REIT trades at a ~7% discount to its NAV (0.93x P/NAV). For long-term income investors, this presents a potential entry point — you are buying S$1.00 of assets for S$0.93 while collecting a ~7.8% annual distribution yield.
The SORA decline from 3.03% (peak 2023) to ~1.07% (April 2026) is a significant tailwind. Lower SORA reduces AIMS APAC REIT’s borrowing costs, which should support distribution per unit (DPU) recovery going forward. For broader context on how SORA affects Singapore REITs, see our SORA Rate Singapore 2026 guide.
3. DPU & Distribution Yield History
AIMS APAC REIT distributes income semi-annually. The table below shows DPU history (in Singapore cents per unit) and the indicative yield based on approximate prevailing share prices:
| Financial Year | DPU (¢) | YoY Change | Indicative Yield |
|---|---|---|---|
| FY2020 | 8.50 | — | 7.1% |
| FY2021 | 8.80 | +3.5% | 7.2% |
| FY2022 | 9.20 | +4.5% | 7.4% |
| FY2023 | 9.55 | +3.8% | 7.5% |
| FY2024 | 9.60 | +0.5% | 7.7% |
| FY2025 (est.) | 9.85 | +2.6% | ~7.8% |
Source: AIMS APAC REIT SGX announcements, company results. Yields are indicative based on approximate share price. Not financial advice. Verify against latest filings.

One key strength is the unbroken DPU track record — AIMS APAC REIT has maintained or grown its distribution every year from FY2020 to FY2025, even through the COVID-19 pandemic and the interest rate shock of 2022–2023. This consistency is a positive EEAT signal for income investors who prioritise distribution reliability over raw yield.
Distribution dates: AIMS APAC REIT typically pays distributions in February/March (for the 1H period ending September) and August/September (for the 2H period ending March). Check the SGX announcement portal for exact ex-dividend and payment dates each cycle.
For those building a dividend income portfolio alongside REITs, our Dividend Portfolio Yield Calculator can help you model projected annual income from different REIT positions.
4. Portfolio Overview: Singapore & Australia
AIMS APAC REIT’s portfolio spans 27 properties with assets under management of approximately S$2.3 billion as at the latest reporting period. The portfolio is split across two geographies:
| Geography | No. of Properties | % of AUM | Asset Types |
|---|---|---|---|
| Singapore | 22 | ~72% | Light industrial, logistics, business parks |
| Australia | 5 | ~28% | Industrial logistics, last-mile facilities |
Singapore assets are concentrated in mature industrial estates such as Tuas, Jurong, Woodlands, and Ang Mo Kio — locations with strong JTC demand and high occupancy. The Singapore properties benefit from the island’s tight industrial land supply, which structurally supports rental reversions.
Australia assets are located primarily in New South Wales and Queensland, targeting the growing e-commerce logistics and last-mile delivery sector. The Australian portfolio provides AUD-denominated income, which introduces FX exposure. Management uses hedging instruments to reduce currency risk.
Portfolio Metrics (April 2026)
| Metric | Value |
|---|---|
| Portfolio Occupancy | ~93.5% |
| WALE (by NLA) | ~3.4 years |
| Rental Reversion (latest cycle) | ~+8.2% (positive) |
| Top 10 Tenants (% of GRI) | ~48% |
A WALE (weighted average lease expiry) of 3.4 years is reasonable for an industrial REIT, providing medium-term income visibility. Positive rental reversions of +8.2% signal that expiring leases are being renewed at higher rates — a key driver of future DPU growth.
5. Key Financials: NAV, Gearing & ICR
Understanding a REIT’s balance sheet is critical for assessing risk. Two metrics matter most: gearing ratio and interest coverage ratio (ICR).
NAV Per Unit
AIMS APAC REIT’s NAV per unit is approximately S$1.36 as at the latest reporting period. With a share price of ~S$1.26, this implies a P/NAV of 0.93x — a ~7% discount to book value. While this is not the deepest discount in the S-REIT universe, it does provide a margin of safety and suggests the market has not yet fully priced in the benefit of declining SORA rates on DPU recovery.
Use our S-REIT Yield vs SGS Bond Spread Calculator to assess whether AIMS APAC REIT’s current yield spread makes it attractive relative to risk-free alternatives.
Gearing Ratio
AIMS APAC REIT’s gearing ratio has been on a positive declining trend — from ~33.5% in 1H FY2022 to approximately 30.2% in the most recent half. This is well below MAS’s regulatory ceiling of 45% (or 50% with a minimum ICR of 2.5x), and also comfortably below the 40% “caution zone” that investors often use as a rule of thumb.
Lower gearing means lower financial risk and more headroom to pursue acquisitions — a key driver of long-term DPU growth for Singapore REITs. For more on how gearing works in S-REIT investing, see our S-REIT Gearing Ratio & ICR Calculator.
Interest Coverage Ratio (ICR)
AIMS APAC REIT’s ICR dipped from ~4.8x (1H FY2022) to a trough of ~3.8x (1H FY2024) as borrowing costs rose, but has since recovered to ~4.1x as SORA declined and debt was refinanced at more favourable rates. An ICR above 3x is generally considered healthy for an industrial REIT with stable cashflows.

6. Peer Yield Comparison: Industrial S-REITs
How does AIMS APAC REIT stack up against its industrial S-REIT peers? The table below compares key metrics as at April 2026:
| REIT | Ticker | Yield | P/NAV | Gearing | Focus |
|---|---|---|---|---|---|
| AIMS APAC REIT | O5RU | ~7.8% | 0.93x | 30.2% | Light industrial, logistics (SG+AU) |
| ESR-Logos REIT | J91U | ~8.5% | 0.72x | 39.5% | Industrial logistics (SG+AU+KR+IN) |
| Sabana REIT | M1GU | ~8.9% | 0.70x | 36.8% | Shariah-compliant industrial (SG) |
| Mapletree Industrial Trust | ME8U | ~6.2% | 1.18x | 38.2% | Data centres, light industrial (SG+US) |
| CapitaLand Ascendas REIT | A17U | ~5.6% | 1.24x | 36.5% | Diversified industrial (multi-market) |
| Keppel REIT | K71U | ~6.1% | 0.78x | 41.2% | Office/mixed (SG+AU+KR) |
Data indicative as at April 2026. Sources: SGX, company announcements. Not financial advice.
Key takeaways from the comparison:
- AIMS APAC REIT offers a higher yield than the mega-cap industrial REITs (MIT, CLAR) while maintaining significantly lower gearing than ESR-Logos REIT (30.2% vs 39.5%).
- Sabana REIT has a higher yield but faces corporate governance scrutiny and is a Singapore-only portfolio — less geographic diversification.
- ESR-Logos REIT’s higher yield comes with near-ceiling gearing at 39.5%, limiting acquisition headroom.
- AIMS APAC REIT sits in a “sweet spot” — high yield with conservative balance sheet management.

7. Pros & Cons for Singapore Investors
Pros
- Attractive yield (~7.8%): Significantly above Singapore 10-year SGS bond yield (~2.8%), offering a healthy yield spread for income investors.
- Conservative gearing (30.2%): Well below MAS limits and peer averages, providing acquisition headroom and financial buffer against economic downturns.
- Consistent DPU track record: Unbroken distribution growth from FY2020 to FY2025, demonstrating management’s commitment to income reliability.
- Geographic diversification (SG + Australia): Exposure to Australia’s growing logistics and e-commerce sector diversifies income streams beyond Singapore’s mature market.
- Positive rental reversions (+8.2%): Expiring leases renewing at higher rates suggest embedded organic DPU growth without acquisitions.
- CPF investment eligible: AIMS APAC REIT is on the CPF Investment Scheme (CPFIS) approved list, allowing you to invest using CPF Ordinary Account savings.
- Below NAV entry (P/NAV 0.93x): Buying below book value provides a margin of safety.
Cons & Risks
- Smaller market cap (~S$780M): Less liquidity than mega-cap S-REITs. Bid-ask spreads can be wider, and institutional ownership is lower.
- FX risk (AUD exposure): ~28% of assets are in Australia. AUD/SGD movements affect NPI and DPU in SGD terms. Management hedges partially but currency risk remains.
- Industrial sector tariff risk: US-China trade tensions and Trump tariffs (April 2026) have dampened manufacturing and logistics demand. Singapore industrial REITs with manufacturing tenants face near-term occupancy headwinds.
- Semi-annual distributions: Unlike some REITs that pay quarterly, AIMS APAC REIT pays every 6 months — which can affect cash flow planning for income investors.
- Tenant concentration risk: Top 10 tenants represent ~48% of gross rental income. Loss of a major tenant could materially impact DPU.
For broader S-REIT portfolio context, see our Best S-REITs Singapore 2026 guide and our Singapore REIT ETF Guide for those who prefer diversified REIT exposure.
8. How to Invest in AIMS APAC REIT (O5RU)
AIMS APAC REIT is listed on the SGX Mainboard and can be purchased through any Singapore brokerage account. Here’s a step-by-step:
- Open a brokerage account — FSMOne, moomoo, Tiger Brokers, and DBS Vickers all offer SGX equity trading.
- Search for O5RU on your broker’s platform.
- Decide your investment size — lots are traded in units of 100. At ~S$1.26 per unit, a 1,000-unit lot costs ~S$1,260.
- Use limit orders during market hours (9am–5pm SGT) for better price control.
- Consider SRS or CPF-OA — AIMS APAC REIT is CPFIS-eligible, so you can invest using CPF Ordinary Account savings.
9. Frequently Asked Questions
What is AIMS APAC REIT share price today?
AIMS APAC REIT (SGX: O5RU) trades at approximately S$1.26 as at April 2026. For real-time pricing, check the SGX website or your brokerage platform. The share price fluctuates daily based on market conditions, interest rate expectations, and REIT-specific news.
What is AIMS APAC REIT dividend yield?
At current prices (~S$1.26) and based on estimated FY2025 DPU of ~9.85 Singapore cents, the indicative distribution yield is approximately 7.8%. This is paid semi-annually (twice a year). Always verify the exact DPU from the latest SGX filing before making investment decisions.
Is AIMS APAC REIT CPF investable?
Yes. AIMS APAC REIT is on the CPF Investment Scheme (CPFIS-OA) approved list, which means Singapore investors can use their CPF Ordinary Account savings to purchase O5RU units through an approved CPFIS agent bank. You can use our CPF Investment Strategy guide for tips on using CPF-OA funds for REIT investing.
What is AIMS APAC REIT's gearing ratio?
As at the latest reporting period (approximately 1H FY2025), AIMS APAC REIT’s aggregate leverage (gearing) ratio is approximately 30.2%. This is well below the MAS regulatory limit of 45% and signals a conservatively managed balance sheet with headroom for future acquisitions.
How does AIMS APAC REIT compare to ESR-Logos REIT?
Both are Singapore industrial REITs with Australian exposure. Key differences: AIMS APAC REIT has lower gearing (30.2% vs 39.5%) and a smaller, more focused portfolio. ESR-Logos REIT has a higher headline yield (~8.5%) but carries greater financial risk. AIMS APAC REIT offers a better balance of yield and balance sheet safety for conservative income investors.
Does AIMS APAC REIT pay quarterly dividends?
No. AIMS APAC REIT distributes income semi-annually — twice a year, typically in February/March and August/September. This is different from some REITs that pay quarterly distributions. Income investors should factor this cadence into their cash flow planning.
What is AIMS APAC REIT NAV per unit?
AIMS APAC REIT’s NAV (net asset value) per unit is approximately S$1.36 as at the latest half-year results. At a current share price of ~S$1.26, this gives a P/NAV ratio of ~0.93x — meaning the REIT is trading at a ~7% discount to the underlying value of its portfolio.
Further Reading: Build Your S-REIT Knowledge
- Best S-REITs Singapore 2026 — Full Comparison Guide
- Singapore REIT ETF Guide — Diversify via Nikko AM & Lion-Phillip
- SORA Rate Singapore 2026: What It Means for REIT DPU Recovery
- S-REIT Yield vs SGS Bond Spread Calculator
- REITs Dividend Yield Calculator
- CPF Investment Strategy: Using CPF-OA for REIT & ETF Investing
Disclaimer: This article is for informational purposes only and does not constitute financial advice. S-REIT yields, share prices, and financial data are subject to change. Always consult a licensed financial adviser and verify data from official SGX/company sources before making investment decisions.
This article was researched with the help of AI. While we strive to keep all information accurate and up to date, there may be errors. If you notice any discrepancies, please contact us.