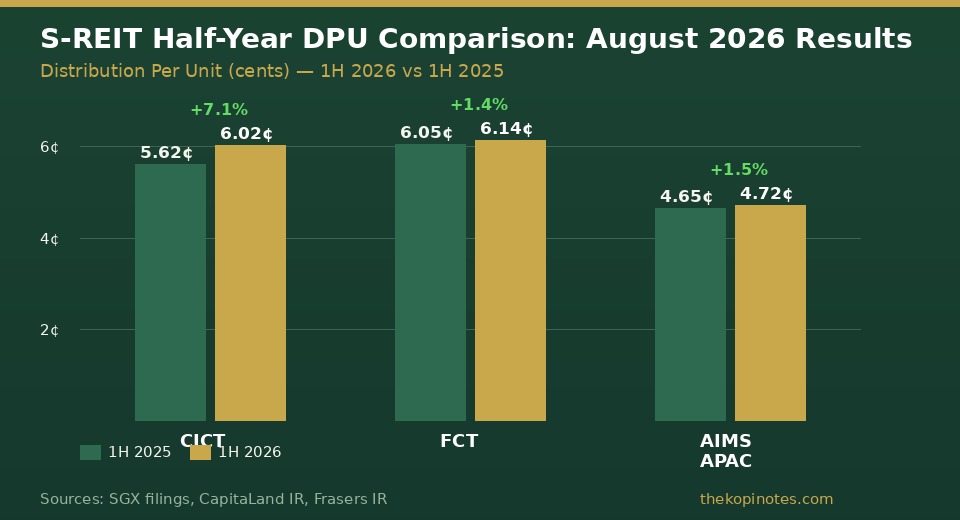
Three of Singapore’s most-tracked blue-chip S-REITs delivered distribution increases in August 2026’s results season. CapitaLand Integrated Commercial Trust (CICT) led the pack with a 7.1% jump in half-year DPU to 6.02 cents, while Frasers Centrepoint Trust (FCT) grew its payout 1.4% to 6.136 cents. For Singapore retail investors holding S-REITs for passive income, the numbers are broadly encouraging — though rising unit prices mean yields have compressed from their 2024 highs.
This is an editorial analysis. Not financial advice. Data verified as at 28 August 2026.
What Happened: S-REIT Results Season August 2026
August 2026 has been a busy month for Singapore REIT investors. As REITs filed their half-year financial results with SGX, a clear picture emerged: Singapore’s blue-chip commercial and retail REITs are generating stronger distributable income, supported by positive rental reversions, full-period contributions from recently acquired assets, and disciplined capital management.
The backdrop matters. Singapore’s broader economy grew 5.9% year-on-year in Q2 2026, with the government raising the full-year forecast to 4.5–5.5% on the back of a stronger-than-expected AI investment boom. A healthy labour market and robust retail spending have fed directly into the operating performance of retail-focused REITs like FCT, while office and integrated development REITs like CICT benefited from the spillover of corporate activity in Singapore’s CBD.
For income investors, the question is simple: are the distributions growing, and are they sustainable? Based on the August 2026 results, the answer for Singapore’s blue chips is yes — with some nuance.
CICT: Singapore’s Largest REIT Delivers 7.1% DPU Growth
CapitaLand Integrated Commercial Trust (SGX: C38U), Singapore’s largest listed REIT, announced its 1H 2026 results on 12 August 2026. The headline numbers were strong across the board:
- Distribution per unit (DPU): 6.02 cents, up 7.1% year-on-year from 5.62 cents in 1H 2025
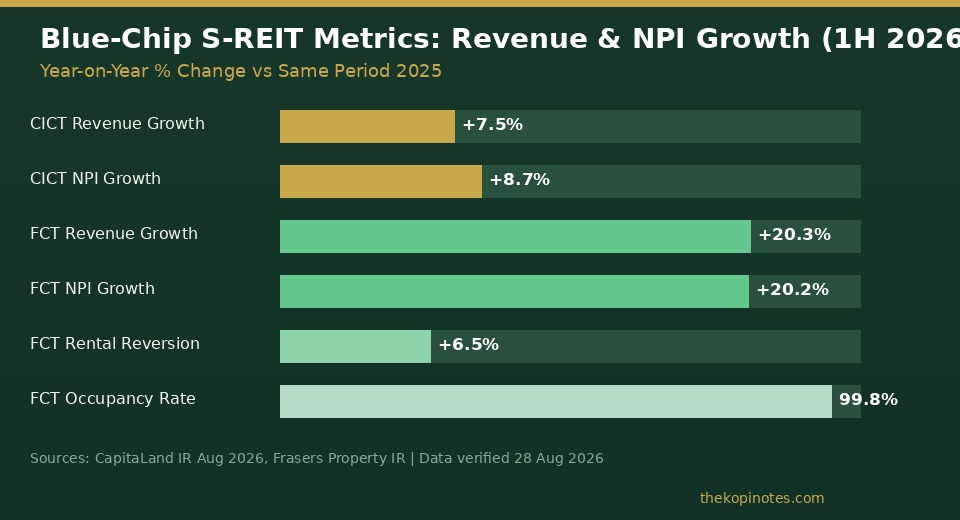
- Gross revenue: S$846.8 million, up 7.5% year-on-year
- Net property income (NPI): S$630.5 million, up 8.7% year-on-year
- Distributable income: S$466.7 million, up 13.3% year-on-year
The outperformance was driven by the full contribution from CapitaSpring’s commercial component and progressive income from Gallileo, CICT’s Frankfurt-based office property. Retail occupancy across CICT’s Singapore malls remained high, with positive rental reversions reflecting the continued demand for prime retail space in Raffles City, Plaza Singapura, and its other flagship assets.
The DPU of 6.02 cents is structured in two tranches: an advanced distribution of 3.98 cents paid in June 2026, and a remaining 2.04 cents payable on 25 September 2026 to unitholders on record as at 20 August 2026. This structure is typical of CICT following its April 2026 private placement, which enlarged the unit base — yet DPU still grew by 7.1%, a signal that the new equity was deployed productively.
At a unit price of approximately S$2.37 (as of mid-August 2026), CICT’s trailing 12-month yield works out to around 5.1%, slightly below the sector average of 5.4%. This compression reflects how well CICT has re-rated as investors gained confidence in its income trajectory. You can read our earlier analysis of CICT’s Q1 2026 results here.
For investors looking at S-REITs for long-term income, CICT’s 13.3% growth in distributable income is the most important number. It shows the trust is not merely maintaining payouts — it’s compounding them.
FCT: Suburban Retail Resilience, 20% Revenue Growth
Frasers Centrepoint Trust (SGX: J69U) is Singapore’s largest suburban retail REIT, with a portfolio of nine suburban malls anchored by names like Causeway Point, Northpoint City, and Waterway Point. Its 1H FY2026 results (period ended 31 March 2026) demonstrated just how resilient Singapore’s suburban retail segment is:
- DPU: 6.136 cents, up 1.4% year-on-year from 6.05 cents in 1H FY2025
- Gross revenue: S$221.9 million, up 20.3% year-on-year
- Net property income: S$160.8 million, up 20.2% year-on-year
- Portfolio occupancy: 99.8% — essentially fully occupied
- Rental reversion: +6.5% — new leases signed at materially higher rates
The revenue surge looks dramatic but reflects the first full-period consolidation of Northpoint City South Wing following FCT’s equity raise in 2025. After adjusting for dilution from that raise and a small income retention, DPU grew 1.4% — modest but meaningful in a high-interest-rate environment where many REITs saw distributions decline.
The 99.8% occupancy rate stands out. It reflects the structural advantage of FCT’s portfolio: suburban malls serving HDB heartland communities, where footfall is driven by essential daily needs rather than discretionary spending. Rental reversions of +6.5% demonstrate that FCT’s leases are priced below market, providing a built-in growth runway as leases expire and are renewed at higher rates.
Debt maturity has been prudently managed, with FCT facing negligible refinancing pressure through FY2027. This is important context for retail investors: S-REITs with well-managed debt profiles are far less exposed to interest rate volatility than peers with concentrated near-term refinancing risk.
For investors interested in the FCT vs broader REIT ETF debate, see our comparison: REITs vs ETF Singapore — Which Is Better for Passive Income?
Key Metrics Comparison: CICT vs FCT vs Sector
Here’s a side-by-side snapshot of the two leading performers this results season, compared against key sector benchmarks:
| Metric | CICT (C38U) | FCT (J69U) | S-REIT Sector Avg |
|---|---|---|---|
| 1H 2026 DPU | 6.02 cents | 6.136 cents | — |
| DPU Growth (YoY) | +7.1% | +1.4% | Mixed |
| Revenue Growth (YoY) | +7.5% | +20.3%* | ~5–8% |
| NPI Growth (YoY) | +8.7% | +20.2%* | ~5–9% |
| Portfolio Occupancy | High (>97%) | 99.8% | ~94–97% |
| Rental Reversion | Positive | +6.5% | ~+3–6% |
| Approx. Trailing Yield | ~5.1% | ~5.5% | ~5.4% |
*FCT revenue/NPI growth includes first full-period contribution from Northpoint City South Wing equity raise. Sources: CapitaLand IR (Aug 2026), Frasers Property IR, Turtle Investor, Growbeansprout. Data verified 28 Aug 2026.
What Rising Unit Prices Mean for Yield-Seeking Investors
Here’s the tension that every S-REIT investor faces right now. Distributions are growing. But unit prices have also risen significantly — the STI is up ~34.8% year-on-year as of late August 2026, and blue-chip REITs have re-rated alongside it. CICT, for example, trades at approximately S$2.37, up meaningfully from its 2024 lows.
This compression is mathematically simple: if a REIT’s DPU grows 7% but its unit price rises 15%, the yield still falls. This is the reality facing new buyers of CICT today. The trailing yield of ~5.1% is below both CICT’s own historical average and the sector average of 5.4%. It remains attractive relative to bank fixed deposits and CPF OA rates — but the margin of safety is thinner than it was 18 months ago.
FCT’s yield is more competitive at ~5.5%, and its suburban retail model provides a more defensive income profile than office-heavy peers. If you’re deploying fresh capital into S-REITs in H2 2026, FCT arguably offers a better entry point on a pure yield basis.
For a broader view of how S-REITs stack up against passive ETF income, see our guide: ETF vs REIT Income Comparison Singapore. And if you prefer a one-ticker S-REIT exposure through CPFIS, the Lion-Phillip S-REIT ETF (CLR) guide is worth reading before you decide.
The Broader S-REIT Landscape: Challenges and Tailwinds
Not every S-REIT had a smooth August 2026 results season. Mapletree Pan Asia Commercial Trust (MPACT, SGX: N2IU) — with S$15.2 billion in AUM across Singapore, China, Hong Kong, Japan and South Korea — reported a 1Q FY26/27 DPU of 1.96 cents. While its Singapore portfolio continues to grow, overseas assets in China and Hong Kong face structural headwinds from slower economic activity. MPACT’s yield of approximately 5.7% reflects both the income and the additional risk that comes with pan-Asian exposure.
The broader S-REIT picture heading into H2 2026 is shaped by several forces:
- Interest rates: While the rate cycle has turned, Singapore’s 10-year SGS yields remain elevated. REITs with floating-rate debt still face refinancing costs higher than pre-2022 levels.
- Singapore economy: GDP growth of 5.9% in Q2 supports retail and office occupancy. A sustained AI-driven upcycle benefits premium office space, a tailwind for CICT and Keppel REIT.
- Capital recycling: Blue-chip REITs are actively managing portfolios — divesting non-core assets and deploying proceeds into higher-yielding acquisitions. CICT’s Gallileo contribution is one such example.
- CPF and SRS eligibility: Many blue-chip S-REITs remain eligible for CPF Investment Scheme (CPFIS-OA) investment. This is a significant advantage for Singapore retail investors who can deploy CPF OA funds earning 2.5% into instruments targeting 5–5.5% yields.
Should You Buy, Hold, or Wait?
This is an editorial analysis, not a buy/sell recommendation. But based on the August 2026 results data, here’s a framework for thinking about S-REITs now:
If you already own CICT or FCT: The fundamentals support holding. DPU is growing, occupancy is high, debt management is sound. The main risk is unit price downside if Singapore’s economic momentum stalls or global interest rates surprise to the upside.
If you’re looking to enter: FCT offers a better starting yield at ~5.5% and its suburban retail portfolio is more defensive in a potential slowdown scenario. CICT is higher quality but its 5.1% yield is priced for perfection. Consider dollar-cost averaging rather than deploying a lump sum at current levels.
If you prefer diversified S-REIT exposure: The best S-REITs in Singapore for 2026 guide covers yield comparison across the sector. The Lion-Phillip S-REIT ETF (CLR) remains the only CPFIS-approved, SGX-listed ETF for broad S-REIT exposure at a 0.60% TER.
For a comprehensive overview of S-REIT investing, see our Best REITs Singapore 2026 guide.
Bottom Line for SG Investors
August 2026’s results season has confirmed what many Singapore income investors were hoping: blue-chip S-REITs are growing their distributions, not cutting them. CICT’s 7.1% DPU growth and FCT’s resilient 1.4% increase, against a backdrop of near-full occupancy and positive rental reversions, show that the operational fundamentals are strong.
The caution is in the price. With the STI at multi-year highs and blue-chip REIT unit prices elevated, the margin of safety for new buyers is narrower than it was 18 months ago. Income investors should focus on REITs where DPU growth is compounding — not just being maintained — and where debt management leaves room to absorb a higher-for-longer rate environment.
CICT and FCT both clear that bar. The question for each investor is whether the current yield compensates adequately for the risk of unit price compression if Singapore’s growth story loses momentum.
Data sources: CapitaLand Integrated Commercial Trust official press release (12 Aug 2026), Frasers Property IR, SGX announcements, Turtle Investor, Growbeansprout, The Smart Investor. Data verified as at 28 August 2026.
Frequently Asked Questions
Which Singapore S-REITs raised their DPU in August 2026?
CapitaLand Integrated Commercial Trust (CICT) raised its 1H 2026 DPU by 7.1% to 6.02 cents, and Frasers Centrepoint Trust (FCT) raised its 1H FY2026 DPU by 1.4% to 6.136 cents. Several other S-REITs also reported results during August 2026’s results season.
What is CICT’s current dividend yield?
At a unit price of approximately S$2.37 (mid-August 2026), CICT’s trailing 12-month yield is approximately 5.1%. This is slightly below the S-REIT sector average of 5.4%.
What is FCT’s current dividend yield?
FCT’s trailing yield is approximately 5.5% based on its 1H FY2026 annualised DPU and prevailing unit price. FCT’s 99.8% portfolio occupancy and +6.5% rental reversions support continued income growth.
Can I use CPF to invest in CICT or FCT?
Yes. Both CICT and FCT are eligible for investment under the CPF Investment Scheme (CPFIS-OA). You can use your CPF Ordinary Account funds (earning 2.5%) to invest in these REITs, which target yields of 5–5.5%. For CPF investment scheme returns context, see our CPF Investment Scheme Returns guide.
How does the Lion-Phillip S-REIT ETF compare to buying individual REITs?
The Lion-Phillip S-REIT ETF (CLR) provides diversified exposure to Singapore REITs in a single ticker, with CPFIS-OA eligibility and a TER of 0.60%. Individual REITs like CICT and FCT may offer higher yields and more targeted exposure. For a full comparison, see our Lion-Phillip S-REIT ETF guide.
Is now a good time to buy Singapore REITs?
S-REIT valuations have re-rated significantly in 2026, with the STI up over 34% year-on-year. Blue-chip REIT yields have compressed to 5.1–5.5%, leaving a narrower margin of safety. Dollar-cost averaging over multiple months is generally more prudent than deploying a lump sum at current elevated price levels. This is not financial advice — consult a licensed financial adviser before making investment decisions.
What are the key risks for S-REIT investors in H2 2026?
Key risks include: (1) higher-for-longer interest rates increasing refinancing costs; (2) a slowdown in Singapore’s AI and manufacturing-driven economic growth; (3) unit price compression if equity markets correct; and (4) overseas asset underperformance for diversified REITs like MPACT with significant China exposure.
This article was researched with the help of AI. While we strive to keep all information accurate and up to date, there may be errors. If you notice any discrepancies, please contact us.