ILP Fund Performance Singapore 2026: Real Sub-Fund Returns & How to Check Yours
Actual AIA, Prudential, Manulife and GreatLink fund factsheet data — plus the pricing quirk that quietly eats your first-year returns.
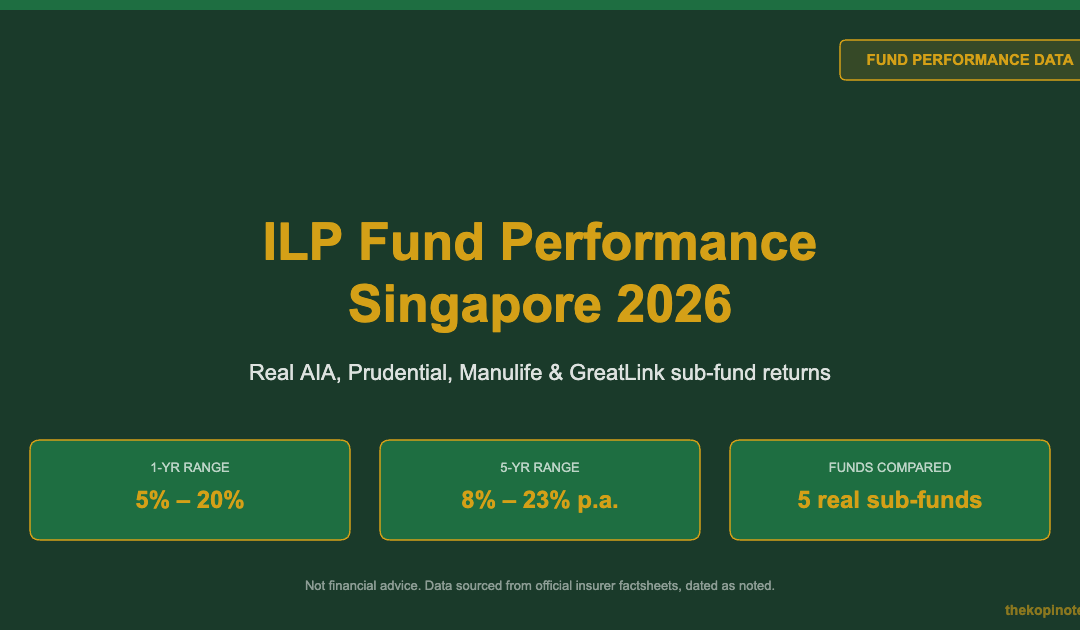
ILP fund performance varies far more than most policyholders realise. Real 2025/2026 factsheet data shows annualised returns from about 5% to over 20%, depending on the sub-fund and the exact time window. Your policy’s actual return depends on which sub-fund you picked and whether you’re reading offer-bid or bid-bid figures — two very different numbers.
Not financial advice. All fund performance figures below are pulled directly from each insurer’s official published factsheets, with the exact “data as at” date stated for every figure. Data verified as at 14 July 2026. Past performance never guarantees future returns.
- Real 1-year ILP sub-fund returns range from about 5% to 20%+ — Singapore equity funds had a strong run into 2025/26, while global and US equity funds were more mixed.
- “Offer-bid” and “bid-bid” are not the same number. Offer-bid includes your upfront sales charge, so year one always looks worse than the fund actually did.
- You can check your own fund’s real numbers for free on your insurer’s fund factsheet page — no guessing needed. We show you where, below.
Table of Contents
Contents — Click to expand
What “ILP fund performance” actually means
An investment-linked policy (ILP) bundles life insurance with units in one or more investment funds you choose. Part of your premium buys units in that sub-fund. The rest covers your insurance charges.
“ILP fund performance” is simply how well your chosen sub-fund’s Net Asset Value (NAV) — the price of one unit — has grown over time. It has nothing to do with your policy’s death benefit or surrender value formula directly. It only measures the underlying investment.
Here’s why this matters. Two people holding the exact same ILP product can end up with very different outcomes. One picked a Singapore equity fund. The other picked a global bond fund. Their policy’s cash value diverges completely, even though both bought the “same” plan.
If you already have an ILP, we covered the full plan-selection side in our best ILP in Singapore 2026 guide and the fee mechanics in our investment-linked policy Singapore guide. This article focuses purely on performance — the numbers your existing policy is actually generating.
Why the same fund shows two different return numbers
Open any ILP fund factsheet and you’ll usually see two performance rows: “Offer-to-Bid” and “Bid-to-Bid”. They are not interchangeable, and mixing them up makes your fund look worse — or better — than it really is.
Bid-to-bid measures pure fund performance. It compares the unit price you’d get selling today against the unit price you’d have gotten selling in the past. This is the fairest measure of how well the fund manager actually did.
Offer-to-bid bakes in the upfront sales charge (often around 5%) that many ILPs deduct when you first buy units. That means offer-to-bid returns always look lower in year one — you’re comparing a price that already includes a 5% haircut against today’s bid price.
Here’s a real example from Prudential’s own published factsheet for the PRULink Global Equity Fund (SGD Accumulation Class). Notice how the gap between offer-to-bid and bid-to-bid shrinks the longer you hold:
| Period | Offer-to-Bid | Bid-to-Bid | Drag from upfront charge |
|---|---|---|---|
| 1 Year | 7.9% | 13.6% | -5.7 percentage points |
| 3 Years (p.a.) | 11.5% | 13.4% | -1.9 percentage points |
| 10 Years (p.a.) | 8.5% | 9.1% | -0.6 percentage points |
Source: Prudential Assurance Company Singapore, PRULink Global Equity Fund factsheet, data as at 30 Apr 2026.
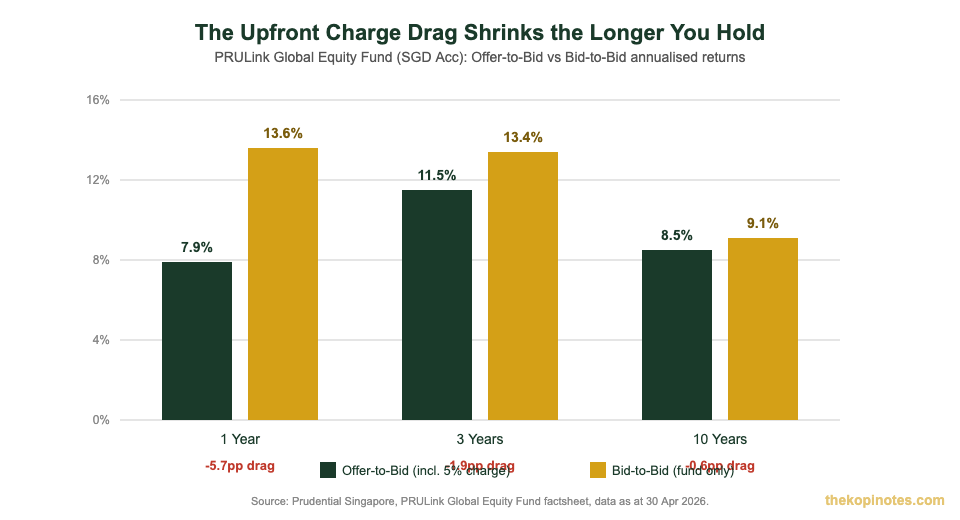
The takeaway: the one-off 5% charge is a fixed cost, so the longer you hold your ILP, the smaller its annual drag becomes. That’s exactly why ILPs are designed as medium-to-long-term holdings, not something you buy and sell within a year or two.
Real ILP sub-fund performance data (2025/2026)
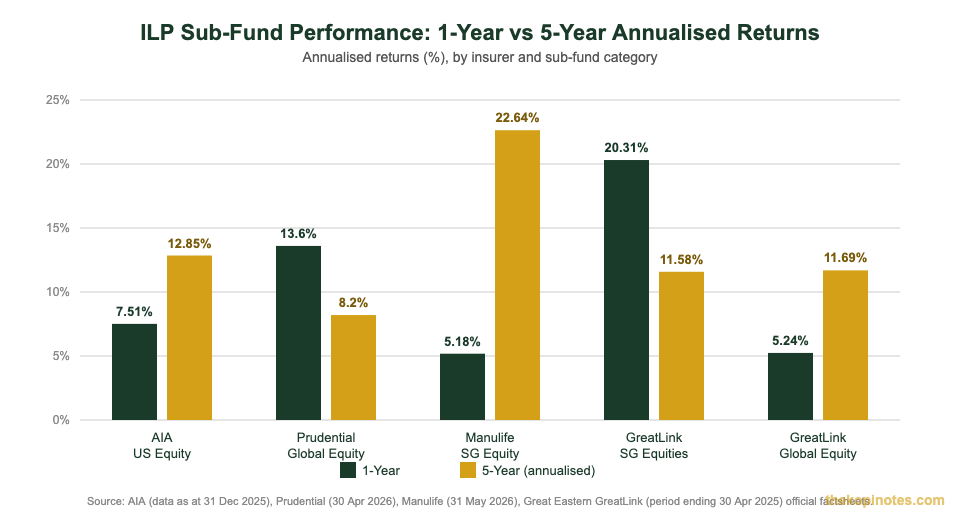
Forget generic percentages. Here’s actual published performance data, pulled straight from five ILP sub-funds across four major Singapore insurers. Each row states its own data date — because, as you’ll see, that matters a lot.
| Insurer | Sub-Fund | Category | 1-Year | 5-Year (p.a.) | 10-Year (p.a.) | Data as at |
|---|---|---|---|---|---|---|
| AIA | AIA US Equity Fund | US Equity | 7.51% | 12.85% | 11.40% | 31 Dec 2025 |
| Prudential | PRULink Global Equity Fund (SGD Acc, bid-bid) | Global Equity | 13.6% | 8.2% | 9.1% | 30 Apr 2026 |
| Manulife | Manulife Singapore Equity Fund (Class A, NAV-NAV) | Singapore Equity | 5.18% | 22.64% | — | 31 May 2026 |
| Great Eastern | GreatLink Singapore Equities Fund | Singapore Equity | 20.31% | 11.58% | — | Period to 30 Apr 2025 |
| Great Eastern | GreatLink Global Equity Fund | Global Equity | 5.24% | 11.69% | — | Period to 30 Apr 2025 |
Source: AIA Singapore fund summary (data as at 31 Dec 2025); Prudential Singapore PRULink Global Equity Fund factsheet (30 Apr 2026); Manulife Investment Management Singapore Equity Fund factsheet (31 May 2026); Great Eastern GreatLink Funds overview, 1-year period 1 May 2024–30 Apr 2025, 5-year period 1 May 2020–30 Apr 2025.
Three things jump out. First, the spread is huge — a 15+ percentage point gap in 1-year returns between the best and worst performer here, all filed under “equity funds.” Second, Singapore equity funds had a genuinely strong run behind DBS, OCBC, UOB and SEA Ltd’s rally — both the Manulife and GreatLink Singapore funds show it. Third, and easy to miss: these five factsheets have different “as at” dates, from April 2025 through May 2026. Never compare two funds’ returns unless you’re looking at the same start and end dates.
That last point is why a fund’s 1-year return alone tells you very little. A fund that’s up 20% in one 12-month window and down 5% in the next isn’t unusual — equity markets are noisy over short periods. The 5-year and 10-year annualised figures smooth that out and are the more honest read on whether a fund manager has actually added value.
How to check your own ILP fund’s performance
You don’t need to guess or wait for your annual statement. Every major insurer publishes fund factsheets online, updated monthly. Here’s how to find yours in under five minutes.
Step 1: Find your exact sub-fund name. Check your latest annual benefit statement or policy schedule — it lists the precise fund(s) your premiums are invested in. “AIA US Equity Fund” and “AIA American Fund” are not the same thing, so get the exact name.
Step 2: Go to your insurer’s fund performance page. Each insurer publishes this for free:
- AIA: AIA ILP Fund Performance
- Prudential: PruAccess PRULink Fund Performance
- Manulife: Manulife Fund Prices & Performance
- Great Eastern: GreatLink Funds Prices
- Income Insurance (NTUC Income): Income Insurance Historical Returns
Step 3: Read bid-to-bid, not offer-to-bid. As covered above, bid-to-bid gives you the fairer picture of how the fund manager actually performed.
Step 4: Compare against the stated benchmark. Every factsheet lists one — usually an MSCI or FTSE index. A fund beating its own benchmark over 5+ years is doing its job. One consistently lagging it, year after year, is worth questioning.
Step 5: Look at 3, 5 and 10-year annualised figures, not just 1-year. A single bad or great year rarely tells you much about fund manager skill.
Should you switch ILP sub-funds?
Most ILPs let you switch between sub-funds — often one or two free switches a year, with a small fee (commonly around 1%, capped) after that. So if your fund is underperforming, can’t you just switch to a better one?
In practice, be careful here. The fund at the top of last year’s return table is often the fund about to have a weaker year — chasing recent winners is a classic investor mistake, in ILPs and everywhere else.
Before switching, ask yourself three questions. Has this fund lagged its own benchmark over 3+ years, not just one bad year? Does the new fund match your original risk tolerance and time horizon? And are you switching for a genuine reason, or because a headline return caught your eye?
If your existing fund has genuinely underperformed its benchmark for several years running, a switch can make sense. If you’re reacting to one strong or weak year, it usually doesn’t.
ILP fund performance vs a simple ETF portfolio
Here’s a question worth asking honestly: is your ILP sub-fund’s performance, after all its charges, actually beating what you’d get from a low-cost diversified portfolio instead?
We ran the full 25-year cost comparison between an ILP and a term life policy plus a separate ETF portfolio in our best ILP in Singapore 2026 guide — the gap between the two approaches over the long run is significant, mostly because of ILP fund fees compounding year after year, not the insurance cost itself.
If you’re reading this because your ILP’s numbers look disappointing, robo-advisors like Endowus or Syfe offer lower-fee diversified portfolios you can hold separately from your insurance — worth comparing before deciding what to do with an underperforming sub-fund.
Risks and limitations
A few honest caveats before you make any decisions off this data. Past performance never guarantees future returns — every insurer says this on every factsheet for good reason. Currency and hedging differences mean a “Global Equity” fund from one insurer isn’t always investing the same way as another insurer’s fund with a similar name.
Fund factsheet dates differ, sometimes by a full year, so side-by-side comparisons across insurers are indicative, not exact. And remember that your ILP is fundamentally an insurance-plus-savings hybrid, not a pure investment vehicle — its performance should be judged alongside your coverage needs, not in isolation.
Frequently Asked Questions
What is ILP fund performance and where can I check it?
It’s how much your investment-linked policy’s chosen sub-fund has grown in unit price (NAV) over a given period. You can check it for free on your insurer’s official fund performance or fund factsheet page — AIA, Prudential, Manulife, Great Eastern and Income Insurance all publish these monthly.
Why do ILP sub-funds show 'offer-bid' and 'bid-bid' returns?
Bid-to-bid measures pure fund performance. Offer-to-bid includes the upfront sales charge (often around 5%), which drags down the return most heavily in year one and matters less the longer you hold.
How often should I check my ILP fund's performance?
Once or twice a year is enough for most people. ILPs are medium-to-long-term holdings, and short-term swings in equity or bond markets don’t usually justify a change of plan.
Can I switch to a better-performing ILP sub-fund?
Most ILPs allow fund switches, often with one or two free switches a year. Switch based on sustained multi-year underperformance versus the fund’s own benchmark — not because of a single strong or weak year for a different fund.
Do ILP sub-funds usually beat their benchmark?
Not always, and factsheets show this openly. In our data above, Prudential’s PRULink Global Equity Fund lagged its MSCI benchmark over 1, 3, 5 and 10 years on a bid-to-bid basis — a reminder to check this yourself rather than assume.
Is ILP fund performance directly comparable to unit trusts or ETFs?
Not exactly. ILP sub-fund returns are net of insurance-related charges that don’t apply to a standalone unit trust or ETF holding the same underlying assets, so a direct like-for-like return comparison needs care.
Related reading
Get Free Insurance Advice
Speak with a licensed insurance advisor. No obligation, no cost.
By submitting this form, you agree to our Privacy Policy.
This article was researched with the help of AI. While we strive to keep all information accurate and up to date, there may be errors. If you notice any discrepancies, please contact us.