Keppel DC REIT Portfolio 2026: Occupancy, WALE, Rental Reversions & Geographic Mix
Keppel DC REIT (SGX: AJBU) holds 25 data centres across 10 countries. Its 1H2026 DPU reached 5.714 cents — up 11.3% year-on-year — driven by near-full occupancy, positive rental reversions, and surging AI demand. This deep dive breaks down the portfolio by geography, tenancy quality, and rental reversion trends so you can judge whether the growth story holds.
Not financial advice. All figures are for educational reference only. Data as at September 2026 unless noted.
- Occupancy sits above 97% across 25 data centres, with a WALE of about 6.5 years — long leases reduce income risk.
- Singapore and Australia (~68% of AUM combined) anchor the portfolio with the highest occupancy and most positive rental reversions.
- AI and hyperscaler demand is pushing double-digit rental reversions in mature markets — the main DPU growth catalyst beyond 2026.
Table of Contents
- 1. Portfolio Overview: 25 DCs, 10 Countries
- 2. Geographic Breakdown and AUM Weight
- 3. Occupancy Rate and WALE Analysis
- 4. Rental Reversions: The AI Demand Effect
- 5. DPU History and Growth Trajectory
- 6. Portfolio Quality vs S-REIT Peers
- 7. How Singapore Investors Can Buy KDC REIT
- 8. Frequently Asked Questions
1. Portfolio Overview: 25 Data Centres, 10 Countries
Keppel DC REIT is Singapore’s first and largest listed data centre REIT. It holds 25 data centres spread across Singapore, Australia, Malaysia, Europe, and China.
That geographic spread matters. It means the REIT is not dependent on any single market. If Singapore power costs rise or regulatory changes hit, the European and Australian portfolios provide a buffer.
As at 1H2026, the portfolio had a total Assets Under Management (AUM) of approximately S$4.5 billion. The asset base has grown steadily from around S$2.6 billion in 2019 — mainly through acquisitions in Europe and Australia.
The REIT operates under two main tenancy structures. Colocation (colo) leases, where multiple tenants share a facility, and fully fitted leases, where a single tenant occupies the entire data centre. Fully fitted leases tend to have longer terms and more predictable income — good for DPU stability.
2. Geographic Breakdown and AUM Weight
Singapore remains the largest market by AUM weight, contributing roughly 48% of total assets. This includes flagship facilities in Jurong, Tampines, and Serangoon.
Australia is the second-largest at around 20%, anchored by Sydney and Melbourne assets acquired between 2020 and 2023. Europe contributes about 17%, spread across Germany, Netherlands, Italy, Ireland, and the UK.
Malaysia and China together account for approximately 13%, with the remainder in smaller markets.
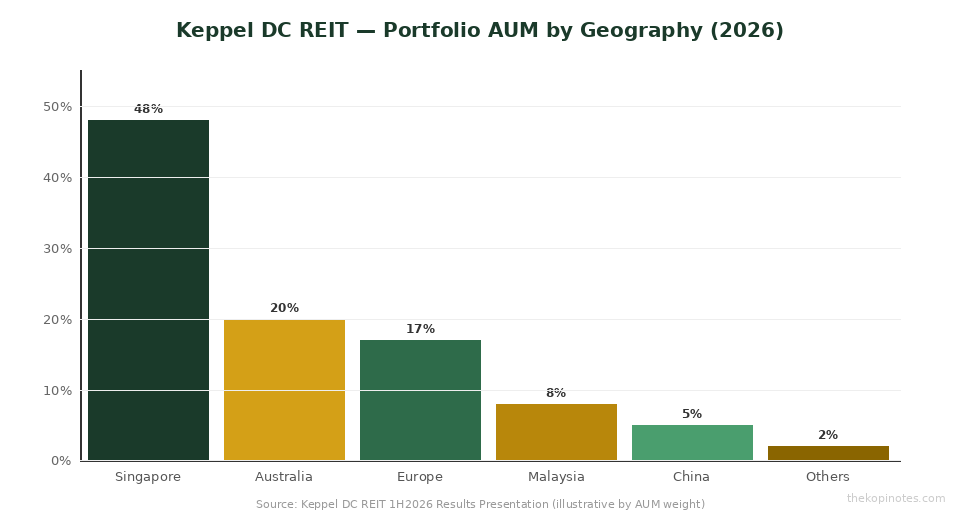
Source: Keppel DC REIT 1H2026 Results Presentation. AUM weights are approximate, rounded to nearest percent.
| Geography | No. of DCs | AUM Weight | Occupancy (est.) |
|---|---|---|---|
| Singapore | 8 | ~48% | ~99% |
| Australia | 5 | ~20% | ~98% |
| Europe | 7 | ~17% | ~96% |
| Malaysia | 3 | ~8% | ~95% |
| China | 1 | ~5% | ~92% |
| Others | 1 | ~2% | ~97% |
Source: Keppel DC REIT 1H2026 Investor Presentation. Occupancy estimates based on reported portfolio-level data; individual asset figures may vary.
3. Occupancy Rate and WALE Analysis
Occupancy is the most important metric for a data centre REIT. Empty space earns nothing — and data centres have high fixed costs. Keppel DC REIT has maintained portfolio occupancy above 97% for most of the past four years.
That is exceptional. For comparison, most S-REITs in the office or retail space consider 95% occupancy to be strong. Data centres achieve higher rates because hyperscale demand outpaces supply in most markets.
The Weighted Average Lease Expiry (WALE) for KDC REIT stands at approximately 6.5 years as at 1H2026. This means, on average, you have 6.5 years of contracted income visibility. Compare that to a typical office REIT’s 3–4 year WALE.
Why does WALE matter? When a large chunk of leases expire in any single year, you face renewal risk. With a 6.5-year WALE, KDC REIT’s lease expirations are staggered. No single year has more than 20% of leases expiring, limiting the revenue cliff risk.
Singapore assets have the longest WALE — some leases extend to 10–15 years, typically for hyperscale and government-linked tenants who need long-term certainty on capacity.
4. Rental Reversions: The AI Demand Effect
A rental reversion is the change in rent when a lease is renewed. A positive reversion means the new rent is higher than the old one. Negative reversions eat into DPU.
KDC REIT has been reporting positive rental reversions across Singapore and Australia. In 1H2026, Singapore renewals came in approximately 10–15% higher than expiring rents. That is the AI demand effect in action.
Here is why: hyperscalers (think major cloud providers and AI companies) need enormous amounts of data centre capacity — fast. They cannot build fast enough. That drives them to colocation providers and REITs. More demand for a finite supply of space pushes rental rates up.
Singapore is particularly supply-constrained. The government tightly controls power allocation for data centres. New builds require a licence and environmental approvals that can take years. This structural supply cap means existing space commands a significant premium at renewal.
| Market | 1H2026 Rental Reversion (est.) | Demand Driver |
|---|---|---|
| Singapore | +10% to +15% | Supply cap + AI hyperscalers |
| Australia | +8% to +12% | Cloud migration, government digital |
| Europe | +5% to +8% | Data sovereignty rules, AI adoption |
| Malaysia | +3% to +5% | Johor Digital Hub development |
| China | Flat to +2% | Domestic AI, regulatory uncertainty |
Source: KDC REIT 1H2026 results briefing and broker estimates. Rental reversion figures are approximate ranges — actual per-asset data varies.
Europe is also seeing positive reversions driven by EU data sovereignty requirements. Companies handling EU citizen data must keep it within the EU. That creates captive demand for European data centre capacity — a structural, non-cyclical tailwind.
5. DPU History and Growth Trajectory
KDC REIT’s DPU has grown steadily over the past four years. The 1H2026 DPU of 5.714 cents was the highest semi-annual DPU in the REIT’s history. Annualised, that puts the forward run-rate at approximately 11.4 cents per year.
At a share price of around S$2.30 (as at mid-2026), that implies a forward yield of approximately 4.9–5.0%. That is lower than most traditional S-REITs, but data centre REITs globally trade at a yield premium to their risk profile — you pay up for the growth.
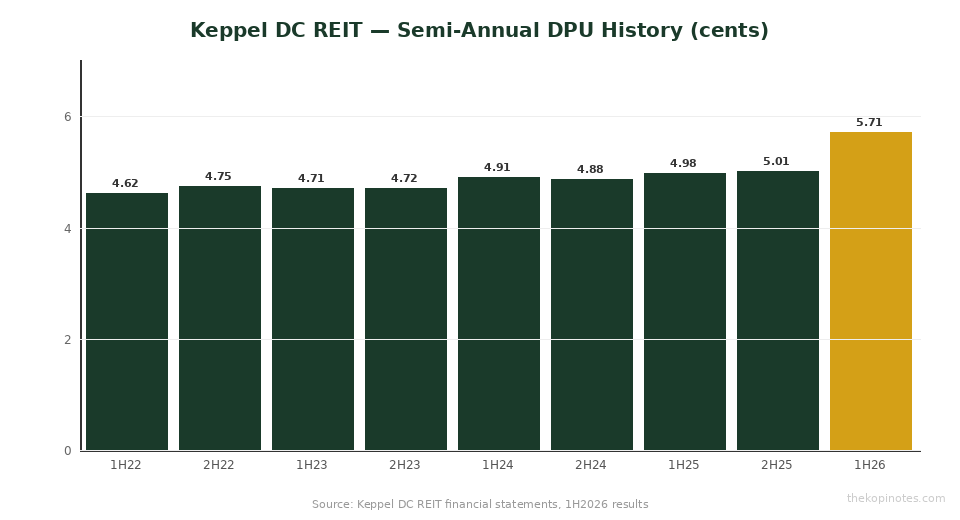
Source: Keppel DC REIT financial statements. 1H26 = 5.714 cents is actual; prior periods are historical reported DPU.
Gearing stands at approximately 34% as at 1H2026 — below the MAS 50% regulatory limit and with ample headroom for acquisitions. The cost of debt is around 3.8–4.0%, manageable given the long-duration leases that lock in income well beyond the debt maturity profile.
If the Fed cuts rates in September 2026 (markets are pricing a 25bps cut), KDC REIT stands to benefit on two fronts: lower refinancing costs on floating-rate debt, and improved sentiment for yield instruments like REITs.
6. Portfolio Quality vs S-REIT Peers
How does KDC REIT’s portfolio quality compare to other S-REITs? The comparison is most useful against Mapletree Industrial Trust (MIT), which also has data centre exposure.
MIT holds a mix of hi-tech buildings, business parks, and 18 data centres (mostly in the US). KDC REIT is 100% data centre. That pure-play positioning means KDC REIT has higher occupancy and stronger rental reversions — but also higher valuation multiples.
| Metric | Keppel DC REIT | Mapletree Industrial Trust |
|---|---|---|
| Portfolio focus | 100% data centres | Mixed (DC + hi-tech + biz parks) |
| Occupancy | >97% | ~91–93% |
| WALE | ~6.5 years | ~3–4 years |
| 1H2026 DPU | 5.714 cents | ~6.35 cents |
| Forward yield (est.) | ~4.9% | ~6.5–7.0% |
| Gearing | ~34% | ~38% |
Source: Company 1H2026 results, broker consensus estimates. Yields calculated at respective mid-2026 share prices.
For a deeper comparison of these two REITs, read our Keppel DC REIT vs Mapletree Industrial Trust comparison.
The lower yield on KDC REIT is the price you pay for higher quality metrics and stronger growth prospects. Whether that trade-off makes sense depends on your own investment objective — income now versus income growth over time.
7. How Singapore Investors Can Buy KDC REIT
You can buy Keppel DC REIT (SGX: AJBU) through any stock broker with access to the Singapore Exchange. Here are the most popular options for Singapore retail investors.
If you want a robo-adviser that invests in a diversified REIT portfolio including KDC REIT, see our Syfe referral code and sign-up bonus (use code SRPRFFFCD). Syfe REIT+ holds a basket of S-REITs and rebalances automatically.
For those who prefer to invest through CPF OA or SRS funds, Endowus (referral code 2V343) allows CPF-OA investments in S-REIT funds. This lets your CPF earn more than the default 2.5% OA rate if the REIT portfolio outperforms over time.
For direct share purchases on SGX, FSMOne (referral code P0544985) offers competitive commissions for SGX stocks and a robust dividend reinvestment feature.
If you prefer a full-service international broker, IBKR (referral code jianxiong368) offers very low commissions on SGX trades and margin lending for larger portfolios.
For broader context on choosing between S-REITs, read our guide to the best S-REITs in Singapore 2026 and our passive income Singapore guide.
You can also model your retirement income from REIT distributions using our Singapore retirement calculator.
8. Frequently Asked Questions
What is Keppel DC REIT's current occupancy rate?
What is Keppel DC REIT's WALE?
How many data centres does Keppel DC REIT own?
What is Keppel DC REIT's rental reversion in 2026?
What is the DPU of Keppel DC REIT for 1H2026?
Is Keppel DC REIT affected by AI demand?
How does Keppel DC REIT compare to Mapletree Industrial Trust for data centre exposure?
What is the gearing ratio of Keppel DC REIT?
Disclaimer: This article is for educational purposes only and does not constitute financial advice. The Kopi Notes may receive referral fees from broker links. Always conduct your own due diligence before investing. Past performance is not indicative of future results.
This article was researched with the help of AI. While we strive to keep all information accurate and up to date, there may be errors. If you notice any discrepancies, please contact us.