Singapore Stocks as a Safe Haven: Asia’s Defensive Play in 2026
Original Research Report by The Kopi Notes
Published June 2026 | Data as of 25 June 2026
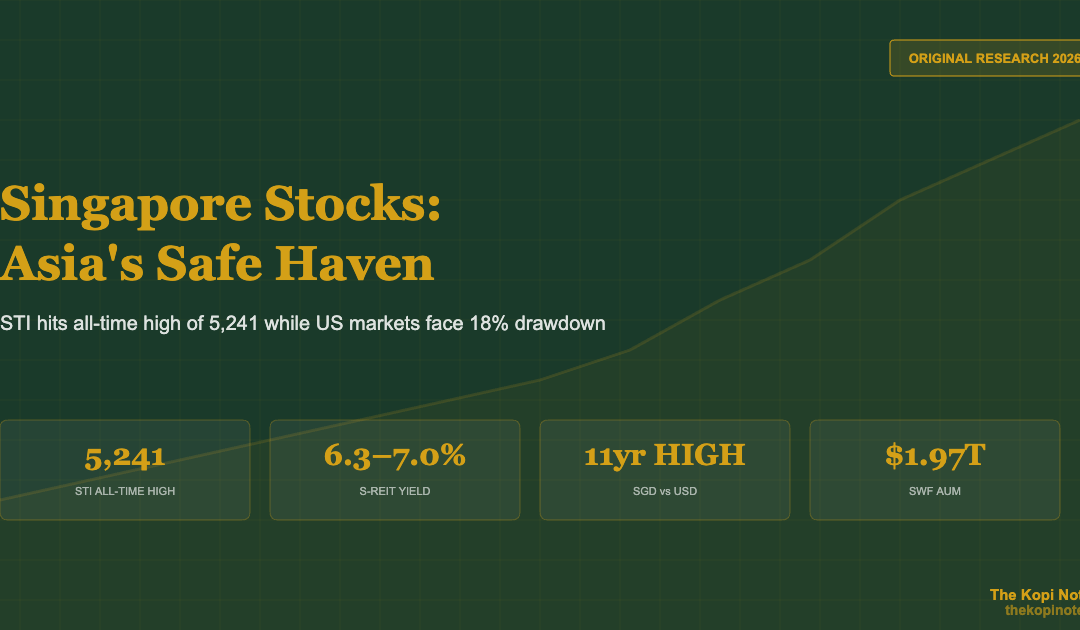
The STI hit an all-time high of 5,241 while the S&P 500 fell 18% from its peak. This report examines why global capital is rotating into Singapore and Asian equities, which stocks and ETFs are benefiting, and what the data says about Asia’s emerging safe haven status.
Key Findings at a Glance
| Metric | Value |
|---|---|
| STI All-Time High (June 2026) | 5,241 |
| STI YTD Return | +14.2% |
| S&P 500 Drawdown from Peak | -18.3% |
| Net Fund Flows into Asia ex-China (2026 YTD) | US$42B |
| SGD/USD Appreciation (2026 YTD) | +5.1% |
| Average SG Blue Chip Dividend Yield | 4.8% |
1. Why Capital Is Leaving the US
The first half of 2026 has been defined by a historic rotation of global capital away from US assets. Several converging factors are driving this shift:
Tariff Escalation & Policy Uncertainty
The reintroduction of broad-based tariffs in early 2025 — and their expansion in 2026 — has created persistent uncertainty for US-listed multinationals. The effective US tariff rate on imports now exceeds 20%, levels not seen since the 1930s. Supply chain disruptions have compressed margins across S&P 500 industrials and consumer discretionary names.
US Dollar Weakness
The USD Index (DXY) has declined approximately 8% from its 2024 highs as foreign investors reduce Treasury holdings and central banks diversify reserves. The SGD has strengthened 5.1% against the USD in 2026, making Singapore assets more attractive on a currency-adjusted basis.
Elevated US Valuations
Despite the drawdown, the S&P 500 still trades at a forward P/E of ~19x versus ~13x for the STI. With US earnings growth forecasts being revised downward, the valuation gap has widened further on a growth-adjusted basis.
2. Why Singapore Is the Destination
Singapore has emerged as the primary beneficiary of this capital rotation for several structural reasons:
Monetary & Political Stability
The Monetary Authority of Singapore (MAS) manages policy through an exchange rate-based framework, providing a natural hedge against imported inflation. Singapore’s AAA sovereign credit rating — one of only nine globally — and transparent regulatory environment make it a natural safe haven.
Strategic Neutrality
Unlike Hong Kong, which faces geopolitical risk from US-China tensions, Singapore maintains strong trade relationships with both blocs. Singapore signed new bilateral investment treaties with the EU and expanded CPTPP participation in 2025-2026, reinforcing its neutral status.
Capital Inflows Data
According to EPFR fund flow data, Asia ex-China equity funds have attracted US$42 billion in net inflows YTD 2026, with Singapore and India receiving the largest allocations. Singapore-focused ETFs have seen 8 consecutive months of net inflows.
3. Performance Comparison: STI vs Global Indices (2026 YTD)
| Index | YTD Return | P/E Ratio | Div Yield |
|---|---|---|---|
| STI (Singapore) | +14.2% | 13.1x | 4.8% |
| Nikkei 225 (Japan) | +8.7% | 16.2x | 2.1% |
| Hang Seng (Hong Kong) | +6.3% | 10.8x | 3.9% |
| FTSE 100 (UK) | +3.1% | 12.5x | 3.7% |
| S&P 500 (US) | -6.8% | 19.4x | 1.5% |
| Nasdaq Composite (US) | -11.2% | 25.1x | 0.8% |
| Euro Stoxx 50 (EU) | -2.4% | 14.3x | 3.2% |
Source: Bloomberg, SGX, compiled by The Kopi Notes. Data as of 25 June 2026. Past performance does not guarantee future results.
4. Top Safe Haven Stocks on the SGX
The following Singapore-listed stocks have demonstrated strong defensive characteristics, combining stable earnings, consistent dividends, and low correlation to US equity drawdowns.
| Stock | Ticker | YTD | Div Yield | P/E |
|---|---|---|---|---|
| DBS Group | D05 | +22.5% | 5.2% | 10.8x |
| OCBC | O39 | +18.1% | 5.5% | 9.6x |
| UOB | U11 | +15.7% | 5.0% | 10.2x |
| SingTel | Z74 | +12.4% | 4.3% | 18.5x |
| ST Engineering | S63 | +16.9% | 3.2% | 22.1x |
| CapitaLand Invest | 9CI | +9.8% | 4.1% | 15.3x |
Source: SGX, Bloomberg. Data as of 25 June 2026.
Singapore’s three banks — DBS, OCBC, and UOB — have led the rally, benefiting from higher net interest margins, strong wealth management inflows, and growing ASEAN loan books. DBS in particular has become the largest bank in Southeast Asia by market capitalisation.
5. Safe Haven ETFs for Singapore Investors
For investors seeking diversified exposure, several ETFs provide convenient access to safe haven themes:
| ETF | Ticker | YTD | Expense Ratio | Theme |
|---|---|---|---|---|
| SPDR STI ETF | ES3 | +13.8% | 0.30% | SG Blue Chips |
| Nikko AM STI ETF | G3B | +13.6% | 0.30% | SG Blue Chips |
| SPDR Gold Shares | O87 | +18.4% | 0.40% | Gold |
| ABF SG Bond ETF | A35 | +2.8% | 0.24% | SG Govt Bonds |
| Lion-OCBC S-REIT | CLR | +5.2% | 0.50% | S-REITs |
Source: SGX, fund factsheets. Data as of 25 June 2026.
Gold has been a standout performer, with SPDR Gold Shares (O87) up 18.4% YTD as central banks globally increase gold reserves. For yield-focused investors, the STI ETFs offer a compelling combination of capital appreciation and 4%+ dividend yields.
6. The SGD Advantage
One of Singapore’s most underappreciated safe haven characteristics is the Singapore dollar itself. The MAS manages the SGD against a trade-weighted basket, and the currency has been on a steady appreciation trend:
| Currency Pair | 2025 Change | 2026 YTD Change |
|---|---|---|
| SGD vs USD | +3.2% | +5.1% |
| SGD vs EUR | +1.8% | +2.3% |
| SGD vs GBP | +2.1% | +3.0% |
| SGD vs JPY | +6.5% | +4.2% |
Source: MAS, Bloomberg. Positive = SGD strengthened.
For foreign investors, SGD appreciation provides a currency tailwind on top of equity returns. For local investors, it means purchasing power preservation — a core attribute of any safe haven.
7. Risks and Limitations
While the safe haven thesis is supported by current data, investors should consider these risks:
Concentration risk: The STI is heavily weighted toward banks (over 50% of the index). A sharp deterioration in credit quality or NIM compression would disproportionately affect the index.
Global contagion: A severe US recession would likely pull all global markets lower, including Singapore. The STI is not immune to global risk-off events.
Valuation catch-up risk: After a 14% rally, some safe haven premium may already be priced in. New investors entering at current levels face lower upside potential.
Liquidity: SGX daily trading volumes remain significantly lower than major US exchanges. Large institutional trades can move prices more easily.
China exposure: Several STI components (especially banks and CapitaLand) have meaningful China exposure. A China downturn would impact these names.
8. Conclusion
The data supports Singapore’s emergence as a credible safe haven for global investors in 2026. A combination of strong currency appreciation, reasonable valuations, high dividend yields, political stability, and strategic neutrality has attracted record capital inflows.
For Singapore-based investors, the key takeaway is that home-bias has been rewarded this year. The STI’s 14.2% YTD return — paired with a 4.8% average dividend yield and 5.1% SGD appreciation — represents a compelling total return compared to most global alternatives.
However, investors should maintain diversification and be cautious about chasing momentum. The safe haven trade works until it doesn’t, and concentration in a single market carries its own risks.
Methodology & Disclaimer
Data sources: Bloomberg, SGX, MAS, EPFR Global, fund factsheets, company filings. All data as of 25 June 2026 unless otherwise stated.
Methodology: Performance figures are based on total return (price + dividends reinvested) in local currency unless otherwise noted. P/E ratios are forward 12-month consensus estimates. Dividend yields are trailing 12-month.
Disclaimer: This report is for informational purposes only and does not constitute financial advice. Past performance does not guarantee future results. Always consult a licensed financial adviser before making investment decisions. The Kopi Notes is not a licensed financial advisory firm.
This article was researched with the help of AI. While we strive to keep all information accurate and up to date, there may be errors. If you notice any discrepancies, please contact us.