Mapletree Pan Asia Commercial Trust 1Q FY26/27 Results: DPU Falls 2.5% to 1.96 Cents Despite VivoCity Strength (SGX: N2IU)
Finance expenses fell almost three times faster than revenue — here’s what MPACT’s 30 July numbers mean for you.
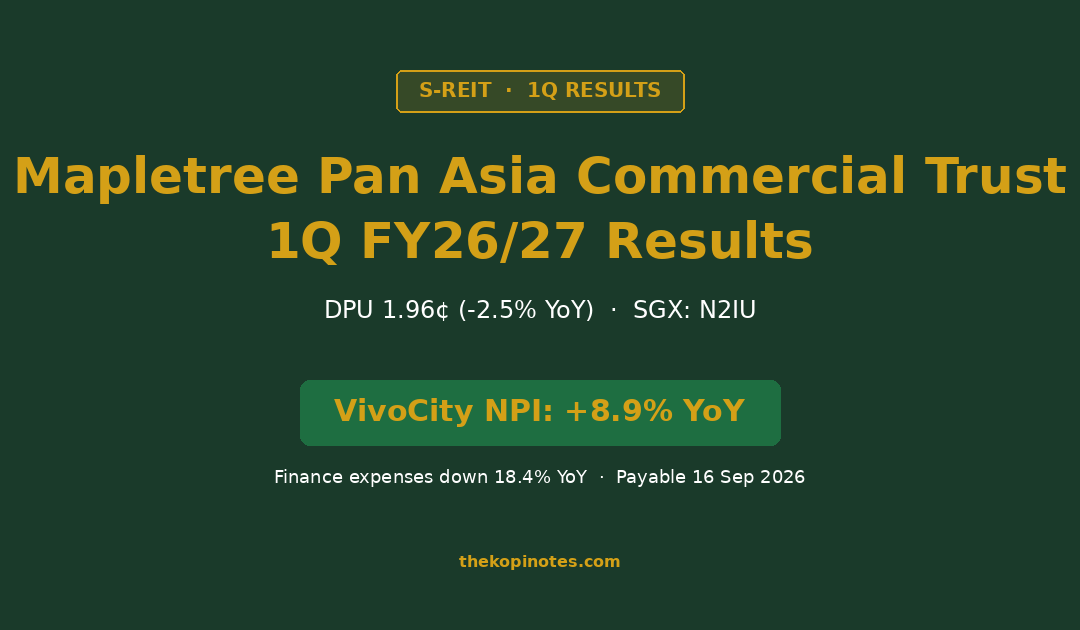
Mapletree Pan Asia Commercial Trust (SGX: N2IU) reported 1Q FY26/27 DPU of 1.96 cents, down 2.5% year-on-year, as softer overseas contributions and forex headwinds outweighed a strong VivoCity performance. Gross revenue fell 5.6% and net property income fell 6.8%, but finance expenses dropped 18.4%, cushioning the bottom line. The distribution is payable 16 September 2026.
Not financial advice. All figures are for educational reference only. Data as at 31 July 2026 unless noted.
- DPU came in at 1.96 cents, down 2.5% year-on-year. Ex-date is 6 August, paid 16 September 2026.
- VivoCity’s NPI grew 8.9% year-on-year and now anchors 66% of total net property income, while overseas assets in China, Hong Kong and Japan dragged on the headline numbers.
- Finance expenses fell 18.4%, cushioning the DPU decline — at S$1.33, MPACT trades around a 23% discount to its S$1.73 net asset value.
Table of Contents
1Q FY26/27 Results at a Glance
MPACT released its 1Q FY26/27 financial results on 30 July 2026, covering the three months to 30 June (April–June 2026). Here’s the headline income statement, compared with the same quarter last year.
| Metric | 1Q FY26/27 | YoY Change |
|---|---|---|
| Gross Revenue | S$206.5m | -5.6% |
| Net Property Income | S$154.8m | -6.8% |
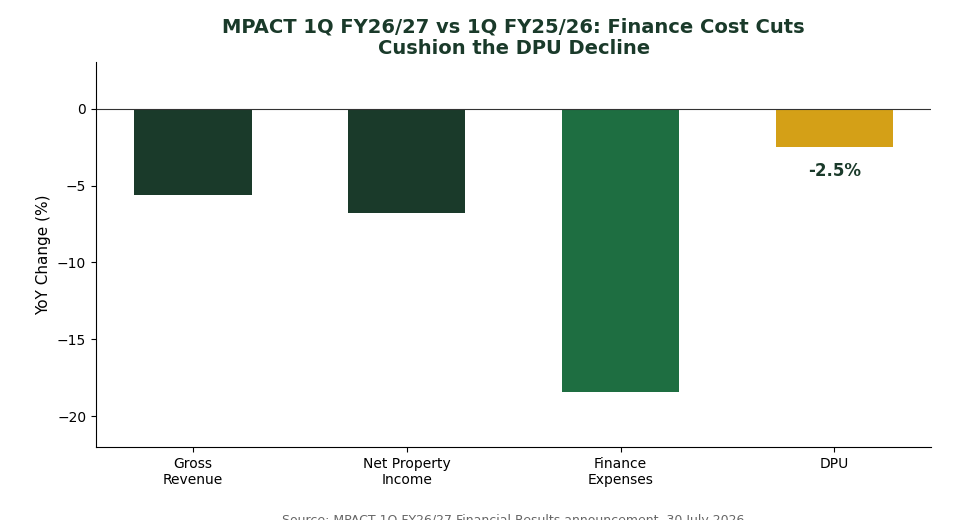
| Finance Expenses | S$40.9m | -18.4% |
| Distribution per Unit (DPU) | 1.96¢ | -2.5% |
Source: MPACT 1Q FY26/27 Financial Results announcement, 30 July 2026
Revenue and net property income (NPI — rental income after property expenses) both fell year-on-year. Two things explain most of the drop: a stronger Singapore dollar against the Hong Kong dollar and Japanese yen, which shrinks overseas income once translated back to SGD, and the absence of contributions from three assets MPACT divested during FY25/26.
Here’s the part that matters most for your payout: finance expenses fell 18.4%, nearly three times faster than revenue declined. That gap is why DPU only slipped 2.5% instead of tracking the steeper drop in NPI.
VivoCity Carries the Portfolio
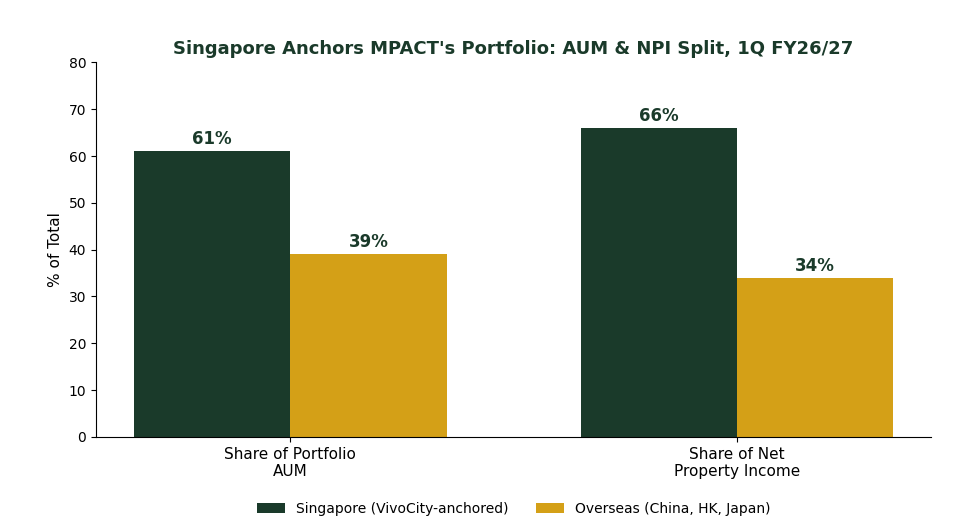
If you own MPACT units, VivoCity is doing most of the heavy lifting right now. Singapore assets — anchored by VivoCity — made up 61% of MPACT’s S$15.2 billion in assets under management (AUM) and contributed 66% of total NPI this quarter.
VivoCity’s net property income grew 8.9% year-on-year, with tenant sales up 4.9% and shopper traffic up 5.0%. That’s a genuinely strong mall performance in a year when many retail landlords are dealing with softer discretionary spending.
Management credits ongoing operational enhancements — space reconfiguration, exclusive tenant collaborations, and shopper engagement campaigns — for keeping VivoCity’s momentum going. It’s a reminder that even in a REIT under macro pressure, active asset management at the property level can still move the needle.
Where the Overseas Drag Came From
MPACT’s overseas assets — in China, Hong Kong (Festival Walk) and Japan (Makuhari and other business park assets) — made up the remaining 39% of AUM and 34% of NPI this quarter, and it’s here that the headwinds showed up.
China and Japan both saw softer leasing demand and negative rental reversions (when a lease renews at a lower rate than before), particularly in business parks and secondary office stock. Hong Kong’s economy actually grew 5.9% year-on-year in 1Q 2026, but new retail supply is pressuring rents and occupancy at Festival Walk.
Currency translation made things worse on paper. A stronger Singapore dollar against the Hong Kong dollar and Japanese yen means the same amount of foreign rental income converts to fewer Singapore dollars when MPACT reports its results — even if the underlying overseas leasing performance hadn’t changed at all.
Singapore’s own economy grew a healthy 5.7% year-on-year in 2Q 2026, but management flagged rising downside risks: Middle East conflicts, higher energy prices, and a tighter retail labour market are all things worth watching over the rest of the financial year.
Capital Management: Cheaper, Longer-Dated Debt
Aggregate leverage — basically how much of MPACT’s total assets are funded by debt rather than equity — stood at 37.7% this quarter. That’s down slightly from 37.9% a year ago, though up 1.2 percentage points from 36.5% last quarter. The quarter-on-quarter rise isn’t from taking on more debt; it’s largely a denominator effect from the overseas asset devaluations covered in the next section — when property values fall, the same debt load represents a bigger share of total assets.
Either way, MPACT sits comfortably below the Monetary Authority of Singapore’s (MAS) 50% gearing limit for S-REITs, which you can verify directly via MAS’s REIT leverage rules. Interest coverage ratio (ICR) — how many times over MPACT’s earnings could cover its interest expense — improved to 3.3x, well above MAS’s uniform 1.5x minimum ICR requirement in force since November 2024.
During the quarter, MPACT redeemed S$250 million in perpetual securities and issued S$200 million in fixed-rate notes due 2033, lowering its weighted average cost of debt to 2.94% per annum. This followed three divestments completed in FY25/26 — TS Ikebukuro, ABAS Shin-Yokohama, and Festival Walk Tower — which reduced transitional downtime and interest expense from non-core assets.
If you want to check gearing and interest coverage yourself for any S-REIT you’re comparing, our S-REIT Gearing Ratio & ICR Calculator does the maths for you.
Asset Revaluations: Singapore Up, Overseas Down
MPACT’s portfolio valuations tell the same Singapore-versus-overseas story as everything else this quarter. Singapore portfolio valuation rose 3.1% year-on-year, led by a 5.4% uplift at VivoCity — a direct reflection of that mall’s strong operating performance.
Overseas portfolio valuation, by contrast, fell 9.2% year-on-year, driven by forex translation and softer market conditions across Greater China and Makuhari. Net asset value (NAV) per unit held steady at S$1.73, unchanged from a year ago, as the Singapore gains roughly offset the overseas declines at the total-portfolio level.
Outlook: The MBC Lease and What’s Next
Management’s chairman statement struck a measured but positive tone: “The disciplined leasing, divestment and debt reduction decisions will continue to reinforce our foundation in a more complex environment… these actions have put MPACT in a stronger position than a year ago to weather uncertainties and pursue opportunities. Singapore remains our anchor through market cycles.”
The single biggest near-term catalyst to watch is a key committed lease at Mapletree Business City (MBC), which management expects to commence later in the financial year and support portfolio income. Beyond that, expect continued portfolio optimisation, with capital deployed prudently to preserve flexibility rather than chasing growth for its own sake.
Should You Buy MPACT Now?
At S$1.33 (31 July 2026), MPACT trades at a price-to-NAV (P/NAV) ratio of roughly 0.77x against its S$1.73 NAV per unit — a 23% discount to book value. Annualising this quarter’s 1.96 cent DPU (simply multiplying by four, which assumes the quarter repeats) works out to a forward yield of about 5.9%. That lines up closely with MPACT’s actual FY25/26 full-year DPU of 7.97 cents, which at today’s price also yields roughly 6.0%.
The case for holding or buying: VivoCity remains a genuinely strong, growing asset that anchors two-thirds of NPI. Finance expenses are falling faster than revenue, cushioning distributions. Leverage sits well within regulatory limits, and the unit trades at a meaningful discount to its own NAV.
The case for caution: headline revenue and NPI are still shrinking, and overseas assets in China, Hong Kong and Japan face genuine structural headwinds — not just a one-off currency blip. A discount to NAV can persist for a long time if the market doesn’t believe the overseas drag will reverse. Do your own diligence rather than buying on the discount alone.
If you’re comparing MPACT against other Mapletree REITs’ recent results, see our coverage of Mapletree Industrial Trust’s 1Q FY26/27 results and Mapletree Logistics Trust’s 1Q FY26/27 results, or check MPACT’s full dividend and DPU history for the longer-term track record.
Track Your REIT Income Alongside Your Retirement Plan
REIT distributions like MPACT’s are one building block of a Singapore passive income plan. If you’re building toward retirement, it helps to see how dividend income fits into the bigger picture with our Singapore retirement calculator.
If you’re funding new REIT positions and want to compare brokers, TKN readers can check the Syfe referral code and sign-up bonus for current promotions.
Frequently Asked Questions
What was MPACT's 1Q FY26/27 DPU?
MPACT’s distribution per unit (DPU) for 1Q FY26/27 was 1.96 cents, down 2.5% from 2.01 cents in 1Q FY25/26 and also down 2.5% from 2.01 cents the prior quarter (4Q FY25/26).
When is the MPACT 1Q FY26/27 dividend paid?
The distribution has an ex-date of 6 August 2026, with payment on 16 September 2026.
Why did MPACT's DPU fall if VivoCity performed well?
VivoCity’s net property income grew 8.9% year-on-year, but it only makes up part of MPACT’s portfolio. Overseas assets in China, Hong Kong and Japan saw softer leasing demand, negative rental reversions, and currency translation losses from a stronger Singapore dollar — and those overseas headwinds outweighed VivoCity’s gains at the total-portfolio level.
What is MPACT's gearing ratio?
Aggregate leverage stood at 37.7% as at 1Q FY26/27, down slightly from 37.9% a year earlier but up from 36.5% last quarter. This remains well within MAS’s 50% regulatory limit for S-REITs. Interest coverage ratio improved to 3.3x, above MAS’s 1.5x minimum requirement.
What is MPACT's dividend yield?
Annualising the 1Q FY26/27 DPU of 1.96 cents against MPACT’s S$1.33 unit price (31 July 2026) works out to roughly 5.9%. This is a simple estimate assuming the quarter repeats four times — MPACT’s actual FY25/26 full-year DPU of 7.97 cents yields a similar ~6.0% at the same price. Yields move with the unit price, so check the current price before relying on this figure.
What is MPACT's P/NAV ratio?
At S$1.33 against a net asset value (NAV) of S$1.73 per unit, MPACT trades at a price-to-NAV ratio of roughly 0.77x — about a 23% discount to book value.
What percentage of MPACT's income comes from Singapore?
Singapore assets, anchored by VivoCity, contributed 61% of MPACT’s S$15.2 billion in assets under management and 66% of net property income in 1Q FY26/27. The remaining share comes from overseas assets in China, Hong Kong and Japan.
What debt actions did MPACT take this quarter?
MPACT redeemed S$250 million in perpetual securities and issued S$200 million in fixed-rate notes due 2033, lowering its weighted average cost of debt to 2.94% per annum and extending its debt maturity profile.
Is MPACT a buy in 2026?
MPACT trades at a meaningful discount to NAV with a stable, growing Singapore anchor asset in VivoCity, falling finance costs, and leverage well within regulatory limits. However, headline revenue and NPI are still shrinking due to genuine overseas headwinds, not just a one-off currency effect — weigh this against your own risk appetite rather than treating the NAV discount alone as a buy signal. This isn’t personalised investment advice.
This article was researched with the help of AI. While we strive to keep all information accurate and up to date, there may be errors. If you notice any discrepancies, please contact us.