Frasers Centrepoint Trust Share Price 2026 (SGX: J69U): Post-FOMC Rate Hike Impact on Singapore’s Top Suburban Retail REIT
Published: 18 September 2026 | 8 min read
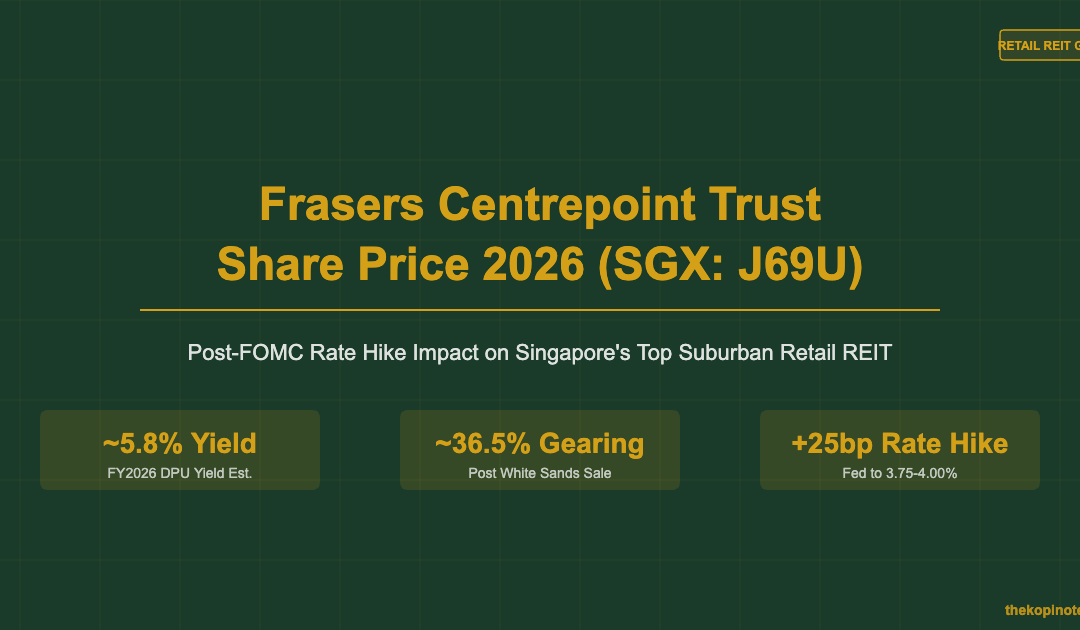
Frasers Centrepoint Trust (SGX: J69U) is Singapore’s largest pure-play suburban retail REIT, owning 10 malls anchored by essential-services tenants including FairPrice, Cold Storage, and healthcare clinics. After the US Federal Reserve hiked rates by 25 basis points to 3.75–4.00% on 17 September 2026, FCT faces higher borrowing costs — but its ~75% fixed-rate debt hedge and resilient suburban occupancy above 98% provide meaningful insulation. Here is what the rate hike means for your FCT units.
Not financial advice. All figures are for educational reference only. Data as at September 2026 unless noted.
- FCT’s ~75% fixed/hedged debt means the Sep 2026 rate hike has a limited near-term DPU impact — roughly 0.1–0.15 cents per unit on unhedged floating debt.
- Suburban retail is defensive — necessity-driven tenants like supermarkets and clinics maintain high occupancy even in rate-hike cycles.
- The White Sands S$467m divestment lowered gearing to ~36.5%, giving FCT balance sheet room. Use our Singapore retirement calculator to model how FCT fits into your income plan.
Table of Contents
Show Contents
What Is Frasers Centrepoint Trust?
Frasers Centrepoint Trust (FCT) is a Singapore-listed REIT that owns and manages suburban shopping malls across the island. Sponsored by Frasers Property, FCT focuses on necessity-driven retail — the kind of spending that keeps happening regardless of rate cycles. Think groceries, medical clinics, childcare, and F&B.
Here is a quick snapshot of FCT’s key metrics as at September 2026:
| Metric | Value |
|---|---|
| SGX Code | J69U |
| Sector | Suburban Retail REIT |
| Number of Malls | 10 Singapore suburban malls |
| Portfolio Occupancy | ~98.2% (Aug 2026) |
| Aggregate Leverage (Gearing) | ~36.5% (post White Sands divestment) |
| Annualised DPU (FY2026 est.) | ~11.48 cents per unit |
| Distribution Frequency | Semi-annual |
| Debt Hedged / Fixed Rate | ~75% |
Source: Frasers Centrepoint Trust SGX filings, Q3 FY2026 update. Data as at September 2026.
FCT’s portfolio includes Causeway Point (its largest and most valuable asset), Northpoint City North Wing, Waterway Point, Tampines 1, Hougang Mall, Tiong Bahru Plaza, Changi City Point, and interests in Nex and Heartland Mall via the AsiaRetail Fund. This suburban concentration is both FCT’s strength and its distinctive identity among Singapore REITs.
For a broader look at the best income-generating REITs in Singapore, see our guide to the best S-REITs in Singapore 2026.
FCT Share Price Performance in 2026
FCT’s share price has faced headwinds in 2026 as markets repriced Singapore REITs ahead of the September FOMC meeting. The unit price traded in a S$2.05–S$2.35 range during the first half of 2026, pressured by the broader S-REIT sell-down that followed rising US Treasury yields.
The White Sands divestment in mid-2026 was a net positive for FCT’s balance sheet — but the sale of a near-maturity asset at S$467m reduced near-term distributable income slightly. Longer-term, the capital recycling positions FCT to acquire higher-yielding suburban assets.
Despite short-term pressure, FCT’s relative performance against other S-REITs has been resilient. Suburban retail with essential-service anchors tends to outperform in periods of economic uncertainty — when consumers cut discretionary spending but continue buying groceries and visiting clinics.
To build passive income from Singapore REITs, explore our comprehensive guide on passive income Singapore 2026.
Post-FOMC Rate Hike: Impact on FCT
The Federal Reserve hiked rates by 25 basis points on 17 September 2026, bringing the federal funds rate to 3.75–4.00%. This is the first Fed rate hike in three years and it has direct implications for Singapore REITs that borrow in SGD — because SGD interest rates typically follow US rates with a lag through SORA (Singapore Overnight Rate Average).
Here is how the rate hike flows through to FCT specifically:
1. Borrowing Cost Impact
FCT has approximately ~75% of its debt on fixed rates or hedged via interest rate swaps. That means only ~25% of its total borrowings are exposed to floating rate movements. With total debt of approximately S$2.1 billion, the floating rate portion is roughly S$525 million. A 25bp increase on that amount costs FCT approximately S$1.3 million per year in additional interest — translating to roughly 0.1–0.15 cents per unit of DPU drag annually. This is manageable.
2. Refinancing Risk
FCT’s debt maturity profile is reasonably well-staggered. Post White Sands divestment, gearing fell to ~36.5% — below the MAS 50% regulatory limit and well below FCT’s own internal ceiling. The buffer gives FCT room to refinance maturing debt without forced asset sales. For comparison, Suntec REIT carries gearing above 43%, making it materially more rate-sensitive than FCT.
3. Cap Rate Re-rating Risk
Higher interest rates push up the risk-free rate, which typically widens cap rates (lowers asset values) for property REITs. For FCT, the key risk is that suburban mall valuations could drift lower in the 2026 year-end independent valuations. However, FCT’s strong occupancy and necessity-retail positioning should support valuations better than discretionary or office-heavy REITs.
4. Unit Price Sensitivity
In rate-hike cycles, higher-yielding alternatives like Singapore T-Bills and Singapore Savings Bonds become more attractive to income investors. You can compare these options in our Singapore T-bills 2026 guide. FCT’s yield of ~5.8% needs to remain sufficiently above the risk-free rate to justify the equity-risk premium.
FCT DPU History and 2026 Outlook
FCT distributes income semi-annually, with the financial year ending on 30 September. Distribution Per Unit (DPU) — essentially how much cash each REIT unit pays you per half-year — has been broadly stable over the past four years, hovering around 5.7–6.2 cents per half-year period.
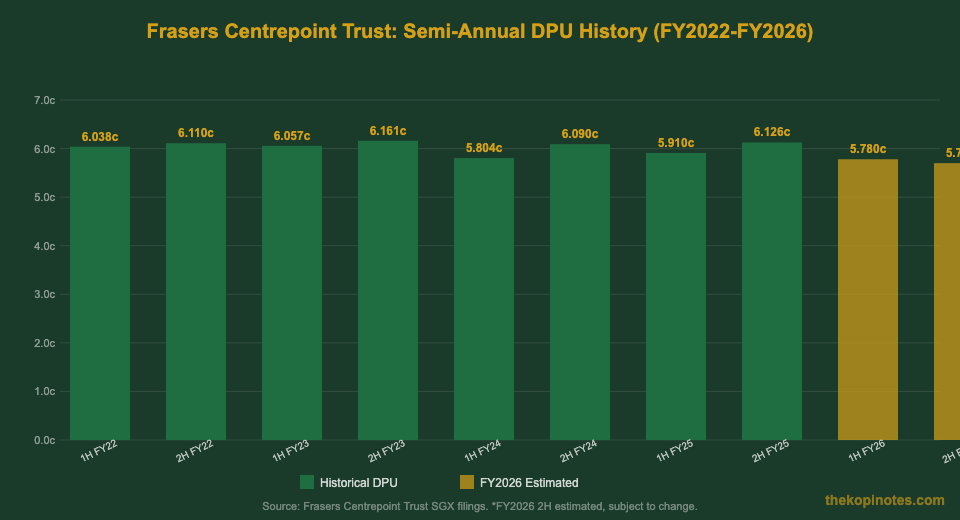
The DPU dipped slightly in 1H FY2024 and 1H FY2026 due to the completion of the White Sands divestment and associated income vacuum. However, the longer-term DPU trajectory has remained within a stable ~11.5–12.1 cents per year range.
For FY2026, consensus estimates point to annualised DPU of approximately 11.48 cents per unit, implying a forward yield of approximately 5.7–5.9% at current share prices around S$2.00–S$2.10. This compares favourably to the 10-year Singapore Government Securities (SGS) yield of approximately 3.3–3.5% in September 2026, offering an equity-risk premium of roughly 230–260 basis points.
The post-FOMC rate hike adds perhaps 0.1–0.15 cents of annualised DPU pressure from higher floating-rate interest costs. The net effect is manageable for a REIT with FCT’s balance sheet strength.
Portfolio Deep Dive: 10 Suburban Malls
FCT’s strength lies in its portfolio of suburban Singapore malls — all of them embedded within or adjacent to HDB residential estates. This positioning makes them daily-necessity destinations, not aspirational weekend destinations. Customers go there because it is convenient, not because it is exciting.
| Mall | Location | GFA (sqm) | Occupancy |
|---|---|---|---|
| Causeway Point | Woodlands | 51,488 | ~99% |
| Northpoint City North Wing | Yishun | 48,578 | ~98% |
| Waterway Point | Punggol | 44,000 | ~99% |
| Tampines 1 | Tampines | 34,434 | ~97% |
| Hougang Mall | Hougang | 13,880 | ~99% |
| Tiong Bahru Plaza | Tiong Bahru | 24,000 | ~98% |
| Changi City Point | Changi Business Park | 24,678 | ~97% |
| Nex (via ARF, 25.5%) | Serangoon | 55,600 | ~98% |
Source: Frasers Centrepoint Trust annual report and SGX announcements. GFA = Gross Floor Area. Data as at FY2026.
The divestment of White Sands in 2026 was strategically sound — it was an older, smaller suburban mall with lower NPI yield relative to FCT’s larger flagship assets. The proceeds allowed FCT to reduce gearing and put itself in a stronger position to pursue future acquisitions or development projects from the Frasers Property pipeline. FCT’s recent announcement about renewing mall management agreements to 2031 signals operational continuity and long-term sponsor commitment.
Gearing and Debt Management
After the White Sands divestment, FCT’s aggregate leverage (gearing) fell to approximately 36.5%. This is a meaningful improvement from the 38%+ levels prior to the sale. Here is why this matters in a rate-hike environment:
Lower gearing reduces FCT’s sensitivity to rising interest costs. It also increases the headroom to the MAS 50% leverage limit — giving FCT the flexibility to make acquisitions or weather portfolio devaluations without being forced into dilutive rights issues.
FCT’s interest coverage ratio (ICR) — which measures how comfortably it can service its debt from operating income — remains well above the MAS minimum threshold of 1.5x. With strong suburban occupancy and rental reversions running positive in recent quarters, FCT’s income stream is reliable enough to service its debt obligations even with the post-FOMC rate increase.
The ~75% fixed/hedged debt proportion means FCT has locked in rates on the bulk of its borrowings. Most of those hedges were executed when rates were lower, so FCT is temporarily insulated from the full market-rate increase. However, as hedges roll off over the next 12–24 months, FCT will gradually face higher refinancing costs if rates remain elevated.
Investors who want to compare this dynamic across income products — REITs versus Singapore T-bills versus fixed deposits — will find our Singapore T-bills 2026 guide a useful reference. And if you want to model how REIT distributions fit into your retirement income, try our Singapore retirement planning calculator.
FCT vs Peers: Rate Sensitivity Comparison
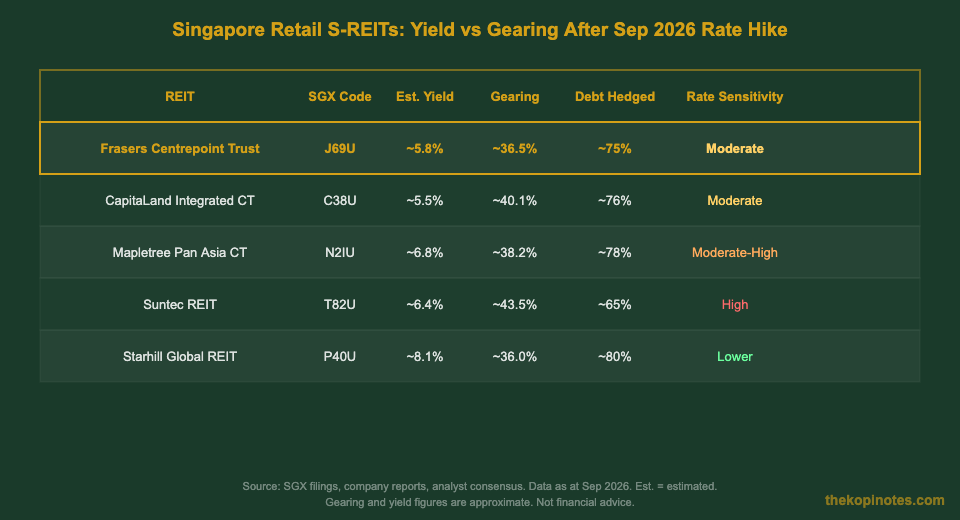
Not all Singapore retail REITs are equally exposed to interest rate increases. The comparison below shows FCT alongside four other retail/commercial S-REITs after the September 2026 rate hike:
Key takeaways from the peer comparison:
FCT’s combination of ~36.5% gearing (below sector average) and ~75% fixed/hedged debt makes it one of the least rate-sensitive Singapore retail REITs. Suntec REIT, with over 43% gearing and only ~65% hedged, faces meaningfully higher exposure. MPACT (N2IU) has Japan FX risk on top of its interest rate exposure, creating a more complex picture.
FCT’s yield of ~5.8% is lower than Suntec or MPACT in absolute terms — but this reflects FCT’s lower risk profile. You are accepting a lower headline yield in exchange for more stable distributions and a stronger balance sheet. For conservative income investors, this trade-off often makes sense.
Valuation: P/NAV and Yield Spread
Two key valuation metrics matter for FCT in the current rate environment:
Price-to-NAV (P/NAV): FCT typically trades at a modest premium or discount to its Net Asset Value per unit. Post-FOMC, if the year-end independent valuation marks down FCT’s suburban malls by 2–3%, NAV per unit could fall from approximately S$2.30 to around S$2.22–S$2.25. At a share price of S$2.00–S$2.10, FCT would be trading at a discount to NAV of approximately 6–9% — which historically has been a reasonable entry point for long-term investors.
Yield Spread vs Risk-Free Rate: With the 10-year SGS yielding approximately 3.3–3.5% and FCT offering ~5.8%, the yield spread is approximately 230–260 basis points. This spread compressed from the 300bp+ range seen in 2024, reflecting the rate-hike environment. However, a 230bp spread remains above the historical average of ~180–200bp for FCT, suggesting the unit price may already reflect a fair degree of rate-hike pessimism.
The 3QFY2026 announcement about the White Sands divestment marked a capital-recycling milestone that improved FCT’s balance sheet. The next catalyst is likely the FY2026 full-year results (November 2026) and any announcement of new acquisitions from the Frasers Property Singapore pipeline.
Frequently Asked Questions
How does the Sep 2026 Fed rate hike affect FCT's DPU?
Is FCT a good buy after the rate hike?
What is FCT's gearing after the White Sands sale?
How often does FCT pay distributions?
What are FCT's main malls?
How does FCT compare to CICT for income investors?
This article was researched with the help of AI. While we strive to keep all information accurate and up to date, there may be errors. If you notice any discrepancies, please contact us.