STI ETF at Record Highs 2026: Should You Still Buy ES3 or G3B?
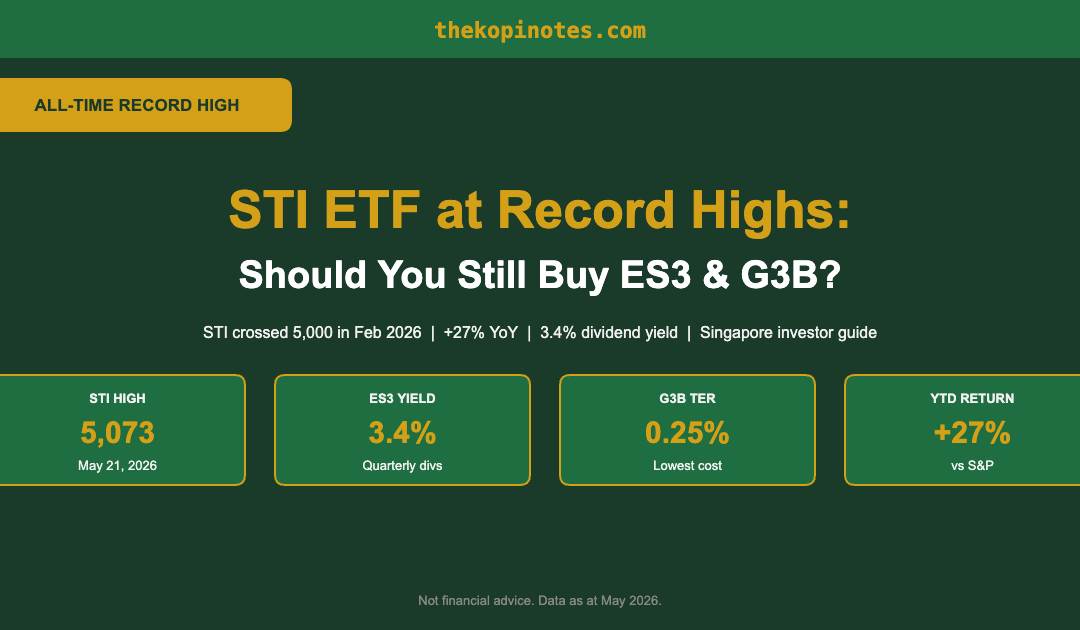
The Straits Times Index crossed 5,000 for the first time in February 2026 and hit an all-time high of 5,073 in May — up 27% year-on-year. If you missed the rally, here is what Singapore investors need to know about ES3 and G3B right now.
Not financial advice. All data as at May 2026. Past performance does not guarantee future results.
After a decade of underperformance, Singapore’s benchmark index is having its moment. The STI’s 27% one-year gain has prompted fresh interest in the two SGX-listed ETFs that track it: ES3 (SPDR Straits Times Index ETF) and G3B (Amova Singapore STI ETF). Whether you are a first-time investor or a seasoned dividend hunter, this guide breaks down everything you need to know.
Table of Contents
STI Record High 2026: What Happened?
The Straits Times Index (STI) breached the 5,000 psychological level on 12 February 2026, closing at 5,016 — a milestone the index had never reached in its history. By 21 May 2026, the index set a fresh all-time intraday high of 5,073.11 points. As at 28 May 2026, the STI trades near 4,989, still just 1.7% below the record.
Three forces drove the rally:
- Singapore’s three banks (DBS, OCBC, UOB) collectively make up over 50% of the STI. All three posted resilient Q1 2026 earnings — OCBC net profit grew 5% YoY, DBS AUM hit a record S$492 billion — even as net interest margins moderate from their 2023–2024 peaks.
- Singapore’s GDP revised to 6% in Q1 2026, driven by AI-related electronics demand. Enterprise Singapore raised its 2026 non-oil domestic exports (NODX) forecast to +3–5%.
- Global rotation into defensive, dividend-paying markets — with the S&P 500 flat year-to-date in 2026, investors seeking yield and stability turned to Singapore’s banks and S-REITs, which feature prominently in the STI.
The result: the STI delivered approximately 27% total return over the 12 months to May 2026 — outpacing most developed markets by a wide margin.

What Is the STI ETF?
The STI ETF is an exchange-traded fund listed on the SGX that passively tracks the Straits Times Index — a market-cap-weighted benchmark of the 30 largest and most liquid companies on the Singapore Exchange.
The index is dominated by Singapore’s banking sector, with DBS, OCBC, and UOB together accounting for roughly 50–55% of its weight. The remainder includes S-REITs such as CapitaLand Integrated Commercial Trust (CICT) and Mapletree Logistics Trust (MLT), telcos like Singtel, industrials such as Keppel and ST Engineering, and diversified conglomerates.
What makes the STI ETF attractive to Singapore investors:
- Instant diversification across 30 blue-chip Singapore companies in a single trade
- Low cost — TER of just 0.25–0.30% per year versus 1–2% for unit trusts
- CPF and SRS eligible — both ES3 and G3B can be purchased using CPF Ordinary Account funds under the CPF Investment Scheme (CPFIS)
- SGD-denominated — no currency risk for Singapore investors
- Dividend income — quarterly or semi-annual cash distributions from the index’s 30 constituent companies
ES3 vs G3B: Which STI ETF Is Better?
There are two main STI ETFs listed on the SGX. Here is how they compare as at May 2026:
| Feature | ES3 — SPDR STI ETF | G3B — Amova STI ETF |
|---|---|---|
| Manager | State Street Global Advisors | Amova Asset Management |
| TER (annual fee) | 0.30% | 0.25% ✅ Lower |
| AUM | ~S$1.3 billion ✅ Larger | ~S$600 million |
| Dividend frequency | Quarterly ✅ More frequent | Semi-annual |
| Dividend yield (2026) | ~3.4% | ~3.5% ✅ Slightly higher |
| CPF-OA eligible? | Yes (CPFIS) | Yes (CPFIS) |
| Inception | 2002 ✅ Longer track record | 2009 |
| Benchmark change 2026 | Shifting to Total Return from 22 Jun 2026 ✅ | No change announced |
| Bid-ask spread | Tighter (higher liquidity) | Slightly wider |
Our verdict: For most Singapore investors, ES3 remains the default choice — larger AUM, tighter spreads, and quarterly dividend payments. G3B has a marginally lower TER (0.25% vs 0.30%) and suits those who prioritise cost over dividend frequency. Both track the same index and will deliver nearly identical long-term returns.

STI ETF Dividend Yield 2026
With the STI at record highs, the dividend yield has compressed slightly from its long-term average of ~4.0% to around 3.4–3.9%. Here is the current income picture:
| ETF | Last Dividend | Ex-Date | Next Dividend (est.) | Approx. Yield |
|---|---|---|---|---|
| ES3 | S$0.085/unit | 11 Feb 2026 | S$0.090/unit (12 Aug 2026) | ~3.4% |
| G3B | S$0.0932/unit | 2 Jan 2026 | ~Mid 2026 | ~3.5% |
Singapore’s three banks are the primary dividend contributors. Even as net interest margins moderate from 2024 highs, DBS, OCBC, and UOB maintained or grew dividends in Q1 2026 — supported by strong wealth management fee income and resilient loan quality. S-REITs within the STI (CICT, MLT) provide an additional dividend buffer should bank payouts soften.
For S$100,000 invested in ES3, the annualised dividend income at 3.4% is approximately S$3,400 per year, paid in roughly S$850 quarterly instalments — consistently beating the CPF Ordinary Account rate of 2.5%.
ES3 Benchmark Change June 2026 — What It Means
In a notable governance update, State Street Global Advisors announced that ES3 will shift its official benchmark from the STI Price Return to the STI Total Return effective 22 June 2026. This is a positive development:
- Price Return benchmark — measures capital gains only, excluding dividend reinvestment
- Total Return benchmark — includes dividends reinvested, reflecting actual investor experience
The change does not alter ES3’s investment universe, constituent composition, or security weightings. What changes is how ES3’s performance is measured and reported. Alongside this, ES3 gains the ability to use equity futures contracts for efficient portfolio management — reducing cash drag between dividend payment dates and improving tracking accuracy.
In plain English: ES3 is modernising to better reflect what investors actually earn. It is a modest but positive signal about the fund’s governance quality.
Should You Buy STI ETF at Record Highs?
The honest answer: it depends on your time horizon and strategy. Here is a framework:
| Investor Type | Recommendation | Rationale |
|---|---|---|
| New investor, 20–30yr horizon | Buy now via DCA | Time in market > timing the market. Monthly DCA smooths entry points. |
| Income investor seeking 3–4% yield | Buy, but diversify | ES3’s 3.4% yield beats CPF OA (2.5%) and is competitive with S-REITs. |
| Tactical investor, 1–3yr horizon | Wait or DCA slowly | Bank NIM headwinds and 27% premium to last year limit near-term upside. |
| CPF/SRS investor | Strong buy | Idle CPF OA at 2.5% vs STI ETF historical returns — DCA wins over 10+ years. |
The case against buying at all-time highs: Bank net interest margins are compressing as global central banks ease rates. UOB reported weaker Q1 2026 earnings YoY. The STI’s ~50% bank concentration makes it sensitive to rate decisions.
The case for investing now: Singapore’s economic fundamentals are solid (6% GDP growth in Q1 2026), dividend yields remain attractive, and the STI has consistently outperformed global benchmarks in 2024–2026 with lower volatility than the S&P 500.
Our view: Dollar-cost averaging (DCA) into ES3 or G3B over 6–12 months is the most rational approach for long-term investors. Avoid a lump-sum entry at all-time highs unless deploying CPF OA funds that would otherwise earn just 2.5%. Use our DCA Investment Calculator to model your scenario.
How to Buy STI ETF in Singapore (CPF & SRS)
STI ETFs trade on the SGX like regular stocks. You need a brokerage account and a CDP securities account. The most cost-effective platforms for Singapore investors:
- FSMOne — SGD 8.80 min commission, CDP-linked, use referral code P0544985
- Syfe Trade — commission-free Singapore stock trading including ES3 and G3B, referral code TKNSG
- Endowus — offers STI ETF exposure via CPF and SRS through its fund platform, S$20 fee credit available
Buying with CPF OA: Both ES3 and G3B are CPFIS-OA eligible. Contact your CPF-linked broker to purchase units using your OA balance. CPFIS rules: retain at least S$20,000 in OA before investing, and limit equity/ETF exposure to 35% of investible savings. For a full guide, see our CPF Investment Strategy guide.
Buying with SRS: Both ETFs can be purchased through SRS accounts at DBS, OCBC, or UOB. SRS contributions reduce your taxable income — use our SRS Tax Savings Calculator to estimate your savings.
Risks of Investing in STI ETF at Record Highs
- Bank concentration risk — DBS, OCBC, UOB make up ~50% of the STI. Any banking sector headwind hits the ETF disproportionately.
- Interest rate sensitivity — as global rates normalise, bank net interest margins compress, pressuring earnings and potentially dividends.
- Single-market concentration — unlike global ETFs such as CSPX or Singapore REIT ETFs, the STI covers only Singapore — geographic concentration increases volatility risk.
- Valuation risk — at 5,073, the STI trades above its 5-year historical average P/E. This doesn’t predict a fall, but it limits the margin of safety for new entrants.
For a diversified income approach pairing STI ETF with S-REITs and dividend stocks, see our Best S-REITs Singapore 2026 guide and our comprehensive SPDR STI ETF Guide.
Start Building Your Singapore ETF Portfolio Today
Compare platforms and invest in STI ETFs using cash, CPF OA, or SRS funds.
Frequently Asked Questions
What is the STI ETF record high in 2026?
Is it too late to buy the STI ETF after the record high?
What is the difference between ES3 and G3B?
What is the dividend yield of the STI ETF in 2026?
Can I buy the STI ETF with my CPF?
What is the TER of the STI ETFs?
Why did the STI hit a record high in 2026?
What is the ES3 total return benchmark change in June 2026?
Is the STI ETF better than the S&P 500 ETF?
This article was researched with the help of AI. While we strive to keep all information accurate and up to date, there may be errors. If you notice any discrepancies, please contact us.