Endowus Fund Performance Review 2026: Flagship Portfolios vs the Market Benchmark
Digital Banks · October 2026
Endowus publishes a monthly performance review for its Flagship portfolios, and in 2026 the 100% Equity Portfolio has mostly tracked or modestly beaten its global equity benchmark (outperforming in January, February and Q1, roughly in line in May, and trailing slightly in April and July). But headline returns exclude the Endowus advisory fee of 0.15% to 0.60% p.a., which varies by account source and size. Here is what the numbers actually show, and how to read them before you invest.
Not financial advice. All figures are for educational reference only. Data as at October 2026 unless noted.
In This Review
Contents
- How Endowus Reports Fund Performance
- 2026 Monthly Performance: Flagship Equity vs Benchmark
- Fee Drag: How Much of Your Return Endowus Keeps
- Cash Smart vs Flagship: Which Portfolio for Which Goal
- CPF OA/SA and SRS-Specific Considerations
- How to Read a Performance Review Before You Invest
- Endowus vs Syfe vs FSMOne: Where Performance Stands Out
- Frequently Asked Questions
How Endowus Reports Fund Performance
Endowus publishes a monthly Portfolio Performance Review on its Insights page, breaking down how each Flagship model portfolio performed against a comparable benchmark. A Singapore investor with S$50,000 in the Flagship 100% Equity Portfolio can check these reviews to see, in plain percentage terms, whether the underlying funds Endowus selected (mostly Dimensional and low-cost index funds) are earning their keep versus simply buying a broad global equity index fund directly.
Two things matter when reading these reviews. First, the published monthly return is the fund-level return — it already reflects the fund managers’ own fees (the Total Expense Ratio, or TER) baked into the fund’s net asset value, but it does not subtract the separate Endowus advisory fee charged on top. Second, “benchmark” at Endowus usually means a broad global equity index (an MSCI World or similar composite), not a Singapore-specific index like the Straits Times Index — so the comparison tells you about global diversification skill, not local market timing.
For context on how CPF and SRS funds fit into this picture, see our SRS Account Singapore complete guide before committing a lump sum.
2026 Monthly Performance: Flagship Equity vs Benchmark
Here is how the Endowus Core Flagship 100% Equity Portfolio compared with its global equity benchmark across the months Endowus has published reviews for in 2026:
| Month (2026) | Flagship 100% Equity | Global Equity Benchmark | Result |
|---|---|---|---|
| January | +2.3% | +1.8% | Outperformed |
| February | +1.7% | +1.3% | Outperformed |
| Q1 (cumulative) | −1.2% | −2.6% | Outperformed |
| April | +8.4% | +8.7% | Underperformed |
| May | +5.1% | +5.1% | In line |
| July | −1.2% | −1.0% | Underperformed |
Source: Endowus monthly and Q1 2026 Portfolio Performance Reviews, endowus.com/insights.
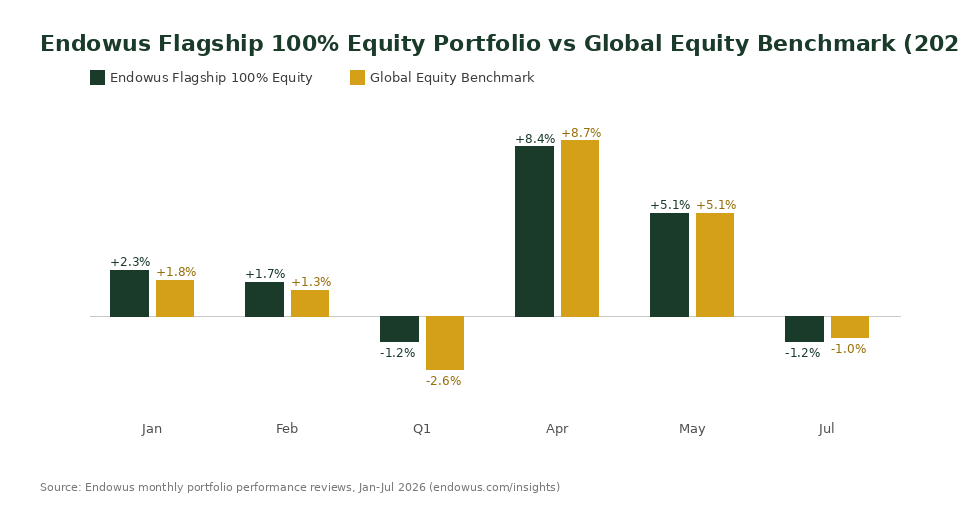
The pattern across six published months: Endowus beat its benchmark three times, matched it once, and trailed it twice — by small margins each time (0.2 to 0.5 percentage points). This is consistent with what you would expect from a portfolio built on evidence-based factor investing (Dimensional funds tilt toward value, size and profitability factors) rather than an attempt to time the market. It is not a case for or against Endowus on its own; it simply shows the fund-selection layer is doing roughly what a diversified, factor-tilted global equity allocation should do — tracking closely, with modest deviation in either direction.
Fee Drag: How Much of Your Return Endowus Keeps
The published fund-level return is not what lands in your account. Endowus charges its own advisory fee on top, ranging from 0.15% to 0.60% p.a. depending on the investment objective, the source of funds (Cash, CPF or SRS), and your total assets under advice (AUA). A Singapore investor holding S$30,000 in a CPF OA Multi-fund portfolio at the 0.40% flat tier pays roughly S$120 a year in advisory fees alone, on top of the underlying funds’ own TER (typically 0.07% to 0.20% for the index-tracking building blocks Endowus uses).
| Account / Portfolio Type | Endowus Advisory Fee (p.a.) |
|---|---|
| Cash — Core/Satellite Flagship | 0.25% |
| CPF OA/SA — Multi-fund portfolio | 0.40% flat |
| CPF OA/SA — Single-fund portfolio | 0.30% flat |
| SRS — Multi-fund portfolio | 0.40% flat |
| Cash Smart (Secure/Enhanced/Ultra) | 0.15% (already reflected in the quoted net yield) |
Source: Endowus pricing page, endowus.com/pricing, as at October 2026. Fees step down at higher AUA tiers; excludes underlying fund-level TER.
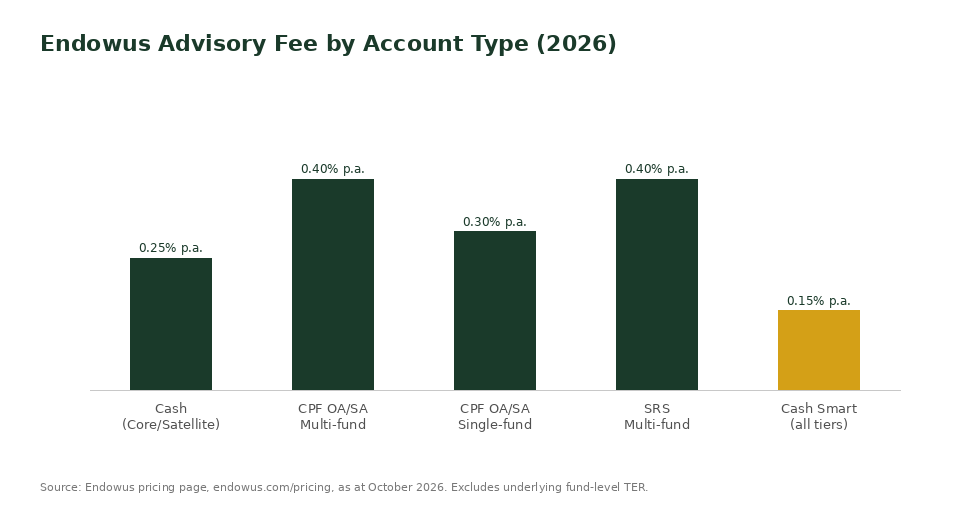
Cash Smart is the cheapest wrapper at 0.15% because it holds mostly money-market and short-duration bond funds rather than equities, and the fee is already netted into the published yield (1.2% to 2.4% p.a. as at October 2026 across Secure, Enhanced and Ultra). For a full breakdown of those yields, see our Endowus Cash Smart Singapore 2026 review.
Cash Smart vs Flagship: Which Portfolio for Which Goal
The performance review numbers above only apply to the Flagship equity portfolios — they say nothing about whether Cash Smart or Flagship is the right starting point for your money. The two serve different jobs:
- Cash Smart is for money you need within 6 to 24 months — an emergency fund, a house deposit, or short-term CPF/SRS parking. It targets capital stability over growth, with net yields of 1.2% (Secure) to 2.4% p.a. (Ultra) as at October 2026.
- Flagship portfolios are for money with a 5+ year horizon where you can tolerate drawdowns. The 100% Equity option is the highest-volatility, highest-expected-return tier; Endowus also offers blended equity/bond allocations (e.g. 80/20, 60/40) for investors who want less variance.
A Singapore investor in their 30s saving for retirement 25+ years out would typically sit in a higher-equity Flagship allocation inside their SRS or CPF OA, while keeping 6 months of expenses in Cash Smart Secure outside any investment account. Mixing the two based on time horizon — not performance-chasing month to month — is the core discipline the monthly reviews are meant to support, not replace.
CPF OA/SA and SRS-Specific Considerations
Endowus’s ability to invest CPF Ordinary Account, CPF Special Account, and SRS monies — not just cash — is one of its most-cited advantages over competitors like Syfe and FSMOne, which have more limited CPF support. But the performance numbers need an extra layer of context inside these wrappers:
CPF OA money currently earns a guaranteed 2.5% p.a. (subject to CPF Board revision) if left untouched. Moving it into a Flagship equity portfolio only makes sense if you have genuine conviction in beating that floor over your investment horizon, net of the 0.30%–0.40% advisory fee shown above — the CPF Investment Scheme rules also cap how much OA you can invest and require a minimum balance be retained. See our Endowus CPFIS 2026 CPF OA guide for the exact caps.
SRS contributions already carry a tax-relief benefit at the point of contribution (dollar-for-dollar reduction in chargeable income, subject to the S$15,300 annual cap for Singapore Citizens and PRs), so the investment return inside SRS is effectively a bonus on top of the relief already banked — this materially changes the “is it worth it” calculation compared to judging Flagship performance on a standalone cash basis.
How to Read a Performance Review Before You Invest
Four checks worth running on any robo-advisor performance review, Endowus included, before treating a good month (or bad month) as a signal:
- Check the time horizon. A single month of outperformance or underperformance is statistical noise. Look at rolling 12-month and since-inception figures where available, not the latest print in isolation.
- Confirm what “benchmark” means. A global equity benchmark is not the same comparison as the Straits Times Index or a single-country ETF — make sure the benchmark matches your own alternative (what would you otherwise have bought?).
- Net out all fees, not just the headline one. Add the Endowus advisory fee to the underlying funds’ TER to get your true all-in cost, then compare that total against a DIY alternative (e.g. buying a global index ETF directly on IBKR).
- Separate the portfolio decision from the platform decision. The 100% Equity allocation itself (not Endowus specifically) is what drives most of the return and volatility. The fee you pay Endowus is for fund selection, CPF/SRS integration, and rebalancing — weigh that against doing it yourself.
Endowus vs Syfe vs FSMOne: Where Performance Stands Out
Endowus, Syfe and FSMOne are not direct substitutes — they differ in what they let you invest (CPF/SRS access), how actively they manage the portfolio, and what you pay for it:
| Platform | CPF/SRS Support | Advisory Fee Range | Approach |
|---|---|---|---|
| Endowus | Cash, CPF OA/SA, SRS | 0.15%–0.60% p.a. | Evidence-based, Dimensional/index funds |
| Syfe | Cash, SRS (limited CPF) | 0.35%–0.65% p.a. | Mixed passive + thematic/REIT income portfolios |
| FSMOne | Cash, CPF OA, SRS | 0% sales charge unit trusts; 0.08% ETF fee (min S$8.80) | Self-directed, broadest fund shelf |
If what you value is a hands-off, fee-transparent, CPF-and-SRS-friendly portfolio with a published monthly scorecard, Endowus’s Flagship range is purpose-built for that. If you want to pick your own unit trusts or ETFs at the lowest possible transaction cost, FSMOne’s self-directed shelf gives more control. You can compare current sign-up terms on our Endowus referral code page, Syfe referral code page, and FSMOne referral code page.
For a broader view of where these platforms fit into a full retirement plan, our Singapore retirement calculator and CPF investment strategy guide walk through sequencing CPF, SRS and cash across platforms.
Open an Endowus Account
New sign-ups can check the current welcome offer on our referral page below.
Endowus Performance: Frequently Asked Questions
Has Endowus beaten the market in 2026?
Across the six months Endowus has published performance reviews for in 2026 (January, February, Q1, April, May and July), the Flagship 100% Equity Portfolio outperformed its global equity benchmark in three, matched it in one, and trailed it in two — by margins of 0.2 to 0.5 percentage points each time. This is not a consistent “beats the market” result; it reflects a factor-tilted portfolio tracking closely to its benchmark, which is the expected outcome for this type of strategy.
Does the Endowus performance review include fees?
The published monthly return reflects fund-level performance (net of the underlying funds’ own TER), but it does not subtract the separate Endowus advisory fee of 0.15% to 0.60% p.a. charged on top, which varies by account source (Cash, CPF or SRS) and your total assets under advice.
How much does Endowus charge for CPF OA investing?
As at October 2026, Endowus charges a flat 0.40% p.a. advisory fee for CPF OA/SA Multi-fund portfolios, or 0.30% p.a. flat for Single-fund portfolios, in addition to the underlying fund’s own expense ratio.
Is Endowus Cash Smart's return the same as the Flagship portfolio's?
No. Cash Smart (Secure, Enhanced, Ultra) invests in money-market and short-duration bond funds targeting capital stability, with net yields of roughly 1.2% to 2.4% p.a. as at October 2026. The Flagship portfolios invest in equity and bond funds with a 5+ year horizon and materially higher expected volatility and return.
What benchmark does Endowus use for its Flagship Equity Portfolio?
Endowus compares its Flagship 100% Equity Portfolio against a broad global equity benchmark (a composite similar to MSCI World), not a Singapore-specific index like the Straits Times Index. This matters when deciding whether the comparison is relevant to your own alternative investment choice.
Should I switch from Cash Smart to Flagship based on one good month?
No. A single month of outperformance is not a reliable signal to change your asset allocation. Cash Smart and Flagship serve different time horizons (short-term capital preservation versus long-term growth) — the choice should be driven by when you need the money, not by the most recent performance review.
This article was researched with the help of AI. While we strive to keep all information accurate and up to date, there may be errors. If you notice any discrepancies, please contact us.