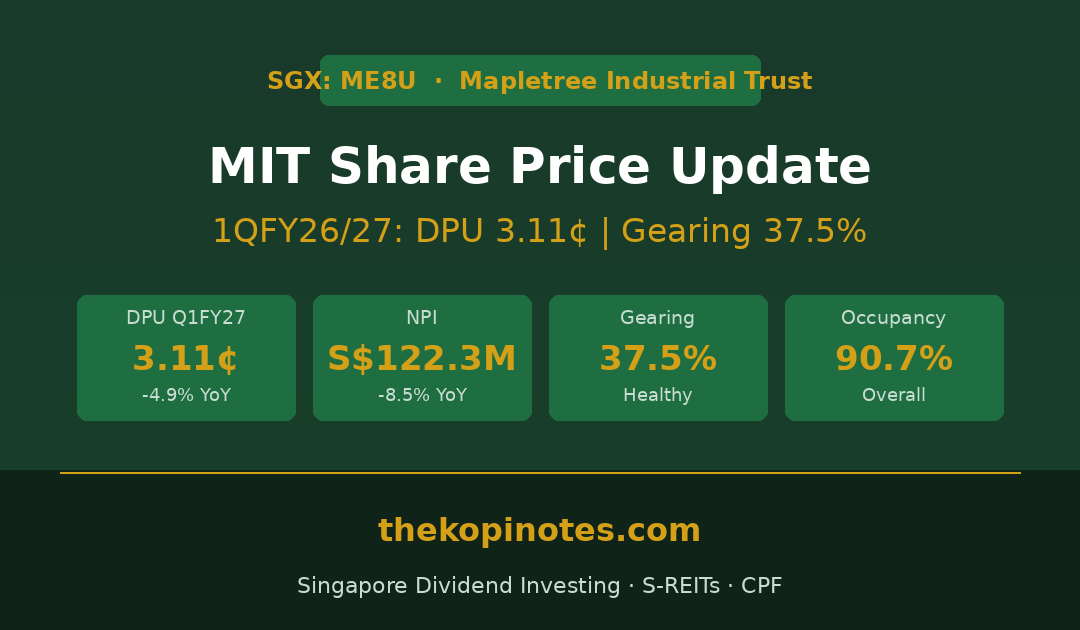
The Mapletree Industrial Trust share price (SGX: ME8U) is closely tracked by Singapore dividend investors as the REIT navigates North American lease transitions, data centre portfolio rebalancing, and interest rate headwinds. MIT released its 1QFY26/27 financial results on 23 July 2026 — covering April to June 2026 — with a headline DPU of 3.11 cents, down 4.9% year-on-year but up 0.6% quarter-on-quarter from the prior quarter’s 3.09 cents.
Beneath the headline, there are several positive developments: the Hawthorne Data Centre has been backfilled with an aerospace technology company on a 10-year lease, Singapore portfolio rental reversions came in at +5.3%, gearing remains healthy at 37.5%, and management has outlined a targeted S$500–600 million divestment programme in North America to free up capital and strengthen the balance sheet.
1QFY26/27 Key Financial Results
The table below summarises MIT’s income statement for 1QFY26/27 (April–June 2026) versus the prior year and prior quarter:
| Metric | 1QFY26/27 | 1QFY25/26 | YoY | 4QFY25/26 | QoQ |
|---|---|---|---|---|---|
| Gross Revenue (S$M) | 162.3 | 175.9 | -7.7% | 163.8 | -0.9% |
| Net Property Income (S$M) | 122.3 | 133.6 | -8.5% | 119.9 | +2.0% |
| Amount Distributable (S$M) | 88.8 | 93.3 | -4.8% | 88.2 | +0.7% |
| DPU (cents) | 3.11 | 3.27 | -4.9% | 3.09 | +0.6% |
| NAV per Unit (S$) | 1.63 | — | — | 1.63 | Flat |
Source: MIT SGX Announcement, 23 July 2026.
The year-on-year decline stems from three factors: loss of income from Singapore industrial properties divested in August 2025; non-renewal of leases in the North American portfolio; and a weaker USD against SGD. On the positive side, borrowing costs fell 24.6% YoY as divestment proceeds repaid loans. NPI improved 2.0% quarter-on-quarter, and DPU edged up 0.6% QoQ — suggesting the portfolio has passed its trough.
At an annualised DPU run-rate of approximately 12.44 cents (4 × 3.11¢) and a share price around S$1.93 in mid-August 2026, the Mapletree Industrial Trust share price implies a forward yield of approximately 6.4–6.5% — among the higher yields from blue-chip Singapore industrial REITs. NAV per unit is S$1.63, placing MIT at a price-to-NAV of approximately 1.18x.
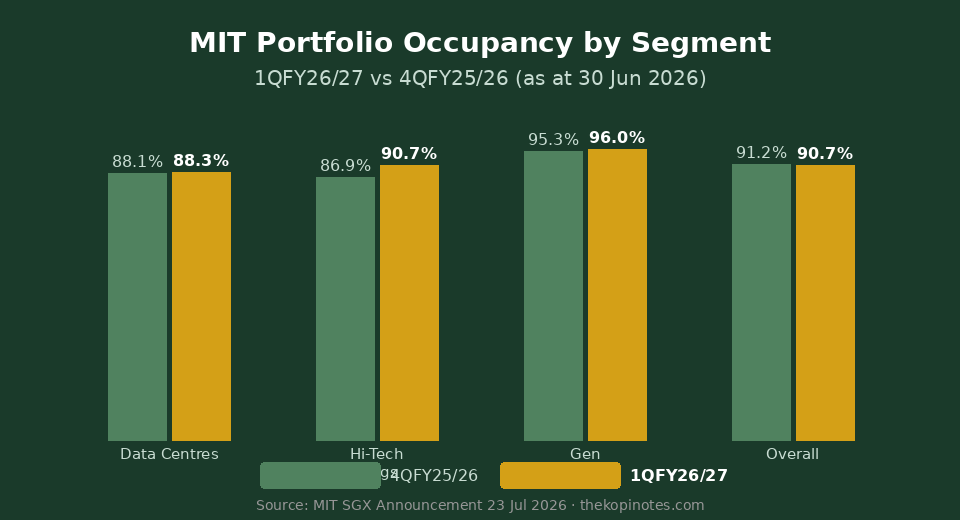
Portfolio Overview & Occupancy by Segment
As at 30 June 2026, MIT’s portfolio comprises 135 properties with AUM of S$8.3 billion across North America (46.5%), Singapore (46.3%), and Japan (7.2%). Data centres account for 57.2% of AUM — the dominant segment by value.
| Geography | Properties | Occupancy 1QFY27 | Occupancy 4QFY26 | WALE (yrs) | Rental Reversion |
|---|---|---|---|---|---|
| Singapore | 79 | 94.3% | 93.4% | 2.6 | +5.3% |
| North America | 54 | 82.5% | 86.1% | 6.9 | +2.2% |
| Japan | 2 | 100.0% | 100.0% | 13.5 | — |
| Overall | 135 | 90.7% | 91.2% | 4.5 | — |
Source: MIT 1QFY26/27 Results Presentation, 23 July 2026.
The dip in overall occupancy from 91.2% to 90.7% is almost entirely North American — Singapore (94.3%) and Japan (100%) are firmly anchored. Critically, the North American WALE improved from 6.3 to 6.9 years QoQ, driven by the Hawthorne DC backfill (10-year lease) and Sunnyvale DC extension (5 years). The Singapore portfolio maintained an 87.9% tenant retention rate in Q1.
Data Centre Strategy: Backfilling & Targeted Divestments
Data centres account for 57.2% of MIT’s AUM — the largest single segment. With AI-driven demand pushing North American data centre vacancy to just 0.9% in the four largest US markets (per CBRE), MIT’s portfolio sits in a structurally favourable position. Three key developments in 1QFY26/27:
- Hawthorne DC backfilled: A leading aerospace technology company signed a 10-year lease at 2301 West 120th Street, Hawthorne — a long-dated, high-quality covenant that fully addresses the prior quarter’s vacancy.
- Sunnyvale DC extended: MIT secured a 5-year lease extension at 1400 Kifer Road, Sunnyvale — removing near-term expiry risk from a key Silicon Valley asset.
- Philadelphia DC divested: The 2000 Kubach Road property (124,190 sq ft) was sold at US$14.5M — above independent valuation of US$13.9M — with proceeds used to pare down debt.
About 364,500 sq ft of new and renewal leases were executed in North America during Q1, of which 79% were new leases — demonstrating active demand for MIT’s data centre and industrial spaces. Portfolio weighted average rental reversions in North America came in at +2.2%.
The manager has also announced a targeted divestment programme of S$500–600 million in North America, focused on non-core assets. Proceeds will be used for interim debt repayment and to create headroom for acquisitions. About 75.6% of the data centre portfolio operates on triple-net lease structures (tenants bear most operating costs) — a significant cash-flow buffer.
Capital Management & Balance Sheet
| Metric | 30 Jun 2026 | 31 Mar 2026 |
|---|---|---|
| Aggregate Leverage | 37.5% | 34.0% |
| Total Borrowings | S$3,084.8M | S$2,786.7M |
| Average Borrowing Cost | 3.2% p.a. | 3.2% p.a. |
| Interest Rate Hedge Ratio | 73.3% | 88.6% |
| Forex Hedged / SGD-Derived | 90.5% | — |
| Interest Coverage Ratio | 4.0x | 4.0x |
| Avg Debt Tenor | 3.4 years | 3.4 years |
| Fitch Rating | BBB+ / Stable | BBB+ / Stable |
Source: MIT SGX Announcement, 23 July 2026.
The gearing increase from 34.0% to 37.5% reflects MIT’s redemption of existing perpetual securities and simultaneous drawdown of replacement debt — a capital structure optimisation move rather than a sign of stress. At 37.5%, MIT remains well within the 50% MAS regulatory cap, with approximately S$1.3–1.5 billion of headroom before reaching an internal 45% threshold. No more than 25% of total debt matures in any single financial year.
The key watch point is the interest rate hedge ratio decline from 88.6% to 73.3%. Approximately S$600 million of interest rate hedges expire during FY26/27, and replacement hedges will be locked in at current higher rates — creating an estimated additional DPU headwind of approximately 0.12 cents per annum per 50bps rise in base rates. This is a known, quantifiable risk that the market has largely priced in. The 90.5% forex hedging of distributions provides significant protection for Singapore investors against USD/CAD volatility.
Outlook & Share Price Targets
MIT’s management described a “challenging operating environment” shaped by Middle East conflict-linked energy price pressures, slowing global growth (World Bank forecasts 2.5% global GDP growth in 2026, the lowest since COVID-19), and trade policy uncertainty. Singapore’s GDP grew 5.7% YoY in Q2 2026 — a solid domestic backdrop for the Singapore industrial portfolio.
The North American data centre market remains structurally strong: CBRE reports overall vacancy at just 0.9% across the four largest markets, with demand driven by AI startups, neo-clouds, and hyperscalers. Power constraints and zoning challenges are limiting new supply — creating a favourable environment for well-located existing assets like MIT’s.
For the Mapletree Industrial Trust share price, the key forward catalysts to monitor include: completion of the S$500–600M North American divestment programme; progress on North American lease backfilling beyond Hawthorne and Sunnyvale; and the trajectory of replacement interest rate swaps as the S$600M of expiring hedges roll. Analyst consensus price targets range from S$2.05 to S$2.22, implying 5–15% upside from the August 2026 trading range of S$1.93. See the full analyst price target breakdown for broker-by-broker verdicts.
Is MIT Worth Buying in 2026?
MIT is Singapore’s largest industrial REIT with a unique dual-engine structure: Singapore industrial properties delivering stable, rising rents (+5.3% reversions), and North American data centres offering long-WALE income (6.9 years) from technology tenants. The 1QFY26/27 results confirm the investment thesis has not changed — North American lease transitions remain a near-term drag, but the Hawthorne DC backfill on a 10-year lease and the Sunnyvale extension demonstrate the manager’s ability to execute.
Bull case: Completion of S$500–600M North American divestments at or above book could reduce gearing to 34–35%, creating significant acquisition headroom. AI-driven data centre demand (vacancy at 0.9% in primary NA markets), Singapore rental momentum, and 90.5% forex-hedged distributions make MIT a relatively defensive, high-yield play for dividend investors targeting 6.4–6.5%.
Bear case: S$600M of expiring low-rate interest rate hedges will be replaced at higher market rates — a quantifiable DPU headwind through FY26/27. North American occupancy at 82.5% is below optimal. Any additional non-renewals beyond the already-confirmed 1.2% of GRI would be a negative surprise. USD/CAD weakness against SGD remains a background risk for 46.5% of the portfolio.
For the full investor guide to MIT — including its complete DPU history, Philadelphia divestment analysis, and peer comparison with Keppel DC REIT and CapitaLand Ascendas REIT — see the Mapletree Industrial Trust investor guide. For a broader S-REIT context, browse the S-REIT articles hub.
How to Invest in MIT & Other S-REITs
MIT (SGX: ME8U) is available on all major Singapore brokerage platforms. If you are building a dividend portfolio with S-REITs, these platforms support CPFIS-OA investing and make it easy to get started:
- Endowus — Singapore’s leading CPF and SRS investment platform with access to institutional-grade funds. Use referral code 2V343 to get S$20 in access fee credits. View Endowus referral details →
- Syfe — offers the REIT+ portfolio tracking the iEdge S-REIT Leaders Index for diversified S-REIT exposure. Use referral code SRPRFFFCD for fee discounts. View Syfe referral details →
Frequently Asked Questions
What is the Mapletree Industrial Trust share price today?
As at mid-August 2026, the Mapletree Industrial Trust (SGX: ME8U) share price is trading around S$1.93. Prices move daily — check SGX, Yahoo Finance, or your broker for the latest quote. At S$1.93 and an annualised DPU run-rate of approximately 12.44 cents (4 × 3.11¢), the trailing yield is approximately 6.4–6.5%. The NAV per unit is S$1.63, placing MIT at a price-to-NAV of approximately 1.18x.
What was MIT's DPU for 1QFY26/27?
MIT declared a DPU of 3.11 cents for 1QFY26/27 (April–June 2026), announced on 23 July 2026. This was 4.9% lower year-on-year (vs 3.27¢ in 1QFY25/26) but 0.6% higher quarter-on-quarter versus the 3.09¢ declared in 4QFY25/26. The YoY decline reflects income loss from Singapore property divestments and North American lease non-renewals, partially offset by lower borrowing costs from debt repayment.
What is MIT's gearing ratio and is the balance sheet healthy?
MIT’s aggregate leverage stood at 37.5% as at 30 June 2026, up from 34.0% at 31 March 2026. The increase reflects the redemption of existing perpetual securities and drawdown of replacement debt. At 37.5%, MIT remains well within the MAS 50% regulatory cap. The REIT holds a Fitch BBB+ credit rating with Stable outlook and maintains an Interest Coverage Ratio of 4.0x — indicating a robust balance sheet with substantial headroom for acquisitions.
Why did MIT's North American occupancy fall to 82.5%?
North American portfolio occupancy fell from 86.1% in 4QFY25/26 to 82.5% in 1QFY26/27, primarily due to a confirmed non-renewal of a data centre lease. However, MIT successfully backfilled the Hawthorne Data Centre with an aerospace technology company on a 10-year lease, and extended the Sunnyvale DC by 5 years. The North American WALE improved from 6.3 to 6.9 years quarter-on-quarter — a positive signal for lease stability. Remaining FY26/27 non-renewal exposure is approximately 1.2% of gross rental income.
What are analyst price targets for MIT in 2026?
Analyst consensus price targets for MIT (SGX: ME8U) range from S$2.05 to S$2.22 as of mid-2026, implying 5–15% upside from the approximately S$1.93 August trading range. Most brokers maintain Buy or Accumulate ratings based on MIT’s AI-driven data centre demand exposure, BBB+ credit rating, and expected DPU stabilisation as North American lease transitions complete. See the full MIT price target analysis.
Does MIT pay quarterly dividends?
Yes, MIT distributes income to unitholders on a quarterly basis. The most recent declaration was 3.11 cents for 1QFY26/27 (April–June 2026). MIT’s full-year FY25/26 DPU was 12.71 cents. Distributions are typically paid approximately 2 months after each quarter-end. MIT’s financial year runs from 1 April to 31 March.
This article was researched with the help of AI. While we strive to keep all information accurate and up to date, there may be errors. If you notice any discrepancies, please contact us.