CapitaLand Ascendas REIT (CLAR) 1H2026 Results: 8.6% Income Growth, 7.482¢ DPU & September Payout (SGX: A17U)
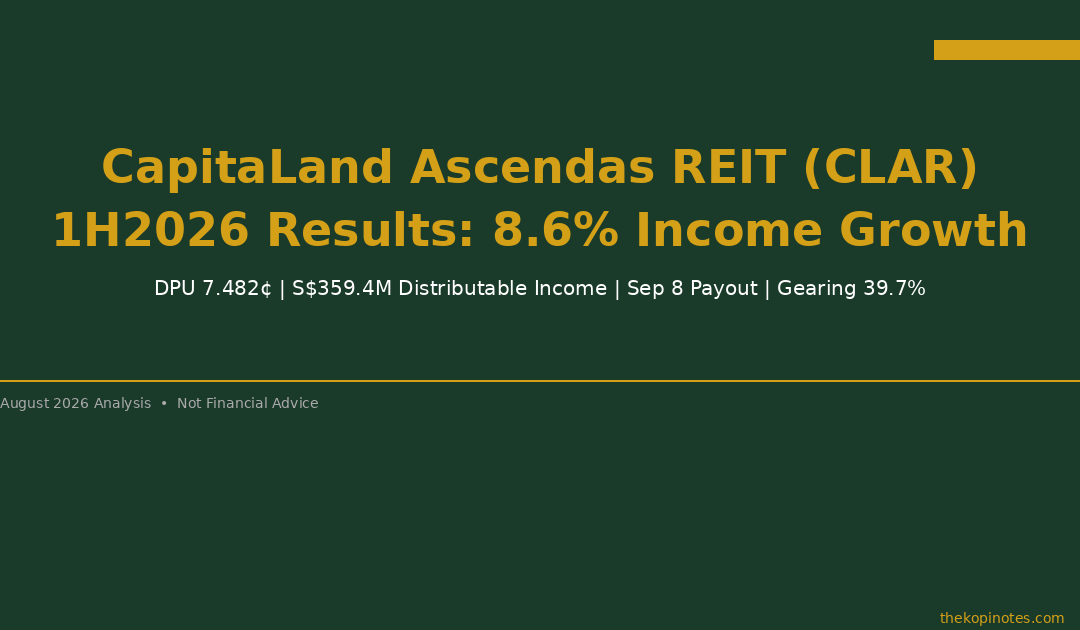
CapitaLand Ascendas REIT (SGX: A17U) delivered distributable income of S$359.4 million for the first half of 2026 — up 8.6% year-on-year. Distribution per unit (DPU) for 1H2026 came in at 7.482 Singapore cents, effectively flat despite an enlarged unit base from April’s S$903.5 million equity raise. The next cash payout of 3.732¢ is scheduled for September 8, 2026. Gearing declined to 39.7%, leaving over S$4.3 billion in acquisition headroom below the MAS 50% limit.
Not financial advice. All figures are for educational reference only. Data as at August 2026 unless noted.
- 1H2026 distributable income: S$359.4M (+8.6% YoY) — earnings growth is real and accelerating
- 1H2026 DPU: 7.482¢ (stable despite equity dilution from April EFR); Sep 8 payout: 3.732¢
- Gearing fell from 42.0% to 39.7%; sector breakdown is 44% Business Space, 32% Industrial+DC, 24% Logistics
Table of Contents — Click to expand
1H2026 Key Highlights at a Glance
CLAR released its 1H2026 financial results on August 5, 2026. Here is the headline scorecard:
| Metric | 1H2026 | 1H2025 | Change |
|---|---|---|---|
| Distributable Income | S$359.4M | S$330.9M | +8.6% |
| Distribution Per Unit (DPU) | 7.482¢ | 7.477¢ | +0.1% |
| Portfolio Occupancy | 89.1% | 90.9% | –1.8pp |
| Aggregate Leverage (Gearing) | 39.7% | 42.0% (Dec 25) | –2.3pp |
| Cost of Debt | 3.5% | 3.6% | –0.1pp |
| Debt Headroom (to MAS 50%) | ~S$4.3B | ~S$2.7B | +S$1.6B |
| Acquisition Pipeline | S$1.8B | S$1.2B | +S$0.6B |
Source: CapitaLand Ascendas REIT 1H2026 Financial Results, August 5, 2026. All figures in SGD. Not financial advice.
DPU & Distributable Income: Why This Print Matters
The 8.6% jump in distributable income is the headline number — and it deserves scrutiny, because CLAR also raised S$903.5 million in April 2026 through an equity fund raising (EFR). When you raise equity, more units are in circulation. So you’d normally expect DPU to fall even if income grows.
The fact that DPU came in at 7.482¢ — up a fraction from 7.477¢ in 1H2025 — signals that the income growth from new acquisitions is genuinely absorbing the dilution. That’s an important sign of accretive capital management.
How This Compares to Prior Half-Years
To put 1H2026’s S$359.4M in context, look at the trend:
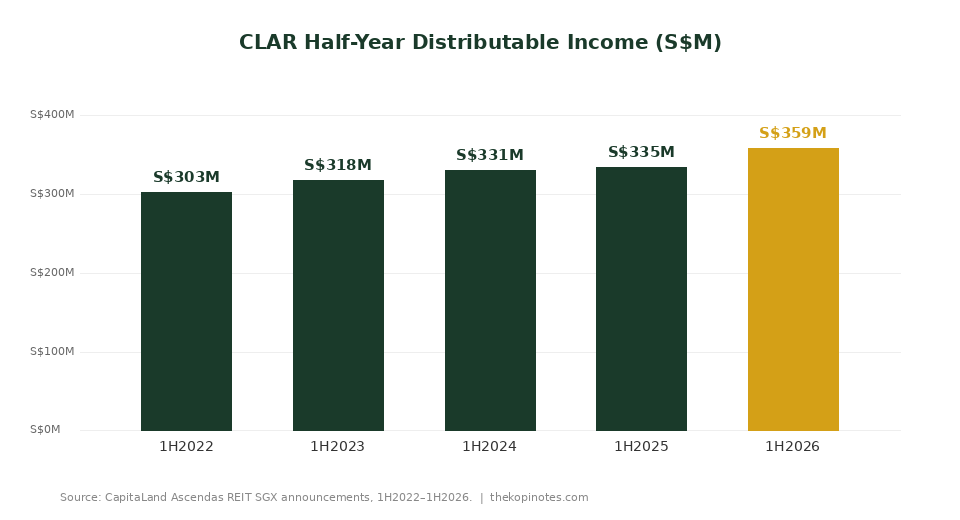
Source: CapitaLand Ascendas REIT half-year results, 2022–2026. H1 2022–2024 are approximate based on published full-year figures.
1H2026 is the strongest half on record for CLAR’s distributable income — driven by acquisitions in Singapore, Europe, the US, and Japan (including CLAR’s debut hyperscale data centre in Greater Osaka) completed in 2025 and 2026, combined with positive rental reversions on expiring leases.
Use our Singapore retirement calculator to model how REIT income at this scale could fit into a passive income strategy.
Portfolio by Sector: Where CLAR’s Income Comes From
CLAR is not a single-sector REIT. Its S$17+ billion portfolio spans three distinct property types across Singapore, the US, Australia, the UK, and Japan. Understanding the sector split helps you assess risk and opportunity.
| Sector | % of Portfolio | Key Markets | Outlook |
|---|---|---|---|
| Business Space & Life Sciences | 44% | Singapore (32%), US (8%), Australia (4%) | Science parks & biz campuses. Singapore demand firm; US life sciences seeing some softness from biotech funding pull-back |
| Industrial & Data Centres | 32% | Singapore (6%), UK/Europe (5%), Japan (new in 2026) | Fastest-growing segment. AI compute demand driving data centre rents & occupancy. Japan entry adds hyperscale exposure |
| Logistics | 24% | Singapore (9%), Australia (9%), UK (4%), US (3%) | Last-mile & distribution assets. E-commerce tailwind intact; new Loyang Crescent asset added Jun 2026 |
Source: CapitaLand Ascendas REIT 1H2026 Results Presentation, August 2026.
The data centre exposure within the “Industrial & Data Centres” bucket is a key reason CLAR trades at a tighter yield than pure logistics or retail REITs. Data centres command premium rents with long-lease structures (often 10+ years), and AI-driven demand is keeping vacancy near zero across the markets CLAR operates in.
For a broader comparison of Singapore REIT sectors, see our best S-REITs Singapore 2026 guide, which covers retail, office, hospitality, and healthcare alongside industrial.
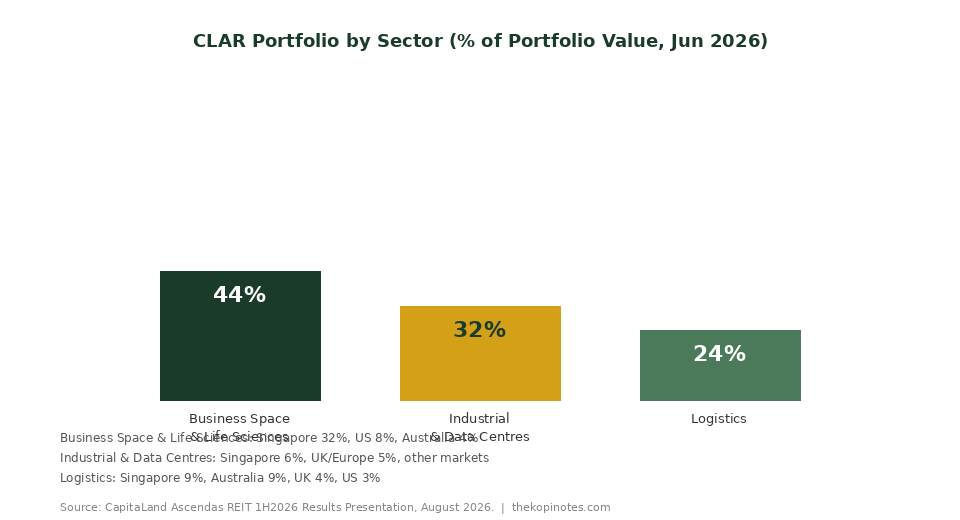
Source: CapitaLand Ascendas REIT 1H2026 Investor Presentation, August 2026.
Gearing & Capital Management: The Balance Sheet Is Improving
One of the most encouraging signals in CLAR’s 1H2026 results is the gearing trajectory. Aggregate leverage fell from 42.0% at end-December 2025 to 39.7% at end-June 2026 — a significant 2.3 percentage point improvement in just six months.
How? The April 2026 EFR (raising S$903.5 million in fresh equity) reduced the debt-to-assets ratio even as CLAR deployed capital into new acquisitions. The net effect is a cleaner balance sheet with over S$4.3 billion in debt headroom before hitting the MAS 50% ceiling.
Why Gearing Matters for DPU Sustainability
High gearing is the single biggest risk to any REIT’s DPU sustainability. When borrowing costs spike (as they did in 2022–2024), heavily geared REITs see their interest expense balloon — squeezing distributable income and forcing DPU cuts.
At 39.7%, CLAR sits comfortably in the “moderate gearing” band for S-REITs. The comparison to the MAS limit:
| Gearing Level | Status | MAS Threshold |
|---|---|---|
| Below 40% | Comfortable ✅ | No minimum ICR requirement |
| 40%–50% | Elevated ⚠️ | ICR must be ≥2.5× |
| Above 50% | Breach ❌ | MAS regulatory action required |
Source: MAS Property Fund Guidelines. ICR = Interest Coverage Ratio.
CLAR at 39.7% is just below the 40% threshold — meaning it does not yet face the ICR maintenance requirement, and has meaningful room to take on debt for DPU-accretive acquisitions without triggering the elevated gearing band. That S$1.8 billion acquisition pipeline management cited in the results presentation can be partially funded by debt while remaining within prudent parameters.
For more on how to evaluate REIT financial health, our passive income Singapore 2026 guide covers gearing, ICR, and what to look for in an S-REIT balance sheet.
September 8 Distribution: What You Need to Know
If you own CLAR units, here is the practical information for the upcoming H1 2026 cash distribution:
| Distribution Detail | Information |
|---|---|
| Distribution Amount | 3.732¢ per unit (remaining H1 2026 DPU) |
| Distribution Period | April 2 – June 30, 2026 |
| Payment Date | September 8, 2026 |
| Record Date | August 20, 2026 |
| Advanced Distribution (Already Paid) | 3.750¢ paid April 30, 2026 (Jan 1 – Apr 1, 2026) |
| Total 1H2026 DPU | 7.482¢ (3.750¢ + 3.732¢) |
Source: CapitaLand Ascendas REIT 1H2026 results announcement, August 5, 2026.
Important: The record date for the September 8 payout was August 20, 2026 — which has already passed. If you did not own CLAR units by that date, you will not receive this particular distribution. However, the next H2 2026 distribution (for July–December 2026) will have its own record date, expected to be announced with the FY2026 full-year results in early 2027.
Analyst Targets & Share Price Outlook
Following the 1H2026 results, multiple Singapore banks updated their views on CLAR. Both DBS and Maybank maintained Buy ratings with a target price of S$3.20. At a recent share price of around S$2.75–S$2.85, that implies upside potential of approximately 12–16% from current levels, plus the ongoing distribution yield of approximately 5.5–5.8%.
Key analyst themes from post-results notes:
- Portfolio refresh thesis intact: The divestment of older, lower-yielding assets (particularly in the US and Singapore) and reinvestment into higher-growth data centres and logistics properties is seen as DPU-accretive over FY2027–FY2028.
- Data centre exposure as a valuation catalyst: CLAR’s Japan data centre entry and growing European DC portfolio are increasingly viewed through a data centre REIT lens, not purely as industrial. This may attract different investor pools as the DC segment grows.
- Gearing improvement is a positive re-rating trigger: At sub-40% leverage, CLAR no longer faces the same balance sheet overhang concern that suppressed its price-to-NAV multiple in 2023–2024.
For a full analysis of CLAR’s share price history, NAV, and price target methodology, see our CLAR share price target 2026 guide.
How to Buy CLAR for Future Distributions
Since the August 20 record date has passed, you’ve missed the September 8 payout. But CLAR’s next distribution — for H2 2026 (July–December) — will have its record date in early 2027. Here is how to position yourself:
Step 1: Choose a Brokerage
You need an SGX-connected account. Popular options for Singapore retail investors:
- Syfe Trade — zero-commission SGX trading. Use our Syfe referral code SRPRFFFCD for a sign-up bonus.
- FSMOne — solid for regular savings plans. FSMOne referral code P0544985 for fee savings.
- IBKR — low commissions for active traders. Our IBKR referral code jianxiong368.
Step 2: Use Endowus for SRS/CPF Managed Access
If you prefer fund-based S-REIT exposure within your SRS or CPF account, Endowus (code 2V343) offers REIT-focused funds that include CLAR and peer S-REIT exposure. For CPF OA investors, this bypasses the need to pick individual REITs.
Step 3: Check the Next Record Date
CLAR announces H2 results (and the next distribution record date) around February–March. Watch the CapitaLand Ascendas REIT investor relations page or set an SGX alert for CLAR (A17U) announcements. You must own units on or before the record date to qualify.
For a deeper walkthrough on CPF-approved REIT investing, see our CPF investment strategy guide.
Frequently Asked Questions: CLAR 1H2026 Results
What was CLAR’s DPU for 1H2026?
Why did distributable income grow 8.6% when DPU was flat?
When is CLAR’s next distribution payment?
What is CLAR’s gearing after 1H2026?
What sectors does CLAR invest in?
What is CLAR’s target price from analysts?
Is CLAR a good buy after the 1H2026 results?
How does CLAR’s 1H2026 performance compare to peer industrial REITs?
Related CLAR & S-REIT Guides on The Kopi Notes
This article was researched with the help of AI. While we strive to keep all information accurate and up to date, there may be errors. If you notice any discrepancies, please contact us.