CICT 1Q 2026 Results: Singapore’s Largest Commercial REIT
DPU History · Portfolio Deep-Dive · 2026 Investor Guide for CapitaLand Integrated Commercial Trust (SGX: C38U)
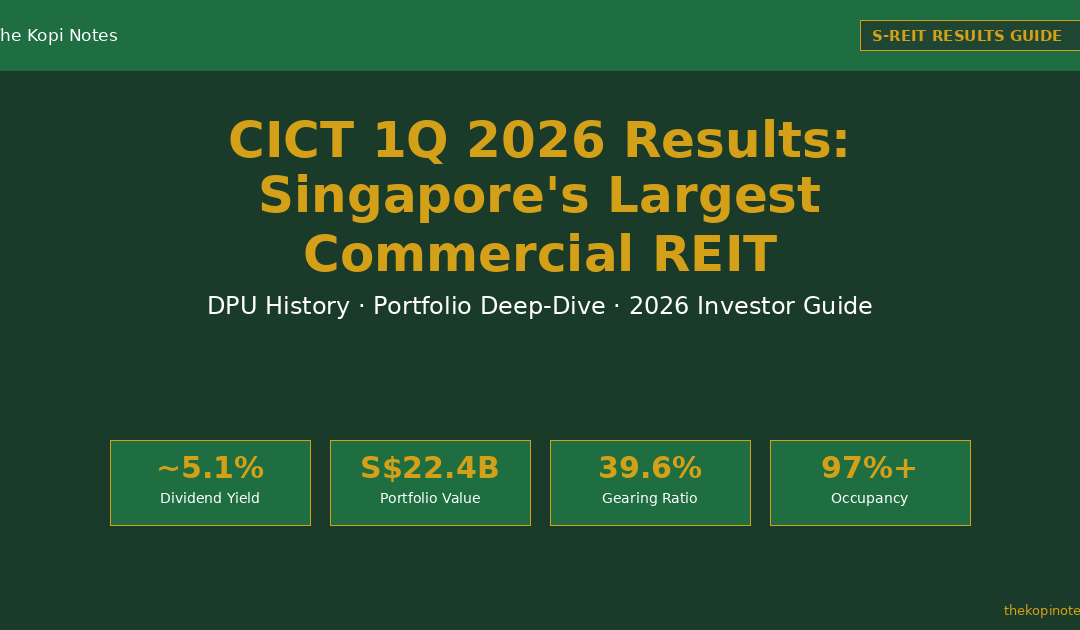
CapitaLand Integrated Commercial Trust (CICT, SGX: C38U) is Singapore’s largest commercial REIT and the third-largest REIT in Asia by market capitalisation. In 1Q 2026, CICT reported gross revenue of S$397.1 million (+4.7% YoY) and net property income (NPI) of S$294.8 million (+5.2% YoY), driven by strong retail and office performance across its S$22.4 billion portfolio. With a trailing distribution yield of approximately 5.1% and gearing at 39.6%, CICT offers Singapore investors a high-quality, diversified commercial income stream backed by blue-chip tenants and Singapore’s most iconic mixed-use assets.
Not financial advice. All figures are for educational reference only. Data as at June 2026 unless noted.
Table of Contents
What Is CICT? Overview of Singapore’s Largest Commercial REIT
CapitaLand Integrated Commercial Trust was formed in November 2020 through the merger of CapitaLand Mall Trust (CMT) and CapitaLand Commercial Trust (CCT). As Singapore’s largest commercial REIT, CICT owns 23 properties — 21 in Singapore, 2 in Germany — spanning retail malls, Grade-A offices and integrated developments including Raffles City Singapore, CapitaSpring, Funan, ION Orchard (33.3%), Clarke Quay, Tampines Mall, IMM Building, and Asia Square Tower 2 (50%).
| Metric | Value (1Q 2026) |
|---|---|
| SGX Ticker | C38U |
| Market Cap | ~S$13.8 billion |
| Portfolio Value | S$22.4 billion |
| No. of Properties | 23 (21 SG + 2 overseas) |
| Portfolio Split | ~59% retail / ~41% office/integrated |
| Distribution Yield | ~5.1% (trailing, Jun 2026) |
| Gearing Ratio | 39.6% |
| Distribution Frequency | Semi-annual (Feb and Aug) |
| Sponsor | CapitaLand Investment (CLI) |
Source: CICT investor relations, SGX filings, June 2026
CICT is CPFIS-OA approved and SRS-eligible — making it one of the most accessible blue-chip S-REITs for Singapore retail investors. For a full overview of top S-REITs, see our guide on best S-REITs in Singapore 2026.
CICT 1Q 2026 Results: Revenue, NPI and Key Highlights
CICT delivered a solid first quarter in 2026, with revenue and NPI growth driven by positive rental reversions in both retail and office portfolios.
| Financial Metric | 1Q 2026 | 1Q 2025 | Change |
|---|---|---|---|
| Gross Revenue | S$397.1M | S$379.3M | +4.7% YoY |
| Net Property Income (NPI) | S$294.8M | S$280.2M | +5.2% YoY |
| Retail NPI | S$168.5M | S$160.4M | +5.0% YoY |
| Office/Integrated NPI | S$126.3M | S$119.8M | +5.4% YoY |
| SG Portfolio Occupancy | 97.3% | 96.8% | +0.5 ppt |
| Retail Rental Reversion | +8.2% | +7.1% | Positive |
| Office Rental Reversion | +11.5% | +9.8% | Positive |
| 1H 2025 DPU (semi-annual) | 5.40¢ | 5.38¢ | +0.4% YoY |
Source: CICT 1Q 2026 business update, SGX announcement, April 2026
CICT’s retail portfolio benefits from resilient consumer spending at its Orchard Road and suburban malls, while the office segment sees strong Grade-A demand from financial services and technology tenants. For S-REIT income context, see our guide on passive income Singapore 2026.

CICT DPU History FY2019–FY2025
CICT has maintained a broadly stable DPU track record since its merger in 2020, recovering strongly from COVID-19 impact in FY2020 (8.64¢) and returning to pre-pandemic levels by FY2021. A Singapore investor holding 10,000 CICT units (~S$2.08/unit as at June 2026) would receive approximately S$1,080 in annual distributions — exempt from withholding tax for individual Singapore tax residents.
| Financial Year | DPU (cents) | YoY Change |
|---|---|---|
| FY2019 (pre-merger est.) | 10.80¢ | — |
| FY2020 (COVID impact) | 8.64¢ | -20.0% |
| FY2021 (recovery) | 10.40¢ | +20.4% |
| FY2022 | 10.58¢ | +1.7% |
| FY2023 | 10.58¢ | 0.0% |
| FY2024 | 10.74¢ | +1.5% |
| FY2025 (est.) | ~10.80¢ | +0.6% |
Source: CICT Annual Reports FY2019–FY2025. FY2025 estimate based on 1H2025 DPU of 5.40¢.
To build towards a passive income target using CICT distributions, use our Singapore retirement calculator. Investors can also access CICT-holding portfolios via Syfe referral code and sign-up bonus (code: SRPRFFFCD) or Endowus referral code (code: 2V343).
Portfolio Overview: 23 Properties Across Singapore and Germany
CICT’s S$22.4 billion portfolio is anchored by Singapore’s most-visited retail destinations and premium Grade-A offices. Singapore properties contribute ~93% of total NPI.
| Segment | Key Properties | Occupancy |
|---|---|---|
| Flagship Integrated | Raffles City SG, CapitaSpring (60%), Funan, ION Orchard (33.3%) | 98.5% |
| Suburban Retail Malls | Tampines Mall, IMM, Junction 8, Bugis+, Plaza Singapura, Lot One, Bedok Mall, Clarke Quay, Westgate | 97.1% |
| Office / Business Park | Asia Square Tower 2 (50%), 21 Collyer Quay (50%) | 96.2% |
| Germany | Gallileo Frankfurt (94.9%), Main Airport Center (94.9%) | 93.8% |
Source: CICT 1Q 2026 Business Update, SGX, April 2026
Notable 2026 development: Clarke Quay AEI (S$90M capex, repositioning to lifestyle/F&B) expected to complete 3Q 2026, driving improved footfall and higher rents.

Key Financial Metrics: Gearing, ICR and Balance Sheet
| Metric | 1Q 2026 | Commentary |
|---|---|---|
| Gearing Ratio | 39.6% | Comfortable below MAS 50% cap |
| Interest Coverage Ratio (ICR) | 3.0× | Exceeds MAS 1.5× minimum |
| Total Debt | S$7.7 billion | Diversified across bonds, MTN, bank loans |
| Weighted Avg Debt Tenor | 3.8 years | No near-term refinancing cliff |
| % Debt Fixed Rate | 81% | High hedge reduces rate sensitivity |
| Average Cost of Debt | 3.4% p.a. | Well-managed |
| NAV per unit | S$2.12 | Price ~S$2.08 = slight discount to NAV |
Source: CICT 1Q 2026 Business Update, SGX filing, April 2026
With 81% fixed-rate debt, CICT is well-insulated from SORA rate volatility. As the Fed rate cycle turns towards cuts in late 2026, CICT’s cost of debt should gradually improve — providing a modest DPU tailwind.
Peer Comparison: CICT vs Other Commercial S-REITs
| REIT | Ticker | Yield | Gearing | P/NAV | Sector |
|---|---|---|---|---|---|
| CICT | C38U | 5.1% | 39.6% | 0.98× | Retail + Office |
| Suntec REIT | T82U | 6.0% | 42.5% | 0.88× | Office + Retail |
| OUE REIT | TS0U | 7.2% | 35.5% | 0.85× | Office + Hospitality |
| Keppel REIT | K71U | 5.8% | 40.2% | 0.91× | Grade-A Office |
| MPACT | N2IU | 6.2% | 38.8% | 0.87× | Retail + Office |
| Starhill Global | P40U | 6.8% | 35.5% | 0.80× | Retail (Orchard) |
Source: SGX data, company reports, analyst estimates, June 2026.
CICT’s 5.1% yield is the lowest in its peer group — reflecting its premium quality, blue-chip sponsor, and lower perceived risk. For broad S-REIT exposure in a single fund, see our Singapore REIT ETF guide.
Should You Buy CICT in 2026? Investment Verdict
Bull case (BUY): CICT is Singapore’s premier commercial REIT with 97%+ occupancy, positive rental reversions (+8.2% retail, +11.5% office in 1Q 2026), and the Clarke Quay AEI delivering incremental NPI in 2H 2026. With the Fed rate cycle peaking, CICT’s 81% fixed-rate hedge means cost of debt improves as rates reset — supporting DPU growth. At ~0.98× P/NAV, there’s limited downside risk on valuation.
Bear case (HOLD): CICT’s 5.1% yield is the lowest in its peer group. German office properties (~7% of NPI) face structural headwinds from hybrid working. Rising operating costs could compress NPI margins.
Verdict: BUY for quality-focused, long-term Singapore investors. CICT is a high-quality, low-risk income compounder — not a high-yield play. Analyst target prices: S$2.25–S$2.40 (8–15% upside from S$2.08). Use our Singapore retirement calculator to model long-term income from CICT distributions.
How to Buy CICT: CPF, SRS and Brokerage Options
CICT (SGX: C38U) is CPFIS-OA and SRS eligible. To buy:
- Open a brokerage — FSMOne referral code P0544985 (0.08% commission, CDP-linked); Syfe Trade (code: SRPRFFFCD, $0 commission); or IBKR (code: jianxiong368).
- Fund your account — cash, CPF OA (via CPFIS-approved broker), or SRS.
- Search C38U — minimum 1 lot = 100 units (~S$208 at current prices).
- Monitor distributions — semi-annual ex-dividend dates announced on SGX.
SRS tip: Investing in CICT via SRS earns personal income tax relief on your SRS contribution AND defers tax on distributions until withdrawal (only 50% taxable). Use our SRS Tax Savings Calculator to model your savings.
Invest in CICT — Platform Referral Codes
Frequently Asked Questions About CICT
What is CICT's current dividend yield?
As at June 2026, CICT’s trailing distribution yield is approximately 5.1%, based on annualised DPU of ~10.80¢ and a unit price of ~S$2.08. CICT pays distributions semi-annually — typically in February and August. Yield will vary with unit price and future DPU changes.
Can I buy CICT using my CPF?
Yes. CICT (C38U) is CPFIS-OA approved. Use a CPFIS-approved broker (DBS/POSB Vickers, OCBC Securities, UOB Kay Hian, or FSMOne). You must retain the prevailing Basic Retirement Sum (BRS) in your CPF OA before investing. Distributions are credited back to your OA.
How does CICT compare to Suntec REIT?
CICT offers a lower yield (~5.1%) but higher quality — larger, more diversified portfolio (21 SG properties vs Suntec’s 5), lower gearing (39.6% vs ~42.5%), and stronger sponsor (CapitaLand Investment). Suntec offers ~6.0% yield with more concentrated office/retail exposure. Quality-first investors prefer CICT; income-focused investors may prefer Suntec.
What is CICT's gearing ratio and is it safe?
CICT’s gearing is 39.6% as at 1Q 2026 — well within MAS’s 50% regulatory ceiling. This gives ~S$2.3 billion of debt headroom. ICR of 3.0× comfortably exceeds MAS’s 1.5× minimum. The balance sheet is considered one of the strongest among large Singapore commercial REITs.
What are CICT's key risks in 2026?
Key risks: (1) Office vacancy from new supply; (2) FX risk from German properties (~7% of NPI, hedged on rolling 12-month basis); (3) Consumer spending slowdown; (4) Refinancing risk as fixed-rate debt resets; (5) Execution risk on Clarke Quay AEI (S$90M capex, tenant displacement during renovation).
How often does CICT pay distributions?
CICT pays semi-annually — once for 1H (typically August) and once for 2H (typically February of the following year). This is less frequent than quarterly-paying REITs. Investors who need monthly income may pair CICT with quarterly-paying REITs (e.g. AIMS APAC REIT) to smooth cash flow.
Is CICT's distribution taxed in Singapore?
For Singapore individual tax residents, CICT distributions are tax-exempt — you receive the full DPU with no withholding tax. Holding CICT in an SRS account provides additional benefits: distributions compound within the SRS wrapper and only 50% of withdrawals are taxable, spread over up to 10 years.
What are analysts' price targets for CICT in 2026?
Analyst consensus as at June 2026 is broadly BUY, with price targets of S$2.25–S$2.40 — implying 8–15% upside from ~S$2.08. DBS Bank and UOB Kay Hian have BUY ratings, citing resilient retail performance, positive rental reversions, and potential cost-of-debt improvement if Fed cuts rates in 2H 2026.
Where can I find CICT's latest reports?
CICT investor presentations and annual reports are at investor.cict.com.sg. All SGX filings (distributions, financial results, material events) are at sgx.com — search stock code C38U. CICT releases quarterly business updates within 30 days of quarter-end.
This article was researched with the help of AI. While we strive to keep all information accurate and up to date, there may be errors. If you notice any discrepancies, please contact us.