Keppel DC REIT Gearing Ratio & Debt Analysis 2026: Is the Balance Sheet Safe?
Published October 2026 | Singapore REIT Investor Guide
Keppel DC REIT (SGX: AJBU) maintained a gearing ratio of approximately 37.2% as at mid-2026 — well below the MAS regulatory ceiling of 45%, and one of the tightest balance sheets among Singapore data centre and industrial REITs. With an interest coverage ratio (ICR) of around 4.6 times, roughly 80% of debt at fixed rates, and debt maturities staggered out to 2031, KDC REIT’s balance sheet provides meaningful headroom even in a higher-for-longer rate environment. This guide breaks down what KDC’s gearing metrics mean for income sustainability and compares them with major S-REIT peers.
Not financial advice. All figures are for educational reference only and are estimates based on publicly available disclosures. Data as at mid-2026 unless noted. Always verify with the latest SGX filings before making investment decisions.
Table of Contents
- What Is Gearing Ratio and Why It Matters for S-REIT Investors
- Keppel DC REIT Gearing Ratio 2026
- KDC REIT Debt Maturity Profile
- Interest Coverage Ratio (ICR) Explained
- Fixed vs Floating Rate Debt Breakdown
- MAS Gearing Limits for Singapore REITs
- KDC REIT vs Peers: Gearing Comparison Table
- What the Balance Sheet Means for KDC REIT’s DPU
- Frequently Asked Questions
What Is Gearing Ratio and Why It Matters for S-REIT Investors
Gearing ratio — also called aggregate leverage — measures how much of a REIT’s total assets are funded by debt. Under the MAS Property Fund Guidelines, Singapore REITs must report this metric every quarter in their financial statements.
The formula is simple:
Gearing Ratio = Total Borrowings ÷ Total Assets × 100%
For investors in best S-REITs in Singapore 2026, gearing is one of the most important metrics to track because:
- Higher gearing = higher financial risk. A REIT with 44% gearing has almost no buffer before breaching the MAS limit. If asset values fall (during a property downturn), gearing ratios can spike quickly.
- Refinancing risk. Every dollar of debt must eventually be rolled over. REITs with concentrated near-term maturities face the risk of refinancing at higher rates or in tighter credit markets.
- DPU sensitivity. When a REIT’s borrowing costs rise — either through higher rates or credit downgrades — finance expenses increase and DPU shrinks. A REIT with 80% fixed-rate debt is much more insulated than one with 50% floating-rate exposure.
- Acquisition capacity. A REIT sitting at 37% gearing has room to gear up to 45% and make debt-funded acquisitions — growing the portfolio (and potentially DPU) without a dilutive rights issue.
For data centre REITs like Keppel DC REIT, balance sheet strength is especially important because data centres are capital-intensive assets and any major portfolio acquisition typically requires debt financing alongside equity.
Keppel DC REIT Gearing Ratio 2026
Based on estimates from KDC REIT’s most recent SGX filings and investor presentations, the REIT’s gearing ratio stood at approximately 37.2% as at mid-2026. This is calculated against a total asset base of roughly SGD 5.3–5.5 billion and total borrowings of approximately SGD 2.0 billion.
KDC REIT Key Balance Sheet Metrics (2026 Estimates)
| Metric | Value (Estimated) | What It Means |
|---|---|---|
| Gearing Ratio | ~37.2% | Well below 45% MAS ceiling |
| Total Borrowings | ~SGD 2.0B | Spread across multi-currency facilities |
| Weighted Avg Cost of Debt | ~3.5% p.a. | Partially benefiting from fixed hedges |
| Fixed Rate Debt | ~80%+ | Limits DPU impact from rate moves |
| Interest Coverage Ratio | ~4.6x | Strong ability to service debt obligations |
| Headroom to 45% Limit | ~7.8 ppt | SGD ~420M in additional debt capacity |
Source: Estimated from KDC REIT SGX filings and investor presentations, as at mid-2026. For reference only — verify with latest quarterly results.
The ~7.8 percentage point headroom to the MAS 45% limit translates to approximately SGD 420 million in additional debt-funded capacity — enough to pursue a meaningful acquisition without needing a rights issue. This is a key advantage KDC holds over peers like Suntec REIT (gearing ~41.3%), where acquisition firepower is noticeably more constrained.
For investors tracking passive income Singapore opportunities, a REIT’s gearing headroom directly informs how likely it is to grow its DPU via accretive acquisitions versus being forced into dilutive equity-raising.
KDC REIT Debt Maturity Profile 2026–2031
A gearing ratio alone doesn’t tell the full story. When the debt is due matters just as much as how much debt there is. A REIT with 37% gearing but all debt maturing in 2027 faces significantly more refinancing risk than one with the same gearing spread evenly across five years.
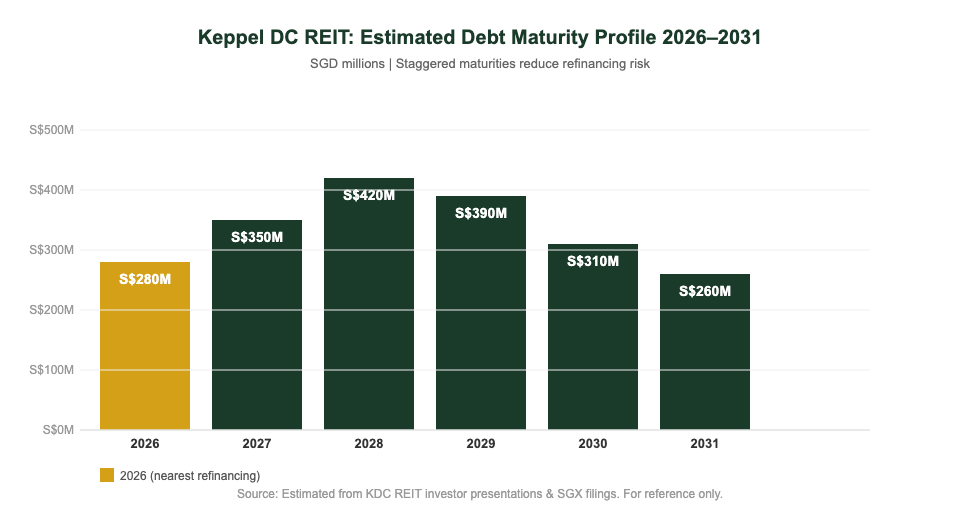
KDC REIT has historically maintained a staggered debt maturity profile with no single year representing more than 20–25% of total borrowings. This reduces the risk of being forced to refinance a large tranche in an unfavourable rate environment. Estimated maturities across 2026–2031 range from SGD 260M to SGD 420M per year.
Key takeaways from the debt maturity profile:
- No single year concentration risk: Debt maturities are broadly spread, with no year exceeding ~20% of total borrowings.
- 2028 peak refinancing year: The largest maturity tranche (~SGD 420M estimated) falls in 2028, giving management approximately two years of runway to navigate interest rate conditions.
- Multi-currency facilities: KDC REIT borrows in SGD, EUR, AUD, and GBP — matching the currencies of its global data centre portfolio (Singapore, Germany, Netherlands, Ireland, UK, Australia). This natural currency hedging reduces the risk of FX-driven gearing spikes.
For Singapore investors who use services like Endowus referral code to access S-REITs through SRS or CPF, understanding a REIT’s debt maturity profile helps assess the stability of distributions over your investment horizon.
Interest Coverage Ratio (ICR): How Comfortably Can KDC Service Its Debt?
The Interest Coverage Ratio (ICR) measures how many times a REIT’s earnings before interest and tax (EBIT) can cover its interest expense. A higher ICR signals a safer debt position — more cushion before the REIT struggles to meet interest payments.
ICR = Net Property Income ÷ Finance Expenses
KDC REIT estimated ICR: ~4.6x (mid-2026)
At 4.6x, KDC REIT’s interest coverage is healthy. It means that for every SGD 1 the REIT pays in interest, it generates roughly SGD 4.60 in net property income. MAS has set a minimum ICR of 1.5x as a regulatory floor — KDC’s 4.6x is more than three times this minimum.
Why ICR Matters More Than Gearing in a Rate-Rising Environment
When interest rates rise, two things happen simultaneously:
- Finance costs increase on any floating-rate or newly refinanced debt, which compresses DPU directly.
- Gearing can also rise if asset valuations decline (cap rates expand when risk-free rates rise), shrinking the denominator in the gearing formula.
A REIT with a high ICR and predominantly fixed-rate debt — like KDC — is well positioned to absorb rate shocks. Even if floating-rate borrowing costs rose by 100 basis points, the impact on KDC’s overall cost of debt would be limited to ~20% of total borrowings (the floating-rate portion), translating to a modest ~0.01–0.02 SGD cents impact on quarterly DPU.
This is one reason analysts considering a Syfe referral code and sign-up bonus to invest in a S-REIT ETF often find that S-REITs with conservative balance sheets like KDC tend to hold their DPU more reliably through rate cycles.
Fixed vs Floating Rate Debt: KDC REIT’s Hedging Strategy
One of the clearest indicators of a REIT manager’s conservatism is the proportion of fixed-rate versus floating-rate debt. Variable-rate debt is cheaper in a low-rate environment but creates earnings volatility when rates rise. Fixed-rate debt locks in a known interest cost — providing DPU predictability.
KDC REIT Debt Mix Estimate (Mid-2026)
| Debt Type | Proportion | Approx. Cost p.a. | Rate Environment Impact |
|---|---|---|---|
| Fixed Rate (incl. hedged) | ~80% | ~3.2–3.8% | Insulated from rate moves until refinancing |
| Floating Rate (unhedged) | ~20% | SOFR/EURIBOR + spread | Moves with benchmark rates |
| Total / Blended Cost | 100% | ~3.5% p.a. | Weighted average cost of debt |
Source: Estimated from KDC REIT investor presentations, as at mid-2026. For reference only.
The high proportion of fixed-rate debt means that a 50-basis-point rate cut (or hike) would affect only ~20% of KDC’s borrowings directly. For a REIT building long-term passive income, this translates to more predictable distributions quarter on quarter.
KDC also uses cross-currency interest rate swaps to hedge FX exposure on EUR, AUD, and GBP denominated debt back into SGD or USD — further insulating Singapore investors from currency-driven swings in the reported DPU. Investors interested in building a diversified income portfolio can also explore their FSMOne referral code to access KDC REIT and other S-REITs at low brokerage costs.
MAS Gearing Limits for Singapore REITs: The Regulatory Framework
The Monetary Authority of Singapore (MAS) sets the gearing ceiling under the MAS Property Fund Guidelines. As at 2026, the rules are:
- 45% aggregate leverage limit applies to all Singapore-listed REITs by default.
- 50% aggregate leverage limit is permitted for REITs that maintain a minimum interest coverage ratio of 2.5x AND have obtained a credit rating from a recognised agency (such as Moody’s, S&P, or Fitch).
- Quarterly disclosure is mandatory — every REIT must report its gearing ratio and ICR in its quarterly financial statements.
MAS introduced the ICR-linked 50% ceiling in 2022 to give REITs with stronger balance sheets more flexibility while ensuring they maintain the earnings capacity to service higher debt. KDC REIT, which holds credit ratings, operates under this framework — meaning it technically has a 50% ceiling, implying an additional ~13 percentage points of headroom above its current ~37.2% gearing.
What Happens If a REIT Breaches the Gearing Limit?
If a REIT’s gearing breaches the MAS limit, it is required to reduce leverage within a prescribed timeframe — typically through asset disposals or equity issuance (rights issue or private placement). This scenario is financially damaging for unitholders because:
- Rights issues are dilutive — more units outstanding means lower DPU per unit unless the proceeds are deployed accretively.
- Distressed asset sales may realise values below book, leading to NAV write-downs.
- Market perception suffers, often triggering a sell-off in the REIT’s units.
At 37.2% gearing, KDC is far from this scenario. Even if property valuations declined 15%, KDC’s adjusted gearing would still be well below 45%.
KDC REIT vs Peers: Gearing & Balance Sheet Comparison
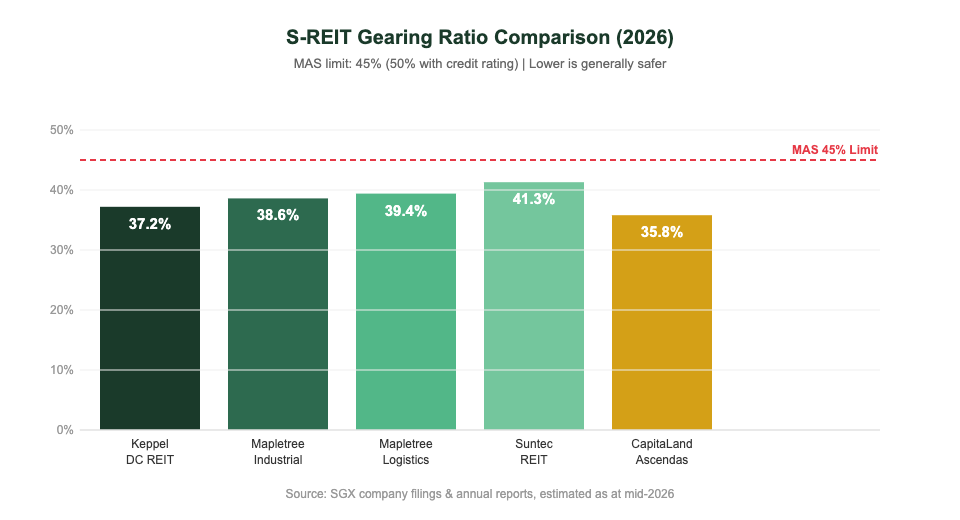
How does Keppel DC REIT’s financial position stack up against the major S-REITs Singapore investors most commonly hold? The table below compares five major REITs on the key balance sheet metrics.
| S-REIT | Gearing | ICR | Avg Cost of Debt | Fixed Rate % | Balance Sheet View |
|---|---|---|---|---|---|
| Keppel DC REIT | 37.2% | 4.6x | 3.5% | ~80% | Conservative ✅ |
| CapitaLand Ascendas REIT | 35.8% | 4.8x | 3.4% | ~82% | Very conservative ✅ |
| Mapletree Industrial Trust | 38.6% | 4.2x | 3.8% | ~75% | Moderate ✅ |
| Mapletree Logistics Trust | 39.4% | 3.9x | 3.6% | ~73% | Moderate ⚠️ |
| Suntec REIT | 41.3% | 3.1x | 4.1% | ~65% | Higher risk ⚠️ |
Source: Estimates from SGX filings, company investor presentations, as at mid-2026. For reference only — verify with latest quarterly reports before investing.
The comparison shows that KDC REIT and CapitaLand Ascendas REIT offer the most conservative balance sheets among the five REITs — both with gearing well below 40%, ICR above 4.5x, and the majority of debt at fixed rates. Suntec REIT’s higher gearing (41.3%) and lower ICR (3.1x) reflect its office and retail exposure in a market still navigating post-pandemic headwinds.
Investors tracking the Singapore retirement calculator to plan S-REIT income in retirement may prefer the more conservative profiles of KDC and CLAR for their core holdings, supplemented by higher-yielding REITs where appropriate.
What the Balance Sheet Means for KDC REIT’s DPU Sustainability
Ultimately, investors own Keppel DC REIT for its distributions. A strong balance sheet matters only insofar as it supports stable and growing DPU over time. Let’s translate the balance sheet metrics into what they mean for distributions:
1. DPU Is Well-Insulated from Rate Moves
With ~80% of debt at fixed rates, only ~SGD 400M of KDC’s total borrowings float with benchmark rates. A 100 basis point rate increase on this floating portion adds approximately SGD 4M in annual finance costs — equivalent to roughly 0.1–0.15 SGD cents per unit per year. Against a quarterly DPU of around 2.4–2.7 cents, this is manageable.
2. Acquisition Capacity Supports DPU Growth
KDC’s ~SGD 420M of gearing headroom (to the 45% MAS limit) can fund new data centre acquisitions. Each accretive deal — where the REIT buys a data centre at a cap rate higher than its cost of debt — directly lifts DPU per unit. The AI-driven demand for colocation and hyperscale data centres creates a pipeline of potential acquisitions from the KDC REIT Sponsor (Keppel Corporation’s infrastructure arm).
3. Long WALE Reduces Refinancing Pressure
KDC REIT’s Weighted Average Lease Expiry (WALE) is approximately 8+ years — meaning the underlying income stream is contracted well beyond the nearest debt maturities. This structural alignment of long leases with manageable near-term debt gives management flexibility to refinance on their terms rather than under pressure.
Scenario Analysis: Impact of a 50bps Rate Hike on KDC DPU
| Scenario | Impact on Annual Finance Costs | Est. Annual DPU Impact | Assessment |
|---|---|---|---|
| +50bps on floating rate debt only | +SGD ~2M | ~-0.05 to 0.08 SGD cts | Negligible ✅ |
| +100bps on floating rate debt only | +SGD ~4M | ~-0.10 to 0.15 SGD cts | Manageable ✅ |
| +100bps on all debt (refinancing) | +SGD ~20M | ~-0.50 to 0.70 SGD cts | Significant but survivable ⚠️ |
Source: TKN estimates based on ~SGD 2.0B total borrowings and ~2,668M units outstanding. Educational scenario analysis only.
The analysis confirms what the metrics suggest: day-to-day rate moves have minimal impact on KDC’s DPU given the high fixed-rate proportion. The tail risk scenario — where all debt needs to be refinanced 100bps higher simultaneously — is both highly unlikely (given staggered maturities) and still survivable for a REIT generating SGD 9–10 cents of annual DPU.
Investors wanting broader S-REIT exposure can explore Singapore REIT ETF guide as an alternative to individual REIT selection, or consider using the Syfe referral code and sign-up bonus for managed REIT portfolio access.
Frequently Asked Questions
What is Keppel DC REIT's gearing ratio in 2026?
What is the MAS gearing limit for Singapore REITs?
What is KDC REIT's interest coverage ratio?
How much of Keppel DC REIT's debt is fixed rate?
Is Keppel DC REIT's balance sheet safe?
What happens if KDC REIT's gearing rises above 45%?
How does KDC REIT's gearing compare to Mapletree Industrial Trust?
Verdict: KDC REIT’s Balance Sheet Is One of the Sector’s Strongest
At approximately 37.2% gearing, 4.6x ICR, ~80% fixed-rate debt, and staggered maturities out to 2031, Keppel DC REIT’s financial position compares favourably against its S-REIT peers and provides meaningful headroom for accretive acquisitions without triggering dilutive equity issuances. For Singapore income investors building a CPF investment strategy or supplementing CPF with private REIT holdings, KDC REIT’s balance sheet discipline is a material contributor to distribution sustainability.
This article is for educational purposes only and does not constitute financial advice. Data are estimates based on publicly available information as at mid-2026. Always refer to the latest SGX filings before making investment decisions. The Kopi Notes may earn referral commissions when readers sign up through referral links on this site.
This article was researched with the help of AI. While we strive to keep all information accurate and up to date, there may be errors. If you notice any discrepancies, please contact us.