Mapletree Industrial Trust vs Ascendas REIT 2026: Which Singapore Industrial REIT Is the Better Buy?
A data-driven comparison of ME8U and A17U — dividend yield, portfolio strength, gearing, and valuation.
Mapletree Industrial Trust (SGX: ME8U) and CapitaLand Ascendas REIT (SGX: A17U) are Singapore’s two most prominent industrial REITs. MIT offers focused exposure to hi-tech buildings and US data centres with a ~5.8% yield; AREIT provides broader diversification across logistics, business parks and four countries at a comparable ~5.5% yield. Both trade at discounts to NAV in October 2026, making this a compelling comparison for dividend investors.
Not financial advice. All figures are for educational reference only. Data as at October 2026 unless noted.
Table of Contents
Contents — Click to expand
Quick Comparison: MIT vs AREIT at a Glance
Both industrial REITs are blue-chip names in the Singapore market and feature regularly in income investor portfolios alongside the best S-REITs in Singapore 2026. Here is how they stack up at a single glance before we dive deeper.
| Metric | MIT (ME8U) | AREIT (A17U) |
|---|---|---|
| Manager | Mapletree Investments | CapitaLand Investment |
| SGX Ticker | ME8U | A17U |
| Total Assets (AUM) | ~S$8.8B | ~S$17.7B |
| Number of Properties | ~141 | ~229 |
| Dividend Yield (Oct 2026) | ~5.8% | ~5.5% |
| Gearing Ratio | ~38.3% | ~36.8% |
| Price-to-NAV | ~0.91x | ~0.87x |
| WALE (Weighted Avg Lease Expiry) | ~3.3 years | ~4.1 years |
| Geographic Diversification | SG + USA | SG + AU + UK + USA |
Source: MIT and AREIT investor presentations, SGX filings, October 2026.
At first glance, both REITs offer competitive yields, conservative gearing, and portfolios anchored in Singapore. The differences lie in scale, asset type mix, and geographic strategy — which we unpack below.
Mapletree Industrial Trust (ME8U) Overview
Mapletree Industrial Trust is a Singapore-listed REIT managed by Mapletree Investments, itself a wholly-owned subsidiary of Temasek Holdings. MIT’s portfolio spans approximately 141 properties across Singapore and the United States as at Q2 FY2027, with total assets of roughly S$8.8 billion.
What distinguishes MIT from traditional industrial REITs is its deliberate shift up the value chain. More than half of MIT’s Singapore portfolio by value consists of hi-tech buildings — precision engineering facilities, high-specification manufacturing parks, and modern business park clusters that command premium rents and attract tenants in biomedical, electronics, and advanced manufacturing sectors. The remaining Singapore exposure includes flatted factories (multi-tenanted industrial buildings), light industrial buildings, and a growing stack-up/ramp-up portfolio.
MIT’s most transformative strategic pivot was its US data centre joint venture, undertaken with its sponsor from 2019 onwards. Today, the US portfolio comprises approximately 28% of total assets by value, concentrated in hyperscale and colocation data centres across Virginia, Arizona, and Texas. This US data centre exposure gives MIT meaningful overlay of the AI infrastructure theme — a structural tailwind as hyperscalers like AWS, Microsoft Azure, and Google Cloud continue expanding capacity.
For investors seeking income alongside a passive income Singapore strategy, MIT’s blend of defensive Singapore industrial income with high-growth US data centre upside is a compelling narrative. The key risk: MIT’s WALE of ~3.3 years is shorter than AREIT’s, meaning more leases roll over in the near term.
CapitaLand Ascendas REIT (A17U) Overview
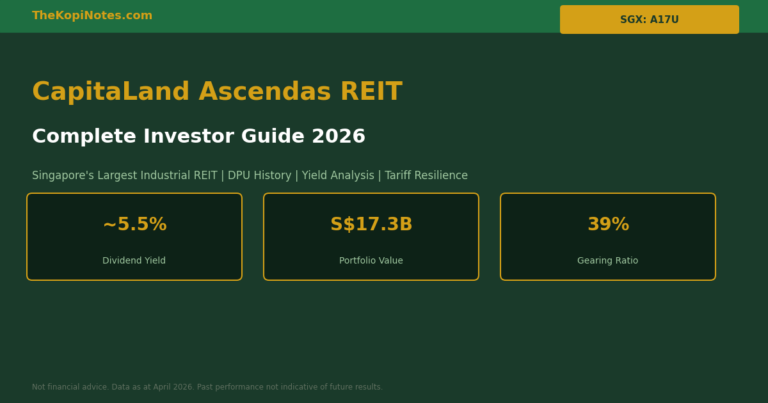
CapitaLand Ascendas REIT is Singapore’s largest industrial REIT by assets, with a total portfolio value of approximately S$17.7 billion across 229 properties in four countries — Singapore, Australia, the United Kingdom, and the United States. Managed by CapitaLand Investment, it benefits from one of the strongest sponsor ecosystems in Asia Pacific.
AREIT’s Singapore portfolio covers a broader spread of industrial sub-types than MIT’s: business & science parks, hi-tech industrial parks, suburban offices, logistics warehouses, and light industrial buildings. This breadth provides natural diversification within Singapore itself, with tenants spanning pharmaceuticals, technology, logistics, and defence.
Internationally, AREIT’s Australian portfolio (logistics and industrial in Sydney, Melbourne, Brisbane) contributes roughly 14% of revenue. The UK portfolio adds another 8–10%, focused on last-mile logistics in Greater London and the Midlands — a segment that benefits from e-commerce growth and constrained industrial land supply. Like MIT, AREIT also holds US data centre assets (~15% of AUM), though its data centre concentration is lower relative to MIT.
AREIT’s longer WALE of ~4.1 years and higher AUM provide stronger income visibility. For investors who prioritise scale, sponsor quality, and international diversification, AREIT is the more defensive choice. The trade-off: the larger portfolio means AREIT’s growth rate is slower per unit; accretive acquisitions require larger deal sizes to move the needle on DPU.
Dividend Yield & DPU Comparison
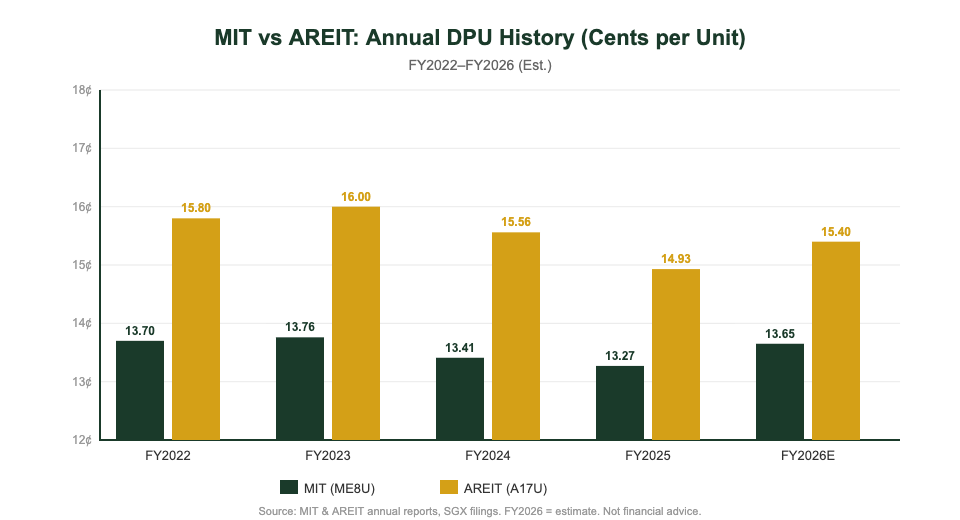
Both MIT and AREIT are semi-annual dividend payers (distributions in March/April and September/October). Here is the recent DPU track record and current yield at October 2026 prices.
| Period | MIT DPU (cents) | AREIT DPU (cents) |
|---|---|---|
| FY2022 | 13.70 | 15.80 |
| FY2023 | 13.76 | 16.00 |
| FY2024 | 13.41 | 15.56 |
| FY2025 | 13.27 | 14.93 |
| FY2026 (estimate) | 13.5–13.8 | 15.2–15.6 |
Source: MIT and AREIT annual reports, SGX investor updates. FY2026 estimates based on H1 actual + H2 consensus. Not financial advice.
At October 2026 prices of approximately S$2.35 for MIT and S$2.78 for AREIT, the forward yields work out to roughly 5.8% for MIT and 5.5% for AREIT. MIT’s higher yield reflects both a slightly more attractive entry point and the market’s perception of higher concentration risk (Singapore + USA only, versus AREIT’s four-country spread).
For Singapore investors who model CPF LIFE top-up vs REIT income on a Singapore retirement calculator, an MIT position of S$50,000 at 5.8% yield generates approximately S$2,900 per year in distributions — paid in two semi-annual tranches. The equivalent AREIT position at 5.5% generates ~S$2,750 per year.
Portfolio Strength & Geographic Diversification
Portfolio quality separates good REITs from great ones. We assess occupancy, WALE, and segment mix for each.
MIT’s Singapore portfolio occupancy stands at approximately 91.5% as at Q2 FY2027. Hi-tech buildings lead at ~95% occupancy, while the older flatted factories cluster around 88–90%. The US data centre portfolio maintains near-full occupancy (~99%) under long-term triple-net leases with hyperscale tenants — a key income stability anchor. Total committed occupancy including the US portfolio is approximately 93.8%.
AREIT’s overall portfolio occupancy is approximately 93.2%, with Singapore leading at ~95.3% and Australia slightly softer at ~91%. AREIT’s logistics portfolio in Australia faced mild vacancy headwinds in 2025 as the post-COVID demand surge normalised, but vacancy is stabilising in 2026 as industrial land supply constraints reassert. The UK and US portfolios contribute steady occupancy in the 92–96% range.
From a lease expiry perspective, AREIT’s longer WALE (4.1 vs 3.3 years) means less near-term re-leasing risk. MIT’s shorter WALE in Singapore is partly by design — shorter leases allow MIT to reset rents upward in a rising rental environment. With Singapore industrial rents trending up 3–5% annually since 2022, MIT’s lease expiry schedule presents as an opportunity rather than a pure risk. To understand more about the Singapore REIT sector, see our Singapore REIT ETF guide for a broader overview of industrial, commercial and retail REITs.
Gearing, Balance Sheet & Valuation
Both REITs operate well within MAS’s regulatory gearing limit of 50%, but their balance sheet profiles differ.
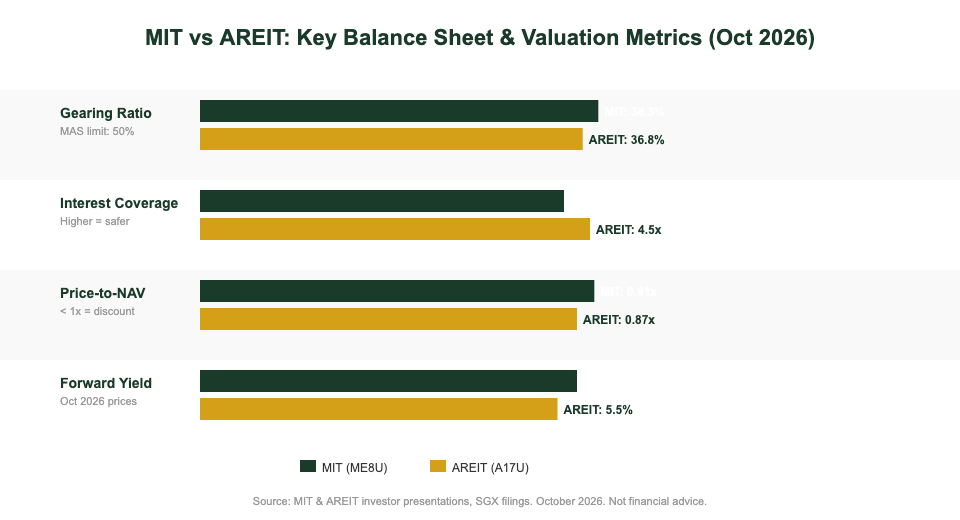
MIT’s gearing stood at approximately 38.3% as at Q2 FY2027, with interest coverage of ~4.2x. Approximately 77% of MIT’s debt is on fixed or hedged rates, providing protection against residual rate volatility. MIT has approximately S$1.5 billion of debt headroom before reaching the 45% soft ceiling that most Singapore REITs target. This headroom enables further data centre acquisitions in the US market — a pipeline that Mapletree’s sponsor regularly sources from its own development pipeline.
AREIT’s gearing is approximately 36.8%, with ~80% of debt on fixed/hedged rates and interest coverage of ~4.5x. Given AREIT’s S$17.7B asset base, its absolute debt headroom to the 45% soft ceiling is roughly S$1.45 billion. AREIT’s credit rating (Moody’s A3 / S&P A-) gives it access to capital markets at tighter spreads.
On valuation, both REITs trade at discounts to their respective net asset values as at October 2026 — a consequence of higher-for-longer interest rate expectations. The subsequent Fed rate cut cycle that began in September 2024 has provided partial relief:
| Valuation Metric | MIT (ME8U) | AREIT (A17U) |
|---|---|---|
| Share Price (Oct 2026) | ~S$2.35 | ~S$2.78 |
| NAV per Unit | ~S$2.58 | ~S$3.19 |
| Price-to-NAV | 0.91x | 0.87x |
| Forward Yield | ~5.8% | ~5.5% |
| 5-Year Total Return (Annualised) | ~4.2% | ~3.1% |
Source: SGX investor presentations, company filings. Prices approximate as at October 2026. Not financial advice — consult a financial adviser before investing.
AREIT trades at a slightly steeper discount to NAV (0.87x vs 0.91x), which can be read as a more compelling absolute value entry — but MIT’s higher yield and stronger five-year total return record suggest the market is pricing MIT’s data centre growth premium into a tighter P/NAV band.
Which Should You Buy in 2026?
There is no universally correct answer, but here is a simple decision framework.
Choose MIT (ME8U) if:
- You want a higher current yield (~5.8%) and are comfortable with Singapore + USA geographic concentration
- You believe in the AI data centre structural growth story and want indirect exposure through MIT’s US portfolio
- You prefer focused asset quality (hi-tech buildings + hyperscale data centres) over broad diversification
- You are comfortable with a shorter WALE (3.3 years) in exchange for potential positive rental reversion upside
Choose AREIT (A17U) if:
- You prioritise portfolio size, sponsor quality, and international diversification across four countries
- You want the strongest balance sheet in the Singapore industrial REIT space (A-rated credit, S&P A-)
- You prefer the slightly longer WALE (4.1 years) for greater near-term income certainty
- You are buying primarily for capital preservation with income, rather than income maximisation
Owning both is also a sensible strategy. MIT and AREIT are not pure substitutes: MIT’s US data centre concentration gives portfolio tilt toward tech infrastructure, while AREIT’s logistics and business park mix provides economic cycle resilience. You can start investing in Singapore REITs through the Endowus referral code (use code 2V343 for fee credits) or through the Syfe referral code (use SRPRFFFCD for bonus credits) — both platforms allow REIT exposure with low minimum investment thresholds.
For a broader framework on building S-REIT income, read our guide to passive income Singapore investors can generate through REITs, bonds, and dividend stocks in 2026.
Frequently Asked Questions
What is the difference between Mapletree Industrial Trust and Ascendas REIT?
Is Mapletree Industrial Trust a good buy in 2026?
What is Ascendas REIT's dividend yield?
How do I buy Mapletree Industrial Trust shares in Singapore?
Which is bigger — Mapletree Industrial Trust or Ascendas REIT?
Can I use CPF OA to invest in MIT or AREIT?
This article was researched with the help of AI. While we strive to keep all information accurate and up to date, there may be errors. If you notice any discrepancies, please contact us.