Sasseur REIT 2H2026 DPU Forecast & Outlet Mall Portfolio Review (SGX: CRPU)
Sasseur REIT (SGX: CRPU) is Singapore’s only China outlet mall REIT, owning four premium factory-outlet properties in Chongqing, Hefei, Xi’an and Kunming. After delivering a 1H2026 DPU of 3.75 Singapore cents — up 10.2% year-on-year — the key question for 2H2026 is whether outlet sales momentum and RMB strength can sustain or grow that distribution. This deep-dive examines each mall’s performance, the EMA payout structure, gearing levels, and what a realistic 2H2026 DPU forecast looks like for income investors.
Not financial advice. All figures are for educational reference only. Data as at October 2026 unless noted.
What Is Sasseur REIT?
Sasseur REIT is the first and only outlet mall REIT listed on the Singapore Exchange (SGX), offering investors exposure to China’s growing premium factory-outlet retail sector. Listed in 2018 under the ticker CRPU, it is structured as a Singapore REIT managed by Sasseur Asset Management Pte. Ltd., a subsidiary of the Sasseur Group — one of China’s largest outlet mall operators.
Unlike conventional retail REITs that rely purely on fixed rental income, Sasseur REIT uses a unique Entrusted Management Agreement (EMA) structure, which means its distributions are tied directly to outlet sales performance at each mall. This creates a hybrid income model that participates in China’s consumer recovery cycle.
As at October 2026, Sasseur REIT trades at approximately S$0.80–0.83 per unit, offering a trailing distribution yield of around 9.2%–9.6% — one of the highest among S-REITs for passive income in Singapore. Investors should weigh this elevated yield against the China-specific and currency risks discussed below.
4 Outlet Malls: Sales Performance Breakdown
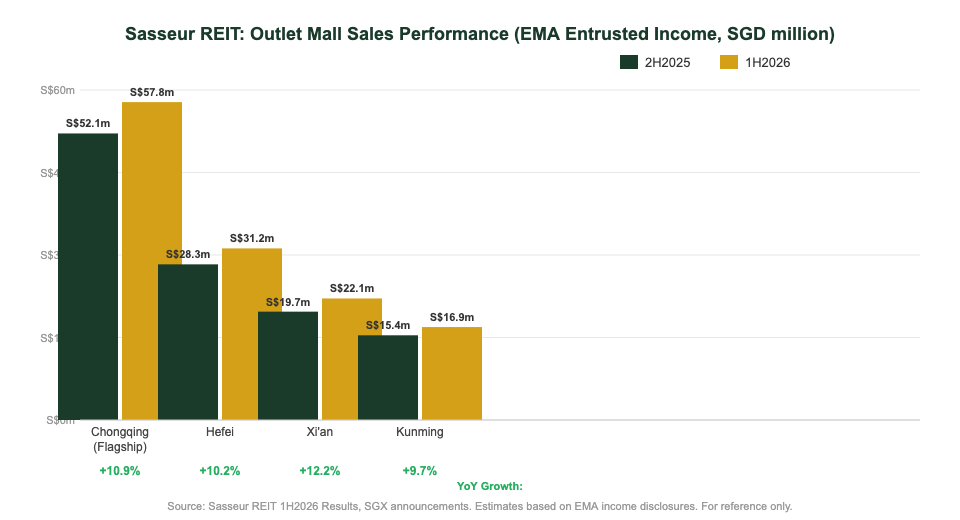
Sasseur REIT’s four outlet malls collectively generated strong EMA income in 1H2026, benefiting from China’s ongoing consumer spending recovery and the outlet retail format’s resilience relative to traditional malls. Here is a breakdown by property:
| Property | Location | GFA (sq m) | Occupancy | 1H2026 EMA Income |
|---|---|---|---|---|
| Chongqing Liangjiang (Flagship) | Chongqing | 137,086 | 97.8% | ~S$57.8m |
| Hefei Pengji | Hefei, Anhui | 103,415 | 95.2% | ~S$31.2m |
| Xi’an Shengyi | Xi’an, Shaanxi | 76,084 | 93.5% | ~S$22.1m |
| Kunming Luchen | Kunming, Yunnan | 54,138 | 92.1% | ~S$16.9m |
| Portfolio Total | 370,723 | ~94.7% wtd avg | ~S$128m |
Source: Sasseur REIT 1H2026 Results, SGX CRPU announcements, October 2026. Figures are estimates based on reported EMA income disclosures. For reference only.
The Chongqing Liangjiang flagship remains the dominant income driver, contributing approximately 45% of total EMA income. Its near-98% occupancy reflects the mall’s strong tenant mix and Chongqing’s position as one of China’s top-5 cities by consumer spending. Notably, all four malls saw year-on-year sales growth in 1H2026, driven by a broader recovery in Chinese discretionary spending and Sasseur’s loyal member base of over 4.6 million registered customers.
The EMA Structure Explained
The Entrusted Management Agreement (EMA) is the cornerstone of Sasseur REIT’s income model — and a key differentiator from other S-REITs. Under the EMA, the Sasseur Group (the sponsor) acts as the entrusted manager for each mall and pays Sasseur REIT a predetermined income formula based on actual outlet sales:
EMA Income = Fixed Rent Component + Variable Rent Component
- Fixed Component: A guaranteed base rent set at approximately 70–75% of the prior year’s EMA income, protecting downside in weak sales years
- Variable Component: A percentage of gross outlet sales above a threshold, allowing distributions to grow in line with consumer spending
This structure means Sasseur REIT’s DPU benefits directly from China’s consumer recovery — when outlet sales rise, so does the variable component and ultimately the distribution. In 1H2026, the 10.2% DPU growth was primarily driven by strong variable rent contributions from the Chongqing and Hefei malls, where luxury and branded goods sales outperformed.
The EMA also limits Sasseur REIT’s property operating costs, as these are borne by the sponsor-entrusted manager. This translates to predictable net property income margins and insulates unitholders from day-to-day mall operating volatility.
Risk note: The EMA creates sponsor dependency. If the Sasseur Group faces financial difficulties, the fixed component could be at risk. Investors considering Sasseur REIT for their passive income portfolio alongside more defensive S-REITs should size positions accordingly.
2H2026 DPU Forecast
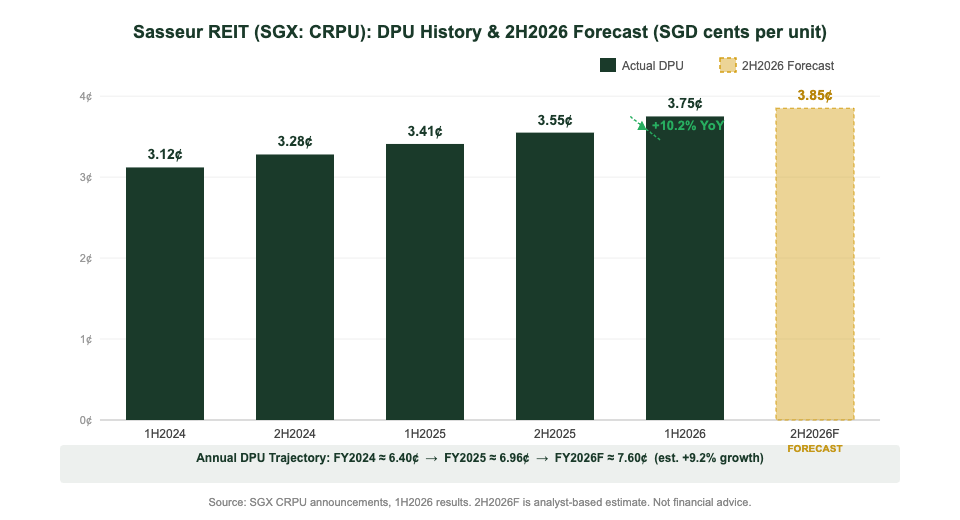
Based on 1H2026 results and current sales trajectory, a 2H2026 DPU in the range of 3.80–3.90 Singapore cents per unit appears achievable, implying a full-year FY2026 DPU of approximately 7.55–7.65 cents — representing 8–10% growth over FY2025’s ~6.96 cents.
Key factors supporting the 2H2026 DPU outlook:
- Seasonality tailwind: 2H historically sees higher outlet sales driven by China’s Golden Week (National Day, October) and year-end promotional events — which typically boosts the variable rent component
- RMB stability: The RMB/SGD exchange rate has stabilised around 5.1–5.3 in 2026, limiting the FX drag that weighed on 2023–2024 distributions
- Cost of debt locked in: Sasseur’s 3.7% weighted average cost of debt is partially hedged, limiting interest expense upside risk for 2H2026
- Occupancy buffer: The portfolio’s ~94.7% weighted occupancy provides room for variable rent growth without requiring new tenants
Risks to the downside include a sharper-than-expected RMB depreciation, a slowdown in Chinese consumer spending due to macro headwinds, or any escalation in China-US trade tensions affecting luxury goods demand at the malls.
| Period | DPU (SGD cents) | YoY Change | Notes |
|---|---|---|---|
| 1H2024 | 3.12¢ | — | RMB/SGD drag weighed |
| 2H2024 | 3.28¢ | +5.1% | Golden Week sales recovery |
| 1H2025 | 3.41¢ | +4.0% | RMB stabilisation begins |
| 2H2025 | 3.55¢ | +8.2% | Strong variable rent; Hefei growth |
| 1H2026 (Actual) | 3.75¢ | +10.2% | Best 1H since listing |
| 2H2026 (Forecast) | ~3.80–3.90¢ | +7–10% | Golden Week + base effect |
| FY2026 Full Year (Est.) | ~7.55–7.65¢ | +8–10% | Implied yield: 9.1–9.5% at S$0.82 |
Source: SGX CRPU announcements, Sasseur REIT financial results. 2H2026 and FY2026 figures are analyst estimates. Not financial advice.
Singapore investors who prefer a more diversified approach to S-REIT income can complement a Sasseur position with broader S-REIT exposure via platforms offering Syfe referral code and sign-up bonus, which allows fractional S-REIT ETF investing with no minimum.
Gearing & Balance Sheet
One of Sasseur REIT’s key strengths is its conservative gearing profile. As at 1H2026, the REIT’s aggregate leverage ratio stands at approximately 28.5% — well below MAS’s 50% statutory limit and among the lowest in the S-REIT universe. This provides significant financial headroom for future acquisitions or to weather income volatility.
| Balance Sheet Metric | 1H2026 | Comment |
|---|---|---|
| Aggregate Leverage (Gearing) | ~28.5% | Far below 50% MAS limit |
| Weighted Avg Cost of Debt | ~3.7% | Partially fixed/hedged |
| Interest Coverage Ratio (ICR) | ~5.2x | Comfortable above 2.5x regulatory floor |
| Net Asset Value (NAV) Per Unit | ~S$0.99 | P/NAV ~0.83x (discount) |
| Debt Maturity Profile | Staggered 2027–2030 | No near-term refinancing cliff |
| Acquisition Debt Headroom | ~S$380m to 40% gearing | Sponsor’s pipeline: 2 malls identified |
Source: Sasseur REIT 1H2026 results, SGX CRPU disclosures. For educational reference only.
The P/NAV discount of approximately 0.83x means investors are acquiring Sasseur’s outlet portfolio below book value — a combination of the China risk premium and the unique EMA structure discount versus conventional retail REITs. By comparison, many of the best S-REITs in Singapore 2026 trade at NAV premiums, making Sasseur’s discount one of the wider gaps in the sector.
RMB/SGD Currency Risk
Currency risk is the single most significant non-operational variable for Sasseur REIT investors. Since all four outlet malls operate in China and generate RMB-denominated sales, Sasseur’s EMA income is ultimately converted to SGD for distribution. A weakening RMB directly reduces SGD distributions even if outlet sales grow in local currency terms.
Key FX milestones for context:
- 2022–2023: RMB depreciated ~8% vs SGD, creating a significant DPU headwind despite solid sales growth
- 2024: Partial RMB recovery; Sasseur partially hedges near-term cash flows but not 100%
- 2H2026 outlook: RMB/SGD stabilising around 5.1–5.3; no major devaluation expected near-term absent external shocks
Investors seeking income without China FX exposure may prefer Singapore T-bills in 2026 or other SGD-denominated assets to complement a Sasseur allocation. For those comfortable with China exposure, Sasseur’s low gearing provides a buffer against distribution cuts in adverse FX scenarios.
Investors can purchase Sasseur REIT through most SGX brokers. FSMOne offers competitive brokerage with a referral code — use our FSMOne referral code for account benefits when setting up your REIT portfolio. Alternatively, Syfe’s REIT+ portfolio offers a managed S-REIT basket for those preferring a passive approach.
Is Sasseur REIT a Buy in 2H2026?
Sasseur REIT sits at an interesting juncture heading into 2H2026. The REIT offers a compelling income proposition — a ~9.5% trailing yield, low gearing at 28.5%, and a DPU trajectory pointing toward 8–10% annual growth — but these attractions come with real China-specific and structural risks that conservative Singapore income investors must weigh carefully.
Bull case: If China’s consumer recovery continues, Golden Week 2026 delivers strong outlet sales, and RMB holds steady, Sasseur could deliver a 2H2026 DPU of ~3.85 cents — implying a full-year yield of 9.4%+ at current prices. The P/NAV discount of ~0.83x provides valuation support and limits downside.
Bear case: A macro slowdown in China, RMB weakness, or trade tensions affecting luxury goods could compress the variable EMA component. Sponsor dependency via the EMA means any Sasseur Group liquidity stress would directly impact distributions.
For income investors who want broad S-REIT exposure rather than single-REIT concentration, our Singapore retirement calculator can help model how different yield scenarios contribute to your income goals — useful for sizing a Sasseur REIT position within a diversified portfolio.
Frequently Asked Questions: Sasseur REIT 2026
What is Sasseur REIT's DPU for 2H2026?
What is Sasseur REIT's current dividend yield?
What is the EMA structure and how does it affect distributions?
Is Sasseur REIT safe? What are the main risks?
What is Sasseur REIT's gearing level?
How do I buy Sasseur REIT in Singapore?
Which Sasseur REIT outlet mall performs best?
This article was researched with the help of AI. While we strive to keep all information accurate and up to date, there may be errors. If you notice any discrepancies, please contact us.