VWRA DCA Calculator: What SGD 1,000/Month Really Becomes by 2036, 2041 & 2046
The real compounding math behind a monthly VWRA investment plan — worked SGD examples, assumptions explained, and how the numbers compare to cash and T-bills.
Investing SGD 1,000 a month into VWRA (Vanguard FTSE All-World UCITS ETF, TER 0.14% p.a.) at an assumed 7-11% annual return grows to roughly S$171,000-S$211,000 after 10 years, S$311,000-S$433,000 after 15 years, and S$508,000-S$809,000 after 20 years, using monthly compounding — before brokerage fees and FX spread, and with no guarantee that future returns will match these assumptions.
Not financial advice. All figures are illustrative educational projections, not guarantees of future performance. Data as at September 2026 unless noted.
Table of Contents
Contents — Click to expand
Why Most Investors Never Actually Model Their VWRA Returns
Singapore investors who buy VWRA ETF on the London Stock Exchange typically know the pitch: one ETF, roughly 3,700+ global stocks, Ireland-domiciled, accumulating (dividends reinvested automatically, no distributions paid out). What most never do is sit down and work out what a recurring monthly contribution actually turns into over a realistic time horizon. The result is either unrealistic expectations (extrapolating a strong recent bull run indefinitely) or under-confidence (assuming compounding “doesn’t really matter” over 10-15 years). Both are wrong, and both lead to poor decisions — either overinvesting into a single volatile asset or under-contributing because the payoff feels abstract.
This guide works through the actual formula behind a VWRA dollar-cost averaging (DCA) plan, shows the SGD outcomes under three return scenarios, and places those numbers in the context of Singapore-specific considerations: currency exposure, tax treatment, and where to actually execute the monthly buys.
How the DCA Compounding Math Works
The future value (FV) of a fixed monthly contribution invested at a constant assumed annual return, compounded monthly, follows a standard annuity formula: FV = P × [((1 + r)^n − 1) / r], where P is the monthly contribution, r is the monthly rate of return (the annual rate converted to a monthly equivalent), and n is the number of months. This is the same formula that underlies most retirement and investment calculators — including our own Singapore retirement calculator — and it applies equally to a VWRA monthly buy plan.
The key input that determines the outcome isn’t the formula — it’s the assumed annual return, and this is where most online calculators mislead investors by picking one optimistic number. VWRA tracks the FTSE All-World Index. According to justETF fund data for the underlying Vanguard FTSE All-World UCITS ETF (ISIN IE00BK5BQT80, same fund as VWRA’s USD share class on the LSE), calendar-year returns were +8.36% in 2025, +24.65% in 2024, +17.78% in 2023, and -13.01% in 2022 — illustrating that annual returns swing widely around any long-term average. Since the fund’s inception in July 2019 through August 2026, cumulative return was +137.42%, which annualises to roughly 12.9% — a figure inflated by an unusually strong seven-year bull run and not a number that should be extrapolated forward. Long-run historical data for global equity indices (spanning multiple decades and several bear markets) points to a more sustainable range of roughly 7-9% nominal annual return. This guide therefore models three scenarios — 7%, 9%, and 11% — rather than presenting a single number as fact.
| Input | Value Used |
|---|---|
| Monthly contribution | SGD 1,000 |
| VWRA TER | 0.14% p.a. (source: justETF/Vanguard fund data, Sept 2026) |
| Assumed annual return (net of TER) | 7% / 9% / 11% scenarios |
| Compounding frequency | Monthly |
| Excludes | Brokerage commissions, FX conversion spread, platform fees |
Source: The Kopi Notes calculation using justETF fund data for Vanguard FTSE All-World UCITS ETF (IE00BK5BQT80), September 2026.
SGD 1,000/Month VWRA Projection: 10, 15 & 20 Years
Applying the formula above to a SGD 1,000 monthly contribution, here is what accumulates by year 10 (2036), year 15 (2041), and year 20 (2046) under each return scenario:
| Horizon | Total Contributed | At 7% p.a. | At 9% p.a. | At 11% p.a. |
|---|---|---|---|---|
| 10 years (2036) | S$120,000 | S$171,030 | S$189,730 | S$210,590 |
| 15 years (2041) | S$180,000 | S$311,110 | S$366,700 | S$433,320 |
| 20 years (2046) | S$240,000 | S$507,500 | S$638,990 | S$808,660 |
Source: The Kopi Notes calculation, FV = P×[((1+r)^n−1)/r], monthly compounding. Illustrative only — not a guarantee of future returns. September 2026.
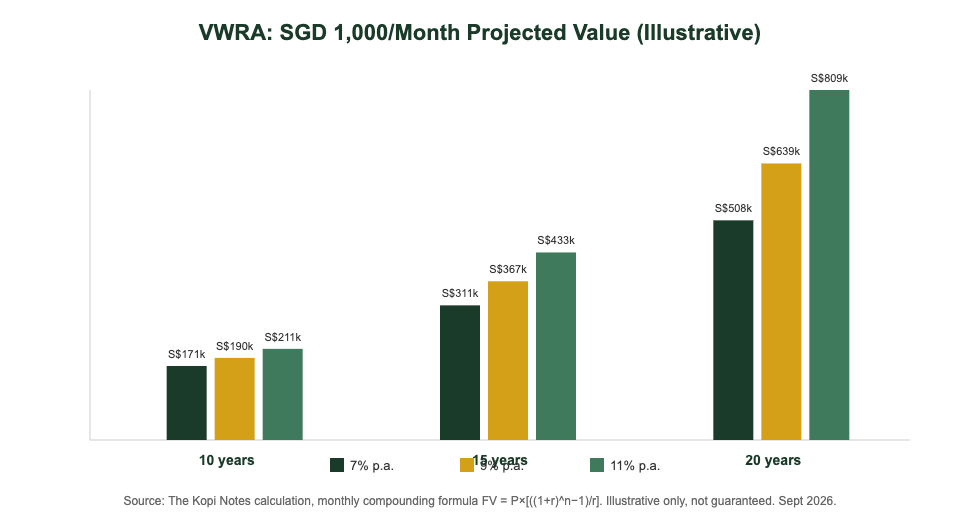
The gap between the 7% and 11% scenarios widens dramatically over time — a S$39,560 difference at 10 years becomes a S$301,160 difference at 20 years. This is the practical lesson of compounding: the assumed return matters far more over long horizons than it does over short ones, which is exactly why a single “average return” headline figure from a fund factsheet can be misleading if taken as a promise rather than a scenario.
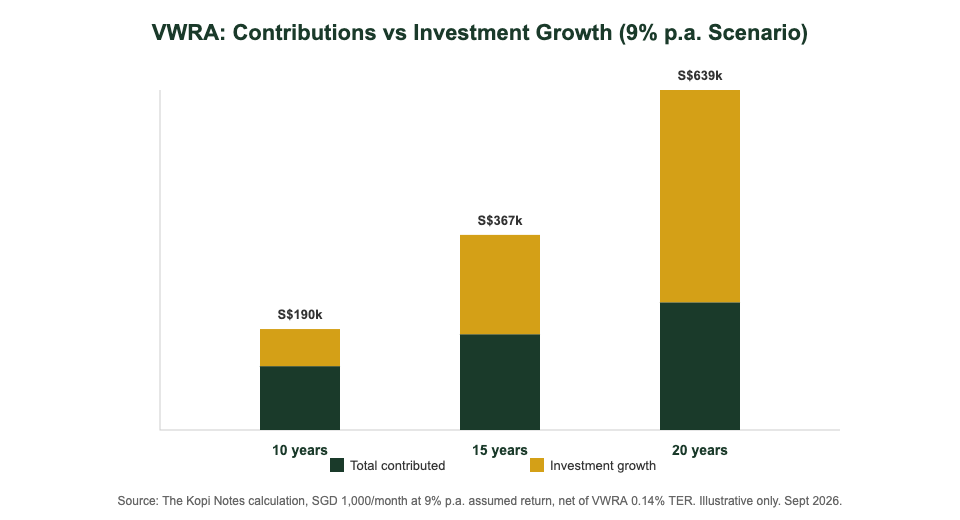
At the 9% scenario specifically — roughly the midpoint of the realistic range — the S$366,700 accumulated after 15 years breaks down into S$180,000 of actual contributions and S$186,700 of investment growth. In other words, slightly more than half of the final balance at that horizon comes from market growth rather than money paid in, which only happens because the contributions were left to compound rather than withdrawn.
Singapore Context: Tax, Currency & Where to DCA VWRA
For a Singapore resident, a VWRA DCA plan sits inside a specific tax and currency framework that changes the effective outcome slightly from the raw projection above. VWRA is domiciled in Ireland and listed on the LSE in USD, which under the US-Ireland tax treaty means US-sourced dividends inside the fund suffer 15% withholding tax before being reinvested — versus 30% for a comparable US-domiciled ETF. Because VWRA is accumulating, there is no distribution paid out to the investor, so there is no personal dividend tax event in Singapore (which does not tax capital gains or foreign-sourced investment income for individuals in most cases) — the withholding tax is already deducted at fund level before it reaches the investor.
Currency is the other factor the raw SGD projection above simplifies. A Singapore investor typically converts SGD to USD to buy VWRA, meaning the actual SGD value of the holding at any point also depends on the SGD/USD exchange rate, not just the fund’s USD-denominated return. Over a 10-20 year horizon this can meaningfully move the final number in either direction and is a real risk the calculator above does not capture — it assumes the growth rate already nets out to an SGD-equivalent figure, which will not hold exactly in practice.
On execution: VWRA can be bought monthly through brokers such as Interactive Brokers (IBKR), Saxo Markets, moomoo Singapore, or via a fractional/robo platform. For investors who want the DCA plan automated rather than manually placing a monthly LSE order themselves, a platform-based approach through Syfe removes the manual order-placing step, though direct brokers typically carry lower ongoing costs for larger portfolios. VWRA itself is not CPF-investable, but SRS funds can be used to buy VWRA through brokers that support SRS-linked trading, which is worth checking against your CPF investment strategy if you’re deciding how to split contributions between CPF-eligible and SRS/cash-funded instruments.
VWRA DCA vs Cash Savings & T-Bills
To put the projection in perspective, the same SGD 1,000/month contributed to a risk-free instrument instead of VWRA produces a very different outcome. Singapore T-bills have recently yielded in the region of 2.5-3.5% per annum, and ordinary savings accounts typically pay well under 1%.
| Instrument | Assumed Return | Value After 15 Years | Risk Profile |
|---|---|---|---|
| Savings account | ~0.5% p.a. | ~S$186,900 | Capital guaranteed, SDIC-insured up to S$100k |
| Singapore T-bills | ~3% p.a. | ~S$227,900 | Backed by Singapore Government, near risk-free |
| VWRA (9% scenario) | ~9% p.a. | ~S$366,700 | Full equity market volatility, no capital guarantee |
Source: The Kopi Notes calculation. T-bill and savings account yields are approximate 2026 reference points and fluctuate with MAS auction results and bank rates.
The higher expected long-run return from VWRA comes with real trade-offs: a global equity ETF can and does fall 15-20% or more in a single year (as it did in 2022, at -13.01%), whereas T-bills and savings deposits do not lose nominal value. The right split between the two depends on time horizon and risk tolerance rather than the projection alone — someone drawing down the funds within 3-5 years should weight far more heavily toward T-bills or cash than someone investing for a 20-year horizon.
Setting Up Your Own VWRA DCA Plan
Three practical steps for an investor who wants to act on this: first, decide the monthly amount based on what can be sustained through a market downturn without needing to sell — a plan that gets interrupted during a -13% year like 2022 loses most of its compounding benefit. Second, pick a broker or platform and automate the purchase date each month rather than relying on manual discipline; IBKR and Saxo support recurring investment plans directly in USD on the LSE, while moomoo and Syfe offer more beginner-friendly interfaces. Third, revisit the assumed return periodically rather than anchoring to the most recent strong year — the since-inception 12.9% figure for VWRA reflects an unusually favourable 2019-2026 period and should not be treated as a baseline expectation for the next 10-20 years.
Frequently Asked Questions
How much will SGD 1,000/month in VWRA be worth in 10 years?
Assuming a 7-11% annual return net of VWRA’s 0.14% TER, SGD 1,000 invested monthly grows to roughly S$171,000-S$211,000 after 10 years (against S$120,000 in total contributions), using monthly compounding. This is an illustrative projection, not a guaranteed outcome — actual returns depend on market performance over the period.
What return rate should I actually assume for VWRA?
VWRA’s since-inception annualised return (July 2019-August 2026) has been roughly 12.9%, but this reflects an unusually strong seven-year bull market and includes a sharp -13.01% year in 2022. Long-run global equity index history suggests a more sustainable planning range of 7-9% per annum is more appropriate than extrapolating the recent bull run forward.
Does the VWRA projection include brokerage fees and FX spread?
No. The projections in this guide model only the compounding of contributions and assumed market return, net of VWRA’s 0.14% p.a. total expense ratio. They exclude brokerage commissions, the SGD/USD foreign exchange spread charged by your broker, and any platform fees, all of which will reduce the actual net outcome somewhat.
Is a lump sum better than DCA into VWRA?
Historically, investing a lump sum immediately tends to outperform spreading it out via DCA in expectation, because markets rise more often than they fall over long periods. However, DCA reduces the risk of investing a large sum right before a downturn and suits investors adding new savings progressively from income rather than sitting on a lump sum already, which is the more common real-world situation this guide addresses.
Can I use SRS funds to dollar-cost average into VWRA?
Yes, provided your brokerage supports SRS-linked trading for LSE-listed securities — not all Singapore brokers do. VWRA itself is not CPF-investable under the CPF Investment Scheme, so CPF funds cannot be used directly for a VWRA DCA plan.
How does VWRA's DCA outcome compare to Singapore T-bills?
At a 3% assumed T-bill yield, the same SGD 1,000/month plan reaches roughly S$227,900 after 15 years, compared with roughly S$366,700 for VWRA at a 9% assumed return — but T-bills carry no capital risk while VWRA is subject to full equity market volatility, including years of double-digit losses.
Ready to Start Your VWRA DCA Plan?
Compare brokers, read the full VWRA guide, or model your own retirement numbers.
This article was researched with the help of AI. While we strive to keep all information accurate and up to date, there may be errors. If you notice any discrepancies, please contact us.