VWRA vs CSPX: Which ETF Is Better for Singapore Investors? (2026)
The definitive side-by-side comparison — costs, taxes, performance, and which fund suits your portfolio.
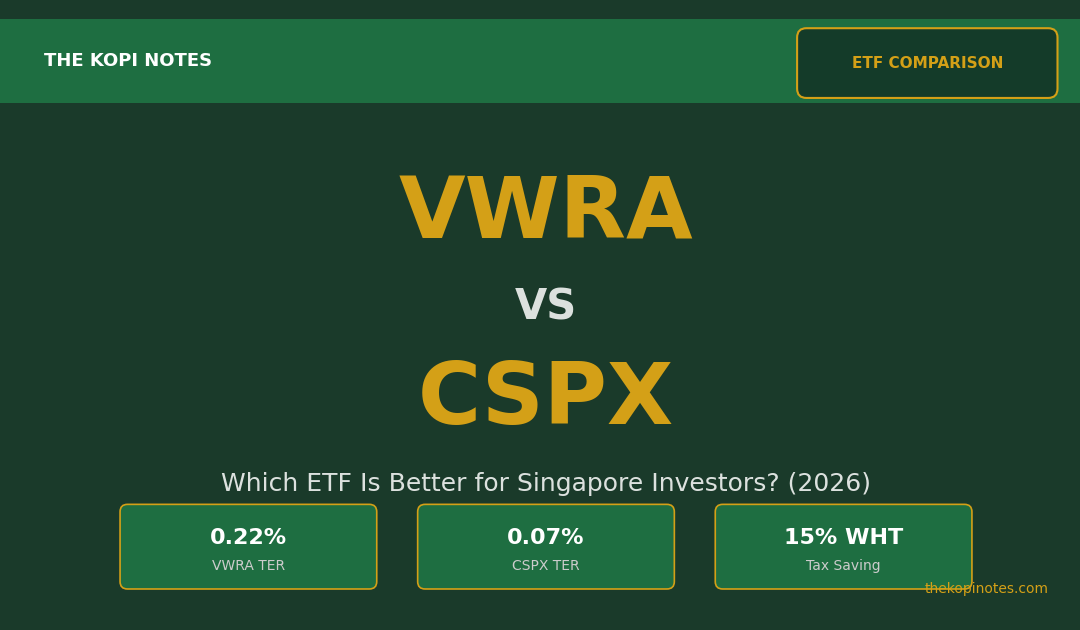
For most Singapore investors, CSPX is the better choice if you want pure US equity exposure at the lowest cost (0.07% TER, 26.6% one-year return). VWRA is better if you want true global diversification across 3,900 holdings in nearly 50 countries (0.22% TER, 21.5% one-year return). Both are Ireland-domiciled UCITS ETFs on the London Stock Exchange, meaning Singapore investors pay only 15% US dividend withholding tax — half the 30% rate on US-listed equivalents — with zero US estate tax risk.
Not financial advice. All figures are for educational reference only. Data as at April 2026 unless noted.
Table of Contents
Quick Answer: VWRA vs CSPX
Both CSPX and VWRA are outstanding choices for Singapore investors, but they serve different investment philosophies. CSPX (iShares Core S&P 500 UCITS ETF) concentrates your capital entirely on the 503 largest US companies. VWRA (Vanguard FTSE All-World UCITS ETF) spreads your investment across nearly 3,900 companies in developed and emerging markets worldwide.
The decision hinges on one core question: do you believe the US will continue dominating global equity returns, or do you prefer the insurance policy of international diversification? In early 2026, as US markets have surged through the AI boom, CSPX has delivered superior absolute returns. But VWRA investors own the entire investable world — reducing single-country concentration risk. To understand why Singapore investors buy ETFs on the London Stock Exchange, both funds benefit from the same Ireland-US tax treaty that halves your withholding tax bill.
Key Differences at a Glance
| Feature | CSPX | VWRA |
|---|---|---|
| Full Name | iShares Core S&P 500 UCITS ETF USD (Acc) | Vanguard FTSE All-World UCITS ETF USD (Acc) |
| Index Tracked | S&P 500 | FTSE All-World |
| Number of Holdings | ~503 | ~3,900 |
| TER (Expense Ratio) | 0.07% p.a. | 0.22% p.a. |
| AUM | USD 135 billion (Q1 2026) | USD 35 billion (Q1 2026) |
| Domicile | Ireland | Ireland |
| Structure | Accumulating | Accumulating |
| Currency | USD | USD |
| Geographic Exposure | 100% United States | ~60% US, ~40% International |
| US Dividend WHT | 15% | 15% (on US portion) |
| US Estate Tax | None | None |
| Launch Date | May 2010 | July 2019 |
Source: iShares CSPX factsheet and Vanguard VWRA factsheet, April 2026
Tax & Cost Comparison for Singapore Investors
Tax efficiency is where both CSPX and VWRA shine for Singapore investors. Both are Ireland-domiciled, which triggers the Ireland-US tax treaty. This treaty limits US dividend withholding tax to 15% — a game-changer compared to the 30% withholding rate on US-domiciled ETFs like VOO or SPY. If you haven’t read our CSPX vs VOO comparison, it explains exactly why this difference matters so much.
The critical distinction between CSPX and VWRA on tax: CSPX holds 100% US equities, so virtually all dividend income faces the 15% treaty withholding at the fund level. VWRA holds approximately 60% US and 40% non-US stocks — only the US portion attracts the 15% Ireland-US treaty rate. Non-US dividends have varying withholding rates depending on country of origin, typically 10–20% for developed markets.
Worked example: A Singapore investor with SGD 100,000 in each ETF, assuming both generate 1.5% annual gross dividends:
| Scenario (SGD 100,000) | CSPX (100% US) | VWRA (60% US, 40% Intl) |
|---|---|---|
| Gross Dividend (1.5%) | SGD 1,500 | SGD 1,500 |
| Blended WHT Rate | 15.0% | ~17.0% (15% on US, ~20% avg on intl) |
| WHT Paid Annually | SGD 225 | SGD 255 |
| Net Dividend Retained | SGD 1,275 | SGD 1,245 |
| 10-Year Cumulative WHT Saved (CSPX vs VWRA) | SGD 300 — modest but real over a decade | |
Source: Ireland-US bilateral tax treaty analysis; typical international WHT rates for developed/emerging markets, April 2026. Assumes 1.5% gross dividend yield.
Neither fund exposes you to US estate tax — a critical advantage over US-domiciled alternatives. Both are Ireland-registered UCITS, so your holdings pass to beneficiaries without triggering the US federal estate tax that affects American ETFs (VOO, SPY, VTI) on estates exceeding USD 60,000 for non-US persons.

Historical Performance Comparison
Performance tells a striking story in early 2026. The S&P 500’s dominance through the AI boom has powered CSPX to substantial outperformance across all timeframes:
| Time Period | CSPX Return | VWRA Return | Difference |
|---|---|---|---|
| 1-Year (to Q1 2026) | 26.6% | 21.5% | +5.1% |
| 3-Year Annualised | 13.7% | 10.8% | +2.9% |
| 5-Year Annualised | 17.5% | 13.5% | +4.0% |
Source: iShares and Vanguard factsheets, April 2026. Total return net of fees with distributions reinvested.
In SGD terms, this gap is even more pronounced. A Singapore investor who put SGD 100,000 into CSPX five years ago would have approximately SGD 222,500 today (at 17.5% annualised). The same amount in VWRA would be worth approximately SGD 189,200 (at 13.5% annualised) — a SGD 33,300 difference. That is a significant amount, though past performance does not guarantee future results.
However, this outperformance is backward-looking. History shows mean reversion: periods of US dominance (like 2015–2025) are often followed by international catch-up. VWRA’s 3,900-stock, multi-country portfolio historically shows lower drawdowns during US-specific selloffs, though this advantage disappears during synchronised global bear markets.

Total Cost of Ownership: TER, Trading Costs, and FX
Cost is the only investment variable you can fully control. CSPX’s 0.07% TER is extraordinarily low — on a SGD 100,000 position, that is SGD 70 annually in management fees versus VWRA’s SGD 220. Over 30 years on a SGD 500,000 portfolio, the TER difference alone compounds to approximately SGD 22,500.
Singapore brokers handling LSE-listed ETFs charge the following commissions: Interactive Brokers (IBKR) charges approximately GBP 1.70 per trade (~SGD 3.20), making it the most cost-effective for larger purchases. MooMoo charges GBP 1.49 flat (~SGD 2.80). Saxo charges 0.08% with a GBP 3 minimum. If you prefer zero per-trade commissions, platforms like Syfe bake costs into their annual platform fee (0.65%) — use our Syfe referral code for a sign-up bonus.
Currency conversion adds another layer. Both ETFs trade in USD, so your SGD converts at the broker’s FX rate. IBKR offers the tightest spread at approximately 0.002% per conversion. Saxo and MooMoo typically add 0.05–0.10%. On a SGD 100,000 purchase via IBKR, your total first-year cost breaks down as: SGD 70 TER (CSPX) or SGD 220 TER (VWRA), plus approximately SGD 3.20 commission, plus SGD 2 FX cost. CSPX’s total cost: roughly SGD 75. VWRA’s total cost: roughly SGD 225. The gap is almost entirely the TER difference.
For a long-term buy-and-hold investor using IBKR, CSPX costs approximately 0.075% annually versus VWRA’s 0.225%. Both are extremely cheap by global standards, but CSPX’s cost advantage is real. Use our Singapore retirement calculator to model how these cost differences compound over your specific investment horizon.
Who Should Pick Which?
Choose CSPX if you:
Believe the US market will continue outperforming. The S&P 500’s quality filter — market-cap weighting that naturally favours large, profitable firms — has proven remarkably durable. If you are convinced US tech and multinational corporates remain the engine of global growth, CSPX is your core holding. Read our full CSPX ETF Singapore guide for a deep-dive on the fund.
Want maximum cost efficiency. CSPX’s 0.07% TER is among the lowest in the world. Over 30 years on a SGD 1 million portfolio, you save approximately SGD 45,000 in fees compared to VWRA.
Prefer simplicity. 503 large-cap US stocks are easier to understand and track than 3,900 global names. You know exactly what you own: Apple, Nvidia, Microsoft, Amazon, Meta, Berkshire Hathaway.
Choose VWRA if you:
Want true global diversification. VWRA’s roughly 60% US and 40% international split across ~3,900 holdings is a genuine all-weather portfolio. You own European banks, Asian tech, emerging market growth stories, and defensive non-US healthcare — all in one fund. See our VWRA ETF Singapore guide for the complete breakdown.
Are suspicious of US valuations. After a five-year bull run, US equities trade at elevated multiples. VWRA offers a way to maintain equity exposure while diluting concentration in potentially overvalued US mega-caps.
Want implicit currency diversification. If the US dollar depreciates relative to SGD, VWRA’s 40% international holdings provide a natural hedge. CSPX investors face full USD exposure.
The Hybrid Approach
Many experienced Singapore investors hold both. A common allocation is 70% CSPX and 30% VWRA, which gives you approximately 82% US exposure (70% direct + 30% × 60% from VWRA) and 18% international — a sensible middle ground. The blended TER comes to approximately 0.115% (weighted average), capturing both US dominance and international optionality.
Not financial advice. Past performance is not indicative of future results. Always do your own research or consult a licensed financial adviser before investing.
Frequently Asked Questions
What is the main difference between VWRA and CSPX?
CSPX tracks the S&P 500 (503 large-cap US companies), while VWRA tracks the FTSE All-World index (~3,900 companies across developed and emerging markets in nearly 50 countries). CSPX gives you concentrated US exposure at a lower 0.07% TER; VWRA gives you global diversification at 0.22% TER. Both are Ireland-domiciled, accumulating UCITS ETFs listed on the London Stock Exchange.
Which has lower fees — CSPX or VWRA?
CSPX has a significantly lower total expense ratio of 0.07% per annum, compared to VWRA’s 0.22% per annum. On a SGD 100,000 portfolio, that translates to SGD 70 versus SGD 220 annually — a SGD 150 difference. Over 20 years, this fee gap compounds to approximately SGD 3,000–4,500 depending on returns, making CSPX the clear winner on cost alone.
For Singapore investors, which ETF is more tax-efficient?
Both are highly tax-efficient for Singapore investors thanks to Ireland domicile (15% US dividend WHT instead of 30%). CSPX is marginally more tax-efficient because its blended withholding rate is a flat 15% on all dividends (100% US exposure). VWRA’s blended rate is approximately 17% because the 40% non-US portion attracts varying international withholding rates. The annual difference on a SGD 100,000 portfolio is approximately SGD 30 — small but real over decades.
Can I buy VWRA or CSPX using CPF or SRS funds?
Neither CSPX nor VWRA is CPF-approved (CPFIS) because they are LSE-listed foreign securities. You cannot buy them through your CPF Investment Account. However, both are compatible with SRS (Supplementary Retirement Scheme) investments through eligible brokers like Saxo and IBKR. For CPF-investable ETF options, consider CPF-approved Singapore-listed funds through FSMOne or DBS Vickers.
Is it better to invest in CSPX and VWRA together?
Yes, many Singapore investors use both. A common split is 70% CSPX (core US exposure) and 30% VWRA (global diversification), giving you approximately 82% US exposure with 18% international. This hybrid approach captures US market strength while providing geographic diversification at a blended TER of roughly 0.115%. It also provides implicit currency diversification beyond purely USD-denominated holdings.
What happens if I sell CSPX or VWRA at a profit in Singapore?
Singapore has no capital gains tax. If you buy CSPX at SGD 100,000 and sell at SGD 150,000, you owe zero tax on the SGD 50,000 gain. This applies to both CSPX and VWRA regardless of holding period. Both ETFs are accumulating, meaning dividends are automatically reinvested within the fund — no tax event occurs until you sell units, and even then Singapore imposes no capital gains tax on investment returns.
Ready to Start Investing in ETFs?
Both CSPX and VWRA are exceptional vehicles for Singapore investors. Open a brokerage account and buy your first ETF today.
This article was researched with the help of AI. While we strive to keep all information accurate and up to date, there may be errors. If you notice any discrepancies, please contact us.