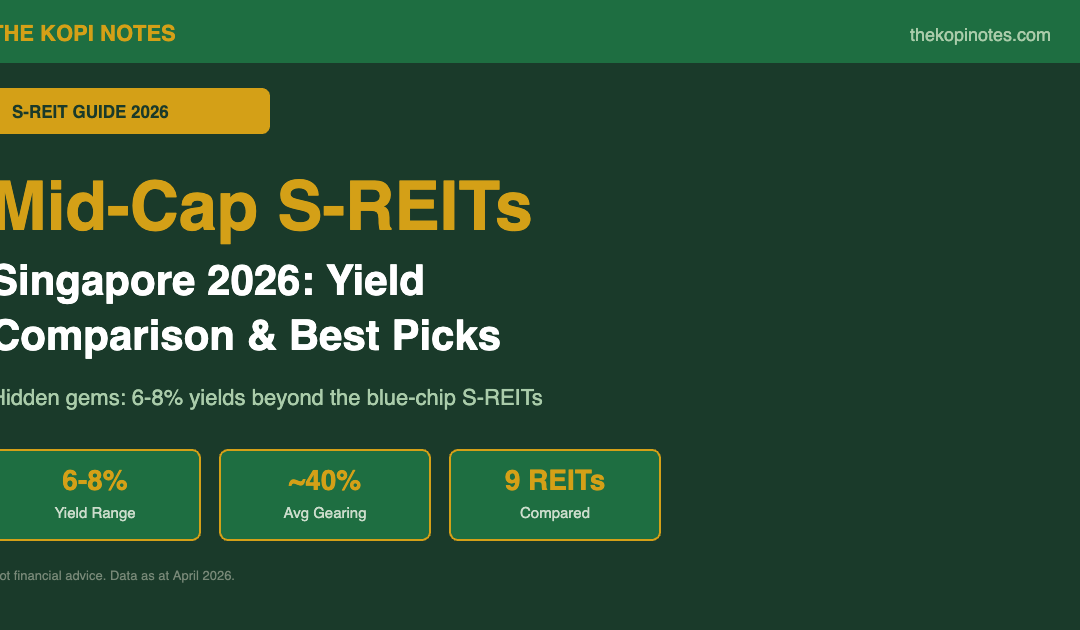
Mid-Cap S-REITs Singapore 2026: Yield Comparison, DPU Analysis & Best Picks
Beyond the blue chips, Singapore’s mid-cap S-REITs are quietly delivering 6–8% dividend yields. This guide compares 9 mid-cap S-REITs by yield, gearing, DPU trend and sector — so you can make an informed decision.
Not financial advice. Data as at April 2026. Yields are forward estimates based on latest DPU and unit prices. Always conduct your own due diligence.
Table of Contents
What Is a Mid-Cap S-REIT?
Singapore’s S-REIT universe is often divided into large-cap “blue chips” (CapitaLand Ascendas REIT, Mapletree Industrial Trust, Frasers Centrepoint Trust) and smaller, more niche trusts. Mid-cap S-REITs typically carry a market capitalisation of between S$500 million and S$3 billion, sitting in the sweet spot between liquidity and yield.
What makes mid-caps attractive in 2026? With the US Federal Reserve in a measured easing cycle and Singapore’s 10-year SGS bond yield hovering around 3.0–3.2%, the yield spread on mid-cap S-REITs remains wide. Many mid-caps trade at discounts to NAV and offer forward yields of 6–8% — meaningfully higher than the 4–5% you get from the large-cap names.
Mid-cap S-REITs also tend to benefit from active asset enhancement initiatives (AEIs) and smaller balance sheets that can respond quickly to acquisition opportunities. The trade-off: liquidity is thinner, gearing headroom can be tighter, and DPU growth may be lumpier.
In this guide, we compare 9 mid-cap S-REITs across retail, industrial, office, hospitality and overseas sectors — using the latest DPU data, gearing figures and analyst targets available as at April 2026.

Dividend Yield Comparison Table — April 2026
The table below compares 9 mid-cap S-REITs by forward dividend yield, latest DPU, approximate market cap and sector as at April 2026. Yields are calculated using each REIT’s latest annualised DPU divided by its unit price as at 28 April 2026.
| REIT (SGX) | Sector | Fwd Yield | DPU (ann.) | Unit Price | Mkt Cap |
|---|---|---|---|---|---|
| AIMS APAC REIT (O5RU) | Industrial | 6.84% | S$0.102 | S$1.50 | ~S$1.3B |
| Starhill Global REIT (P40U) | Retail | 6.70% | S$0.044 | S$0.655 | ~S$1.3B |
| Sasseur REIT (CRPU) | Retail (China) | 7.20% | S$0.060 | S$0.830 | ~S$0.8B |
| Far East Hospitality Trust (Q5T) | Hospitality | 6.50% | S$0.043 | S$0.660 | ~S$1.2B |
| IREIT Global (UD1U) | Office (Europe) | 5.40% | EUR 0.024 | S$0.420 | ~S$0.5B |
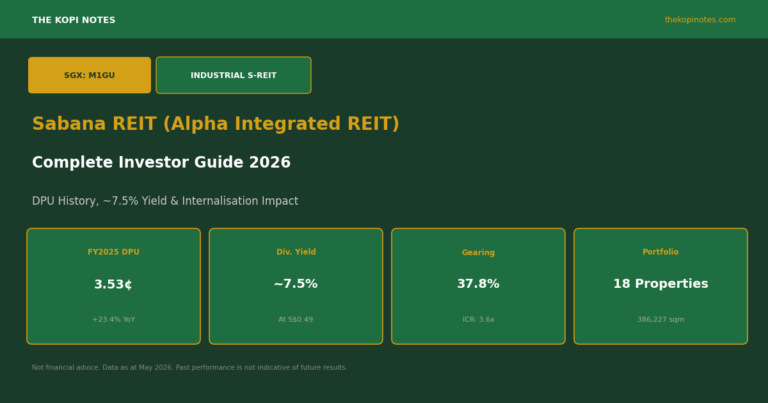
| Sabana REIT (M1GU) | Industrial | 7.10% | S$0.031 | S$0.435 | ~S$0.6B |
| Suntec REIT (T82U) | Office & Retail | 5.17% | S$0.077 | S$1.490 | ~S$4.0B |
| OUE REIT (TS0U) | Office & Hospitality | 6.90% | S$0.021 | S$0.305 | ~S$1.5B |
| Keppel DC REIT (AJBU) | Data Centre | 4.80% | S$0.103 | S$2.150 | ~S$4.5B |
*Keppel DC REIT and Suntec REIT are included for comparison — both are technically large-cap at current prices. DPU and unit prices as at 28 April 2026. Past distributions are not a guarantee of future payouts.

Gearing Ratio Comparison
Gearing (leverage) is one of the most important health metrics for any S-REIT. Under MAS regulations, S-REITs are permitted to gear up to 50% if they have a minimum interest coverage ratio (ICR) of at least 2.5x; the hard cap is 45% for REITs below the ICR threshold. A lower gearing ratio means more debt headroom for acquisitions and a larger buffer against falling asset valuations.
| REIT | Gearing | Cost of Debt | % Fixed Rate | Comment |
|---|---|---|---|---|
| AIMS APAC REIT | 34.8% | 3.6% | ~75% | Comfortable headroom; strong ICR |
| Starhill Global REIT | 36.0% | 3.4% | ~80% | Mostly fixed; low refinancing risk |
| Sasseur REIT | 24.5% | 3.2% | ~70% | Very low gearing; strong acquisition capacity |
| Far East Hospitality Trust | 38.0% | 3.8% | ~68% | Moderate gearing; benefit from rate cuts |
| IREIT Global | 37.9% | 2.8% | ~85% | EUR-denominated debt; FX risk managed |
| Sabana REIT | 35.0% | 4.1% | ~60% | Higher cost of debt; watch floating exposure |
| Suntec REIT | 42.2% | 3.5% | ~72% | Near upper-mid range; less headroom |
| OUE REIT | 40.5% | 3.7% | ~65% | Higher gearing; needs asset recycling |
| Keppel DC REIT | 29.6% | 3.0% | ~80% | Low gearing; acquisition-ready |
Sasseur REIT and Keppel DC REIT stand out for their low gearing — both below 30% — giving them significant room to acquire assets without diluting unitholders. On the other end, Suntec REIT and OUE REIT are running closer to 40–42%, leaving less buffer ahead of the MAS 45% cap. Unitholders in these REITs should monitor debt maturity schedules and refinancing costs closely.
Use our S-REIT Gearing Ratio & ICR Calculator to model how different leverage levels affect distribution sustainability.
Top Mid-Cap S-REIT Picks for 2026
Based on the combined yield, gearing headroom, DPU trajectory and sector tailwinds, here are our three standout mid-cap S-REITs for 2026. This is not financial advice — please do your own research.
1. AIMS APAC REIT (O5RU) — Industrial Diversification at 6.84%
AIMS APAC REIT owns a diversified portfolio of 31 industrial properties across Singapore and Australia. For 9M FY2026, it reported DPU of S$0.0725 per unit, up 2.5% year-on-year. Occupancy stands at 95.5% with positive rental reversions of +8.4% in Singapore. At a gearing of 34.8%, it has ample capacity to pursue acquisitions — particularly in Australia, where it has an existing pipeline. The REIT offers a forward yield of approximately 6.84% at current prices, making it one of the best risk-adjusted income plays in the mid-cap space. For more analysis, see our Best S-REITs Singapore 2026 guide.
2. Sasseur REIT (CRPU) — Highest Yield with China Recovery Tailwind at 7.20%
Sasseur REIT is the only outlet mall REIT listed on the SGX, giving it a unique exposure to China’s consumption recovery. Its entrusted management agreement (EMA) structure provides a degree of income certainty — a fixed component plus a variable component linked to outlet sales. The REIT owns four premium outlet malls in Chongqing, Hefei, Kunming and Bishan. As at FY2025, occupancy was above 97% and total tenant sales grew 8.2% YoY. With gearing at just 24.5%, Sasseur has the cleanest balance sheet in this peer group. The main risk: China macro uncertainty and CNY/SGD FX movements. For investors comfortable with China exposure, the ~7.2% yield is compelling. Check our Sasseur REIT deep-dive for the full breakdown.
3. OUE REIT (TS0U) — Singapore Office Recovery + Hospitality Upside at 6.90%
OUE REIT is a diversified REIT with Singapore CBD office and hospitality assets, including OUE Bayfront, One Raffles Place, Hilton Singapore Orchard and Crowne Plaza Changi Airport. The Singapore office market continues to see positive rental reversions — Grade A CBD rents rose approximately 4–6% in 2025 and are holding firm into 2026. Hilton Singapore Orchard, which completed its refurbishment in 2023, is now running at above 85% occupancy. At a forward yield of ~6.9%, OUE REIT offers a rare combination of Singapore office quality and hospitality upside at a mid-cap valuation. Gearing of 40.5% is the key risk to watch.
Sector Breakdown: Retail, Industrial, Office & Hospitality
Industrial Mid-Cap S-REITs
Industrial REITs benefit from Singapore’s strong manufacturing base, data centre demand and logistics growth. AIMS APAC REIT and Sabana REIT are the key mid-cap industrial names. AIMS APAC’s cross-border Australia exposure adds geographic diversification. Sabana REIT (recently rebranded as Alpha Integrated REIT) is undergoing a strategic repositioning — watch its next couple of financial results closely. Singapore industrial rents are expected to stay firm in 2026, supported by limited new supply and high pre-commitment rates.
Retail Mid-Cap S-REITs
Starhill Global REIT and Sasseur REIT represent the retail mid-cap universe. Starhill is a classic Singapore retail play centred on Wisma Atria and Ngee Ann City in Orchard Road — prime but mature. Sasseur is a China-focused growth story. Singapore retail sales have held up well into 2026 despite global macro headwinds, particularly in the luxury and dining segments. Use our REIT Dividend Yield Calculator to model your income from a mix of retail and industrial REITs.
Office & Hospitality Mid-Cap S-REITs
Suntec REIT, OUE REIT and IREIT Global represent the office and mixed-use segment. Singapore CBD office demand remains solid — prime rents are hovering above S$12 psf/month. Suntec City retail component also benefits from positive tenant sales. IREIT Global is an outlier: it invests primarily in European office assets and pays distributions in EUR, introducing FX risk for SGD-denominated investors. Far East Hospitality Trust rounds out the group with its Singapore-focused hotel and serviced residence portfolio — a clean, domestically-oriented hospitality play.
Data Centre Mid-Cap (Keppel DC REIT)
Keppel DC REIT sits at the intersection of the digital economy megatrend and traditional REIT income investing. At 4.8% forward yield, it is the lowest-yielding REIT in this list — but it commands a premium for its long weighted average lease expiry (WALE) and blue-chip tenants. Given its ~S$4.5B market cap, it is technically large-cap, but we include it as a benchmark for the data centre sector. AI-driven demand for data centre capacity continues to drive occupancy and rental rate growth globally.
Key Risks for Mid-Cap S-REITs
Interest Rate Risk: While the Fed has started cutting, rates remain elevated by historical standards. Mid-cap REITs with higher proportions of floating-rate debt (like Sabana REIT at ~40% floating) are more exposed to near-term cost pressures. Always check the weighted average debt maturity and the % of debt on fixed rates.
Liquidity Risk: Mid-cap REITs trade with smaller daily volumes than blue chips. This means bid-ask spreads are wider and it can take longer to build or exit a position. For retail investors, this is less of a concern, but institutional money tends to prefer the larger names.
Overseas Exposure: IREIT Global (Europe) and Sasseur REIT (China) carry FX risk. A strengthening SGD vs EUR or CNY will reduce the SGD-equivalent distributions. IREIT’s EUR distributions are particularly sensitive given the EUR/SGD movement in 2024–2025.
Gearing Headroom: Suntec REIT and OUE REIT at 40–42% gearing have less room to raise debt for acquisitions. If asset values fall, their gearing could rise uncomfortably close to the MAS limit, potentially forcing equity fundraising (which dilutes unitholders). Use our Gearing Ratio Calculator to stress-test different scenarios.
DPU Sustainability: Some mid-cap S-REITs have had to cut distributions during periods of high vacancies or tenant distress. Always check the distribution payout ratio and whether distributions include return of capital (which is not sustainable income). Our REIT Dividend Yield Calculator can help you model different DPU scenarios.
How to Invest in Mid-Cap S-REITs
Mid-cap S-REITs are listed on the Singapore Exchange (SGX) and can be bought through any SGX-listed brokerage account. Here are the most common options for Singapore investors in 2026:
Direct stock purchase: Buy individual REIT units on SGX via a CDP-linked brokerage (DBS Vickers, OCBC Securities, UOB Kay Hian) or a custodian brokerage (Tiger Brokers, moomoo, Interactive Brokers). Minimum lot size is 100 units. At S$1.50/unit for AIMS APAC REIT, that’s S$150 for one lot — very accessible.
REIT ETFs: Prefer passive diversification? Singapore-listed REIT ETFs like the NikkoAM-Straits Trading Asia Ex Japan REIT ETF or Lion-Phillip S-REIT ETF give you broad exposure. However, ETFs tend to be weighted towards large-caps so mid-cap yield uplift is diluted. Read our Singapore REIT ETF Guide for a full comparison.
Robo-advisors: Platforms like Syfe and Endowus offer REIT-focused portfolios. Syfe REIT+ is particularly popular — it tracks the iEdge S-REIT Leaders Index with managed rebalancing. For hands-off investors, this is a convenient entry point. You can use our Dividend Portfolio Yield Calculator to estimate annual income based on your allocation.
CPF/SRS Investment: S-REITs are eligible investments under the CPF Investment Scheme (CPFIS) and Supplementary Retirement Scheme (SRS). Using CPF OA funds (up to 35% of investable savings) to buy S-REITs can effectively boost returns above the CPF OA rate of 2.5%. See our CPF Investment Strategy guide for the full playbook.
Frequently Asked Questions
What is considered a mid-cap S-REIT in Singapore?
Which mid-cap S-REIT has the highest dividend yield in 2026?
Are mid-cap S-REITs safe to invest in?
How do I compare S-REIT gearing ratios?
Can I invest in S-REITs using CPF funds?
What is the difference between AIMS APAC REIT and Sabana REIT?
How does the S-REIT yield compare to Singapore Savings Bonds and T-bills?
Useful Tools & Resources
Use these free calculators to build your S-REIT investment strategy:
- REIT Dividend Yield Calculator — calculate income from any S-REIT at current or target prices
- S-REIT Gearing Ratio & ICR Calculator — stress-test gearing scenarios
- S-REIT Yield vs SGS Bond Spread Calculator — track the yield spread
- Dividend Portfolio Yield Calculator — model portfolio income
- Retirement Planning Calculator — model how REIT income contributes to retirement
This article was researched with the help of AI. While we strive to keep all information accurate and up to date, there may be errors. If you notice any discrepancies, please contact us.